




In December 1983, Indira Gandhi handed over the keys to the first Maruti 800 at a ceremony in Delhi. The car cost around ₹47,500, looked like a friendly toaster on wheels, and went on to become the default answer to “what car does your family own” for two full generations.
Then, quietly, it stopped selling. Emission and safety norms got stricter, the Alto took over as Maruti’s entry-level car, and by January 2014 the 800 was officially retired from production.
That whole arc, launch, boom, comfortable middle age, and eventual retirement, has a name in business school: the product life cycle. This article walks through the four stages, what happens to sales and profit in each, the strategies that fit them, a proper set of Indian and global examples (not just Apple and Coca-Cola for once), what product managers actually decide at each stage, a summary table you can lift straight into your notes, and where the whole model quietly falls apart. Yes, it falls apart. We’ll get there.
What Is the Product Life Cycle?
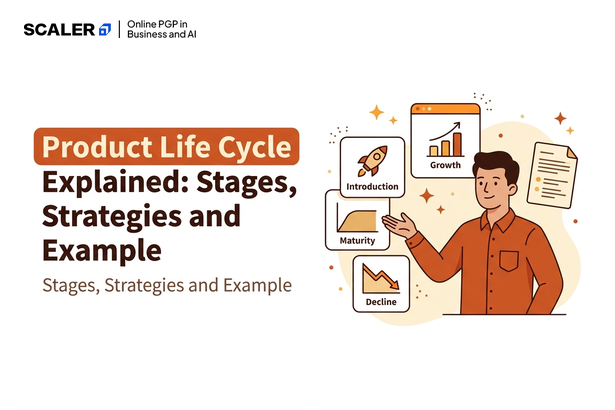
The product life cycle (PLC) is the sequence of stages a product moves through from launch to withdrawal from the market: introduction, growth, maturity and decline. Each stage comes with a fairly predictable pattern of sales, profit, competitive intensity and marketing strategy.
That’s the textbook definition. Here’s the bit textbooks tend to gloss over: there are actually two curves, not one.
• The sales curve looks like a stretched-out S. Slow start, steep climb, flattening plateau, gentle (or not so gentle) fall.
• The profit curve lags behind it. Profit is negative in introduction, crosses into positive territory sometime during growth, peaks before sales peak, and then erodes through maturity as competitors undercut each other on price.
Most students draw one curve and get marked down when an exam asks about profit specifically. Draw both, and label where they cross. That single label is worth more than half the paragraphs you could write about the model.
The idea itself isn’t new. It was popularised by Theodore Levitt in “Exploit the Product Life Cycle,” published in the Harvard Business Review in 1965. Levitt’s real point, often lost in the diagrams, was that the shape of the curve isn’t fixed by nature; a company’s own decisions bend it.
One more thing worth knowing before you move on: the curve looks different depending on what you’re plotting. A product class (say, passenger cars in India) has a much longer, flatter curve than a product form (hatchbacks) or a single brand (the Maruti 800 specifically). Arguments about “which stage are we in” are very often arguments about which of these three someone actually means.
The Four Stages of the Product Life Cycle
Quick version first, for anyone skimming this at 11pm before an exam:
1. Introduction — the product enters the market; sales are low, profit is negative.
2. Growth — sales rise fast; competitors show up; profit turns positive.
3. Maturity — sales plateau; competition peaks; profit erodes.
4. Decline — demand falls, usually because something better (or cheaper) has arrived.
Now the longer version, in table form, because this is the one thing worth screenshotting.
| Stage | Sales & profit | Marketing focus | Pricing | PM priority |
| Introduction | Low sales, slow growth. Profit negative, cost heavy. | Build category awareness; reach early adopters | Skimming (recover R&D fast) or penetration (grab share fast) | Prove the core use case works; kill it fast if it doesn’t |
| Growth | Sales climb steeply; profit turns positive and rises | Build brand preference over new rivals | Hold price, or trim slightly; add variants | Scale reliability; pay down the worst tech debt now |
| Maturity | Sales plateau; profit peaks then erodes | Defend share; segment and differentiate | Competitive, discounting, bundling | Retention over acquisition; extension strategies |
| Decline | Sales fall; profit falls faster | Minimal spend; harvest loyal buyers | Clear stock cheap, or milk a captive niche | Decide: revive, harvest, or sunset |
Introduction: the stage where you lose money on purpose
Negative profit here isn’t a red flag. It’s the point. You’re paying for R&D, building distribution from scratch, and spending on promotion against a tiny customer base. That’s expensive by design.
The pricing call is the one exam question you should be able to answer in your sleep: skim (price high, target early adopters who don’t mind paying) when the product is genuinely differentiated, switching cost is low, and capacity is limited anyway. Penetrate (price low, grab share fast) when the market is price-sensitive or network effects mean scale wins.
Growth: competitors show up, and that’s normal
If competitors are entering, that’s not a threat signal, it’s confirmation you found something real. The bottleneck usually shifts from “does anyone want this” to “can we get it to enough people.” Distribution becomes the actual constraint.
This is also the stage most founders and managers mistake for permanence. It isn’t. Growth rates that look infinite from inside a spreadsheet always, eventually, bend.
Maturity: the longest stage, and where most products actually live
Most products you can name right now are in maturity. Growth has flattened, the market is largely served, and the fight has moved to price, service and brand. This is where extension strategies earn their keep: new variants, new use cases, new packaging, entering new segments or geographies.
Amul and Fevicol are the standard Indian classroom examples here, and for good reason. Amul has stayed relevant for decades not by reinventing butter but by constantly adding formats, flavours and categories around the core brand.
Decline: not always the end, but usually treated that way
Structural decline (a substitute technology has genuinely replaced you) is very different from a bad quarter. Confusing the two is the expensive mistake. Three honest options exist here: harvest (cut cost, keep collecting revenue from loyal buyers), divest, or attempt a revival.
Revivals are real. They’re just rare, and the Royal Enfield story is the case worth remembering.
Four Stages, Five, or Six? Here’s the Honest Answer
If you’ve read more than one article on this topic (and given how this SERP looks, you probably have), you’ve noticed the stage count keeps changing. HubSpot and Salesforce teach six. GeeksforGeeks teaches five. We’re teaching four. Nobody explains why. Let’s fix that.
This article uses the classic four-stage model, introduction, growth, maturity, decline, because that’s what most Indian university syllabi, IGNOU material, Investopedia and Corporate Finance Institute all use, and because it’s what the term originally described: the behaviour of a product after it reaches the market.
• “Development,” added as a stage by some models, happens before there are any sales at all. Since the y-axis of the whole model is sales volume, there’s nothing to plot yet. We treat it as a bracketed pre-stage, not stage one.
• “Saturation,” added by the six-stage crowd, is really just the late, tired end of maturity, the point where nearly everyone who’ll ever buy has already bought.
If your syllabus or question paper explicitly lists five or six stages, answer with your syllabus’s version. The underlying logic doesn’t change, only the label count does. (Also worth cross-checking against IGNOU’s own course material, which you can read here.)
Product Life Cycle Examples: India First, Then the World
Examples are where most articles on this topic get lazy. “Coca-Cola is mature, Kodak is dead” isn’t analysis, it’s trivia. So here’s each stage with the actual evidence behind the placement, India first because that’s who’s mostly reading this.
Indian examples across the life cycle
Introduction — Ather Energy’s early years selling electric scooters in a market that had to be taught, from scratch, why an electric scooter was worth the premium over petrol. Category education, not brand competition, was the whole job.
Growth — quick commerce. Blinkit, Zepto and Instamart are still fighting for distribution and share, still spending heavily on subsidised delivery, and new entrants keep showing up. That’s a growth-stage market if there ever was one; for a founder’s-eye view of how an Indian consumer product scales through exactly this phase, this conversation with a Meesho co-founder is worth the watch (skip to around the 25-minute mark for the part on early competitive scaling).
Maturity — Amul butter and Maruti Suzuki’s mass-market hatchbacks. Category growth has flattened, buyers largely already know what they want, and both brands compete now on distribution depth, trust and constant small extensions rather than reinventing anything.
Decline — two textbook cases, and they’re textbook for a reason. The Maruti 800 was discontinued in January 2014 after emission and safety norms made it unviable and its own successor, the Alto, ate its lunch. And Nokia’s feature phones, which once held roughly 70% of India’s mobile device market, got flattened by the arrival of cheap Android smartphones. That’s structural decline: a substitute technology, not a bad year, did the damage.
The revival case — Royal Enfield. Sales had collapsed to around 2,000 units a month by 2000, and the brand looked close to finished. A redesign under Eicher Motors, a new engine, and a deliberate repositioning around motorcycling as a lifestyle rather than a utility turned it around completely, and it went on to dominate India’s mid-size motorcycle segment for most of the 2010s. Worth remembering: this is the exception, not the rule. Most declining products do not get a second act.
Global examples, briefly
Introduction — most of the current wave of AI-assisted consumer tools and next-gen EV categories globally, still educating buyers on why the thing exists at all. Growth — mainstream EVs and enterprise AI tooling, where adoption is accelerating and competitors keep piling in. Maturity — smartphones and video streaming, both largely saturated, competing on ecosystem and price rather than category growth. Decline — DVDs, digital point-and-shoot cameras, landlines.
Kodak deserves its own sentence because it’s the standard cautionary tale for a reason: it actually invented the digital camera internally and shelved it to protect film revenue. That’s not a company failing to see decline coming. That’s a company seeing it coming and flinching anyway.
Marketing and Pricing Strategy at Each Stage
This is where exam questions like to live, so here’s the strategy laid out across the classic 4Ps. A more detailed academic treatment of the same idea, for anyone who wants a second source, is in OpenStax’s Principles of Marketing, which is free and genuinely well written.
| Stage | Product | Price | Place | Promotion |
| Introduction | Basic version; one or two variants | Skim or penetrate, depending on differentiation | Limited, selective distribution | Educate the category; build awareness |
| Growth | Add features that widen the market | Hold or trim slightly | Broaden distribution fast | Build brand preference vs. rivals |
| Maturity | Extend: variants, formats, segments | Competitive; bundles and discounts | Maximise coverage; deepen channels | Differentiate on brand and service |
| Decline | Trim the range to what still sells | Cut price to clear stock, or raise it for a captive niche | Pull back from weak channels | Minimal; retain the loyal core |
The most common real-world mistake, and this applies as much to a startup as to a 40-year-old FMCG brand, is running growth-stage tactics in a mature market. Spending big on category education when the category is already understood just burns budget on demand that was already going to show up anyway.
Product Life Cycle vs. Product Development Process
Quick disambiguation, because these two get mixed up constantly and it’s a fair mix-up to make.
The product life cycle describes what happens to a product in the market after it launches. The product development process describes how a team actually builds the thing before it launches. One is about demand and competition; the other is about a team’s own workflow.
| Dimension | Product life cycle | Product development process |
| What it describes | Market behaviour after launch | Team’s build process before launch |
| Who drives it | The market: buyers, competitors, substitutes | The product and engineering team |
| When it applies | From launch until withdrawal | From idea until the first release |
They overlap constantly in practice, since development work never really stops, new features in growth, extensions in maturity, which is exactly why the two concepts get tangled up in conversation. Worth keeping separate on paper even if they blur in real life.
What Product Managers Actually Decide at Each Stage
Here’s the honest bit: hardly any working PM sits in a meeting and announces “we’ve entered the maturity stage.” Nobody talks like that. What they do instead is make a small set of recurring calls, and the correct answer to each one changes depending on where the product actually sits. The PLC is just useful shorthand for that shift.
Feature investment: what to build, and what to stop building
In introduction, build only what proves the core use case works. Anything else is a distraction you can’t afford yet. In growth, build what widens who can use the product at all. In maturity, build what retains and monetises existing users, and get comfortable saying no to more than you accept. In decline, build almost nothing beyond what’s needed to keep the lights on.
Pricing and packaging
Pricing power is highest in growth and erodes steadily through maturity, which is exactly why mature-product pricing work tends to be defensive: tiering, bundling, willingness-to-pay research to figure out where the next discount actually needs to sit rather than where it’s easiest to give one.
Technical debt: when to take it on, when to pay it off
This is the part almost nobody writes about, and it should be obvious once you say it out loud. In introduction, take on debt deliberately; you might not survive long enough to need to repay it. In growth, pay down the worst of it, because growth is exactly when sloppy shortcuts compound fastest and you can still afford the engineering time. In maturity, invest in the platform only where it protects margin. In decline, take on debt freely. You’re not maintaining this for another five years.
Sunsetting: the least glamorous, most career-defining call
Killing a product well is a real skill, and it’s underrated precisely because nobody wants to talk about it at a conference. The signals worth watching: a shrinking user cohort that’s still expensive to serve, a newer product in your own portfolio quietly cannibalising this one, or maintenance cost that’s stopped making sense.
Doing it well means giving advance notice, offering a genuine migration path, letting people export their data, setting a firm end-of-support date, and being straightforward about why. One team we’ve heard of noticed a product had quietly slipped into maturity not from a dip in headline revenue, which stayed flat and reassuring, but from cohort retention charts that had gone stubbornly flat for two quarters running. Revenue lies for a while. Retention rarely does.
Where the Product Life Cycle Model Falls Apart
Most pages that mention this model treat it like settled science. It isn’t, and pretending otherwise does readers no favours.
• It’s descriptive, not predictive. It tells you the shape markets often take. It does not tell you which stage you’re in right now, and it definitely can’t tell you how long a stage will last. Confident stage-calling is almost always done in hindsight.
It can become self-fulfilling, and this is the sharpest criticism levelled at it. A manager decides a product is “in decline,” cuts the marketing and R&D budget, and the cut is what actually causes the decline. This exact argument was made, decades ago, in Dhalla and Yuspeh’s “Forget the Product Life Cycle Concept!”, Harvard Business Review, 1976. It’s over fifty years old and still holds up, which tells you something.
• Not every product follows the curve. Fads spike and vanish with no real maturity phase. Staples like salt, cement or basic medicines sit comfortably in maturity for generations without ever declining. Seasonal products cycle up and down every year, not once.
Software and subscription products complicate the model badly enough that it’s worth its own paragraph. For a SaaS product, the unit that actually matters is the customer relationship, not a one-time unit sale. Revenue can keep climbing well into what looks like “maturity” through expansion and repricing, and because the product ships continuously, it’s never really finished in the way a physical product is. Metrics like churn and net revenue retention describe these businesses far better than a sales bell curve ever will. Don’t force one onto them. Individual features and versions inside a SaaS product absolutely do have their own smaller life cycles though, which is exactly why deprecation is a routine, unremarkable part of a PM’s job there.
• The unit of analysis is genuinely ambiguous. As covered earlier, brand, product form and product class curves all look different, and half of “which stage are we in” arguments are really disagreements about which of these three is being discussed.
One more, brief and worth knowing rather than dwelling on: Raymond Vernon’s international product life cycle points out that the same product can sit in different stages in different countries at the same time, mature in one market, still introducing in another. Relevant for Indian companies exporting, and for global brands entering India late. A whole separate topic, so we’ll leave it there.
Where the model still earns its keep: as a shared language that gets marketing, finance and engineering looking at the same picture of a market, and as a checklist of questions, is competition rising, is pricing power falling, is a substitute emerging, rather than as a forecast anyone should bet money on.
Quick Revision Table and How to Draw the Diagram
For anyone revising rather than running a product, here’s the condensed version.
| Stage | Sales | Profit | Competition | Strategy |
| Introduction | Low, slow rise | Negative | Little to none | Build awareness |
| Growth | Rising fast | Turns positive, climbs | Rising sharply | Build preference |
| Maturity | Plateau | Peaks, then erodes | Peak intensity | Defend, extend |
| Decline | Falling | Falling faster | Consolidating | Harvest or exit |
Drawing the diagram, step by step
• X-axis: time. Y-axis: sales and profit, label both.
• Sales curve: an S-shape, rising through introduction and growth, flattening across maturity, dropping in decline.
• Profit curve: starts below the x-axis in introduction, crosses zero somewhere in growth, peaks before the sales curve peaks, then slides down through maturity and decline.
• Four vertical dividers, one per stage, labelled underneath.
• Mark the break-even point where the profit curve crosses zero. This one detail is what most student answers miss, and it’s usually the difference between a pass and a good mark.
• Optional: a dotted line branching off the sales curve during maturity, showing what an extension strategy does to the shape.
For an exam answer specifically: define the PLC, draw the labelled two-curve diagram, describe each stage on sales, profit, competition and strategy, name one real example per stage, and close with a limitation of the model. That last line is the one almost nobody adds, and it’s exactly what separates an answer that gets full marks from one that gets most of them.
Frequently Asked Questions
What is the product life cycle?
The sequence of stages a product moves through from launch to withdrawal, introduction, growth, maturity and decline, each with its own pattern of sales, profit, competition and strategy. Popularised by Theodore Levitt in Harvard Business Review in 1965.
What are the 4 stages of the product life cycle?
Introduction (low sales, negative profit, market education), growth (rising sales and profit, competitors arrive), maturity (sales plateau, profit erodes) and decline (demand falls structurally, usually due to a substitute).
Is development a stage of the product life cycle?
Some models list it first, but development happens before there’s a market at all, so it sits outside the sales curve rather than on it. Treat it as a pre-stage. If your syllabus counts it as a stage, answer with your syllabus’s version.
Why do some sources show 5 or 6 stages?
Six-stage models add development at the front and split maturity into maturity and saturation, where saturation is really just the tired late phase of maturity. The classic four-stage version remains the standard in most Indian syllabi.
What happens to profit at each stage?
Negative in introduction, turns positive and climbs through growth, peaks in late growth or early maturity (before sales peak), then erodes through maturity and falls in decline.
What is an example of a product in the maturity stage?
Smartphones globally; in India, mass-market hatchbacks and established FMCG brands like Amul butter. Signals: flat volume growth, intense price competition, and growth coming mostly from replacement rather than new buyers.
What’s the difference between the product life cycle and the product development process?
The life cycle describes market behaviour after launch. The development process describes how a team builds the product before launch. One’s driven by demand and competition; the other’s driven by the team’s own workflow.
What are extension strategies?
Moves made during maturity to stretch the stage out and delay decline, new variants, new segments or geographies, new use occasions, repositioning, packaging changes. They lift the sales curve without needing a whole new product.
What are the limitations of the product life cycle model?
It describes, it doesn’t predict; you can’t confidently name your current stage or how long it’ll last. It risks being self-fulfilling when a “decline” label triggers the budget cuts that cause the decline. Fads, staples and subscription products often don’t follow the curve at all.
Does the product life cycle apply to SaaS and subscription products?
Only loosely. Subscription businesses are better read through retention, churn and net revenue retention than a sales bell curve, and continuous delivery means the product’s never really “finished.” Individual features inside them still have their own smaller life cycles though, which is why deprecation is routine.
The Short Version
The product life cycle is a map of how markets usually treat products. It’s genuinely useful for orienting yourself. It’s dangerous the moment you start reading it as a forecast.
Knowing the four stages gets you through an exam. Knowing what to actually decide at each one, what to build, what to charge, what to fix, and when to finally let something go, is closer to what running a product actually looks like. The framework’s easy enough to memorise in an evening. The judgment behind it takes a lot longer, and honestly, that’s the part worth spending your time on.
