Here’s the direct answer first, since that’s probably why you’re here: an MLOps pipeline is an automated, repeatable workflow that takes a machine learning model from raw data all the way to a live, monitored service in production, and then loops back to retrain it when things drift. The data in one end, a working model out the other, with checks at every stage so it doesn’t quietly fall apart six weeks later.
That last part matters more than people give it credit for. A commonly cited figure (it’s been floating around since a 2019 VentureBeat panel and gets re-quoted endlessly) puts the share of ML models that never reach production at somewhere around 87 to 90%. Whatever the exact number, the pattern behind it is real: most of the work isn’t building the model. It’s everything around it, the plumbing, the handoffs, the “who’s on call when this breaks at 2 AM” part. MLOps is the discipline that exists to fix exactly that.
If you’ve built models in notebooks before and are now staring at the gap between “it works on my machine” and “it works for 50,000 users, reliably, for months,” this is the explainer for that gap. We’ll go through what the pipeline looks like end to end, the tools people actually reach for at each stage, how MLOps differs from plain DevOps, and a checklist for not learning all of this the hard way.
What Is an MLOps Pipeline?
An MLOps pipeline is the automated sequence of steps that moves a machine learning project from raw data to a deployed, monitored model, and back again when retraining is needed. It’s essentially CI/CD borrowed from software engineering, except the “product” here isn’t just code, it’s code, data, and a trained model, all of which can change independently and all of which need to be versioned.
That last bit is the whole reason MLOps exists as its own field rather than just being “DevOps with extra steps.” A normal software deploy breaks because someone shipped buggy code. An ML deploy can break even when the code is perfectly fine, because the real-world data feeding the model quietly shifted underneath it. A pipeline that only checks code quality will miss that completely.
If this is the part of your career you’re trying to build toward, Scaler’s guide to the best MLOps courses in India is a reasonable starting point for comparing structured options.
MLOps Pipeline Architecture (Diagram)
Here’s what the architecture looks like laid out end to end. Four stages, each with its own moving parts, plus the retraining loop that ties stage four back into stages one and two.
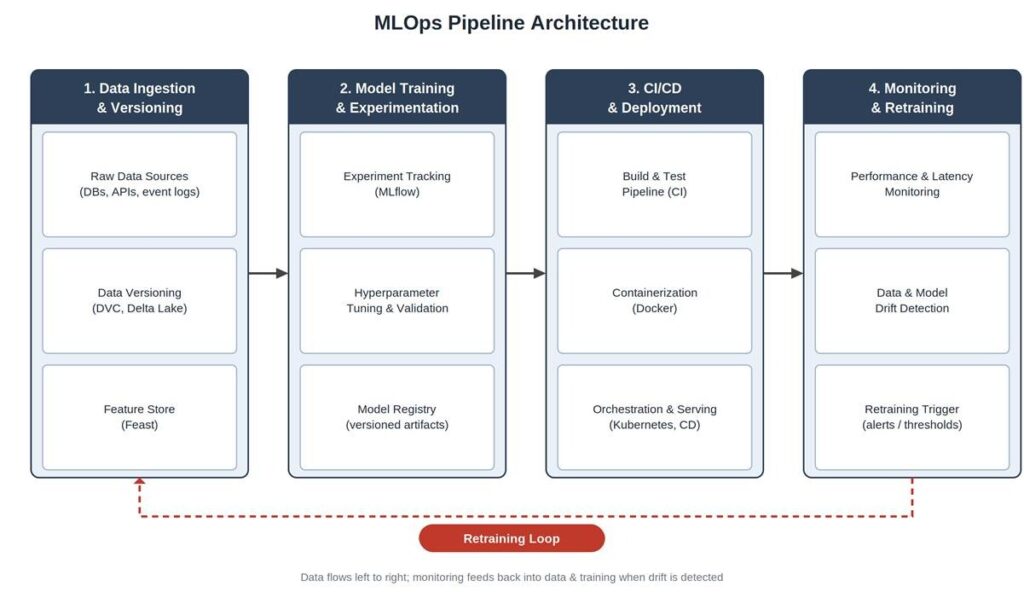
A quick way to read this: everything left of the dotted line happens more or less continuously while a model is being built or improved. The retraining loop at the bottom is what makes it a pipeline rather than a one-time project, it’s the difference between shipping a model once and actually operating one.
Stages of an MLOps Pipeline
At a high level, every MLOps pipeline, regardless of how fancy the tooling gets, comes down to four stages:
1. Data ingestion & versioning
2. Model training & experimentation
3. CI/CD & deployment

4. Monitoring & retraining
Worth saying upfront: these stages aren’t strictly linear in practice. Teams loop back, skip ahead, and run several stages in parallel for different model versions. But as a mental model, this ordering holds up, and it’s how most tooling and job descriptions are organised too.
1. Data Ingestion & Versioning
Every model is downstream of some data pipeline, and that pipeline needs to be both automated and versioned. “Versioned” is the part people skip early on, right up until someone asks “which exact dataset trained the model that’s currently live?” and the honest answer is a shrug.
This stage typically covers pulling data from source systems (databases, event streams, third-party APIs), validating and cleaning it, and pushing it into a feature store so training and serving use the exact same feature definitions. Tools like DVC or Delta Lake handle dataset versioning the way Git handles code, snapshots you can roll back to and diff against.
A lot of this groundwork overlaps with general infrastructure practice. If “everything as code” is new to you, Scaler’s primer on infrastructure as code covers the underlying idea, and it applies to data pipelines just as much as servers.
2. Model Training & Experimentation
This is the stage that gets all the attention in courses and the least attention in real production systems, mostly because it’s the fun part and the other three stages are where the actual engineering effort goes.
In a proper pipeline, training runs are tracked, not just eyeballed from a notebook output. Every run logs its hyperparameters, metrics, and resulting model artifact, usually via a tool like MLflow, so that “which version performed best, and why” has an actual answer six months later. The best-performing models get pushed into a model registry, which is essentially version control for trained models, complete with stage labels like “staging” and “production.”
This is also where reproducibility either gets baked in or quietly skipped. If a training run can’t be reproduced from its logged config and data version, debugging a production issue later turns into archaeology.
3. CI/CD & Deployment
Once a model from the registry is marked production-ready, the CI/CD pipeline takes over. This usually means: running automated tests (on code and on the model’s behaviour against known cases), packaging the model and its dependencies into a container, and rolling it out, often gradually via canary or shadow deployments rather than flipping a switch for everyone at once.
If you’ve worked with software CI/CD before, this stage will feel familiar with a few extra checks bolted on. If you haven’t, Scaler’s overview of a DevOps pipeline and the broader DevOps roadmap are good places to get the underlying CI/CD concepts straight before layering ML-specific bits on top.
The container piece matters more than it sounds like it should. “It worked in training” and “it works when called from a production API under load” are different claims, and Docker plus an orchestrator like Kubernetes is how that gap gets closed consistently.
4. Monitoring & Retraining
A deployed model is not a finished model. It’s a model that started a slow, quiet argument with reality, and reality usually wins eventually. Monitoring is how you find out before your users do.
Two things get tracked here. Operational metrics (latency, error rates, throughput) are the same as any other service. Model-specific metrics are the interesting part: prediction distributions, feature drift, and accuracy against ground truth where it’s available. When drift crosses a defined threshold, that’s the signal that loops back to stage one or two, new data gets pulled in, the model gets retrained, and the cycle continues.
This feedback loop is the single biggest thing that separates a “deployed model” from an “operated model.” Without it, you’ve built a very elaborate way to deploy something once.
MLOps Tools by Stage
Tooling in this space changes every few months, so treat this as a map of categories rather than a permanent shortlist. The pattern matters more than any individual logo.
| Stage | Purpose | Popular Tools |
| Data Ingestion & Versioning | Pull, validate, and version datasets and features | Apache Airflow, DVC, Delta Lake, Feast |
| Model Training & Experimentation | Track experiments, tune models, manage versions | MLflow, Kubeflow Pipelines, Weights & Biases, Optuna |
| Model Registry | Store and version trained model artifacts with stage labels | MLflow Model Registry, SageMaker Model Registry |
| CI/CD & Deployment | Automate testing, packaging, and rollout | GitHub Actions/Jenkins, Docker, Kubernetes, Seldon/KServe |
| Monitoring & Retraining | Track performance, detect drift, trigger retraining | Evidently AI, Prometheus + Grafana, Arize, WhyLabs |
For a closer look at how these fit together (and which ones are worth learning first if you’re prioritising), Scaler’s roundup of MLOps tools goes into more depth on each category.
MLOps vs DevOps
Short version: MLOps is DevOps with two extra moving parts, data and the model itself, both of which can degrade silently even when the code hasn’t changed at all. That single difference cascades into most of the practical distinctions below.
| Aspect | DevOps | MLOps |
| What’s being shipped | Application code | Code, data, and trained model artifacts |
| What can cause a “regression” | A code change | A code change, a data change, or model/data drift, with no code change at all |
| Testing focus | Unit, integration, and end-to-end tests | Same, plus model validation, data quality checks, and bias/performance checks |
| Versioning needs | Source code (Git) | Source code, datasets, features, and model artifacts, all versioned together |
| Triggers for redeployment | New code merged | New code, new data, or detected drift in production |
| Monitoring focus | Uptime, latency, error rates | All of the above, plus prediction quality and data/feature drift |
None of this means MLOps replaces DevOps, it sits on top of it. If the DevOps fundamentals (CI/CD, containers, infrastructure as code) feel shaky, Scaler’s DevOps tutorial is worth working through first. MLOps practices stack much better on a foundation that’s already solid.
MLOps Best Practices
Most of these sound obvious written down. Most teams still skip at least two of them, usually the ones that feel like “we’ll add that later.” Later rarely arrives on its own.
• Version everything, not just code: data, features, configs, and model artifacts all need their own version history, with a way to trace any production prediction back to the exact combination that produced it
• Make training reproducible: a training run should be re-runnable from logged configs and data versions, producing the same (or near-identical) result, otherwise debugging later is mostly guesswork
• Automate the boring stuff first: data validation, model testing, and packaging should run without anyone remembering to click a button, because eventually nobody will
• Monitor the model, not just the server: uptime dashboards won’t tell you the model’s predictions have quietly drifted toward useless
• Set explicit retraining triggers: decide in advance what drift or performance drop level kicks off retraining, rather than discovering the answer during an incident
• Roll out gradually: canary or shadow deployments catch problems on a small slice of traffic before they become a full incident
• Document the handoffs: data scientists, ML engineers, and DevOps/SRE teams need a shared, written understanding of who owns what when something breaks at an odd hour
If you’re building toward a role where this is the day job, Scaler’s DevOps course and Machine Learning course both feed into this skill set from either side, infrastructure or modelling, and the MLOps roadmap lays out a sequencing if you’d rather plan the whole path before starting. Scaler’s Academy programs also cover this ground for those looking for a more structured, cohort-based path.
A Minimal End-to-End Example
To make this less abstract, here’s what a small but real pipeline might look like for, say, a churn prediction model:
• Airflow pulls yesterday’s customer activity data into a feature store nightly, with DVC tagging the new data snapshot
• A training job runs on a schedule (or on demand), logging metrics and parameters to MLflow, and registering the resulting model if it beats the current production version on a validation set
• A CI pipeline runs automated tests against the new model (basic sanity checks, performance thresholds), then builds a Docker image and deploys it behind the existing API, initially to 5% of traffic
• Evidently AI (or similar) compares incoming prediction data against the training distribution daily, and Grafana dashboards surface latency and error rates alongside it
• If drift crosses a set threshold, or accuracy on newly labelled data drops below a floor, an alert fires and the retraining job is triggered automatically, or flagged for a human to approve
Nothing here is exotic. It’s the same handful of stages from the diagram above, just with specific tools plugged into each slot. Most real pipelines are variations on this, with more stages added as the team’s confidence (and budget) grows.
Finally, The FAQs
Q1. What is an MLOps pipeline?
An MLOps pipeline is an automated, repeatable workflow that takes a machine learning model from raw data through training, deployment, and monitoring in production, with a feedback loop that triggers retraining when performance drops or the underlying data shifts.
Q2. What are the stages of an MLOps pipeline?
There’s four of these: data ingestion and versioning, model training and experimentation, CI/CD and deployment, and monitoring and retraining. In practice these loop back into each other rather than running strictly once.
Q3. What tools are used in MLOps?
Commonly: Airflow or Kubeflow Pipelines for orchestration, MLflow for experiment tracking and model registry, DVC for data versioning, Docker and Kubernetes (via Kubeflow) for packaging and deployment, and tools like Evidently AI or Prometheus/Grafana for monitoring. The MLOps tools guide breaks these down by stage in more detail.
Q4. What is the difference between MLOps and DevOps?

MLOps extends DevOps practices to cover data and models, not just code. That means versioning datasets and model artifacts alongside code, testing model behaviour and data quality in addition to software functionality, and monitoring for drift, since a model can fail in production even when no code has changed.
Q5. How do you build an MLOps pipeline?
Start small and add automation stage by stage: get data ingestion and versioning working first, then add experiment tracking and a model registry, then wrap deployment in CI/CD with basic tests, and finally add monitoring with a defined retraining trigger. Trying to build all four stages at once, fully automated, on day one is usually how projects stall. Scaler’s MLOps roadmap walks through a more gradual sequencing.
Q6. What is CI/CD in MLOps?
In MLOps, CI/CD covers the same automated build-test-deploy cycle as regular software, but extended to data and models. Continuous Integration includes testing data quality and model performance alongside code, and Continuous Deployment includes packaging and rolling out new model versions, often gradually, in addition to application code.