
The demand for data analysts continues to rise in India and globally because companies rely heavily on real-time insights, automated dashboards, and data-driven decisions. This data analyst roadmap 2026 provides a complete, structured, and updated guide for anyone planning to enter the field. Unlike traditional guides, this roadmap reflects the latest changes in analytics such as cloud-first systems, edge analytics, streaming dashboards, and self-service BI. Whether you are a student, a career-switcher, or an early professional, this roadmap helps you understand the skills, tools, projects, and learning path required to succeed in the data analyst career path 2026.
As organizations continue processing massive datasets from apps, IoT devices, digital payments, and cloud platforms, the need for capable analysts is growing. Salaries, job openings, and career opportunities are expected to increase even more in 2026. This updated data analyst roadmap 2026 shows exactly how to prepare for these opportunities with the right tools, the right training, and the right project portfolio.
What is a Data Analyst & Why Now in 2026?
A data analyst converts raw data into insights that support better business decisions. In 2026, the role has expanded because companies now work with real-time data, online behavior patterns, streaming dashboards, mobile analytics, and edge-based calculations. Modern analysts also work with automated BI tools, cloud data warehouses, API-based reporting, and AI-assisted analytics.
A major reason to choose the data analyst career path 2026 is the massive increase in data volume. Businesses use dashboards across finance, ecommerce, logistics, education, and healthcare. As more organizations shift toward digital operations, the requirement for people who understand data grows. Salaries are competitive, and career progression is strong because analysts can transition into senior analytics roles, business intelligence roles, or even data science roles.
This updated data analyst roadmap 2026 helps you understand these trends and prepare for them with the right mix of technical and analytical skills.know what to learn, how to practice, and how to position yourself as a job-ready data analyst.
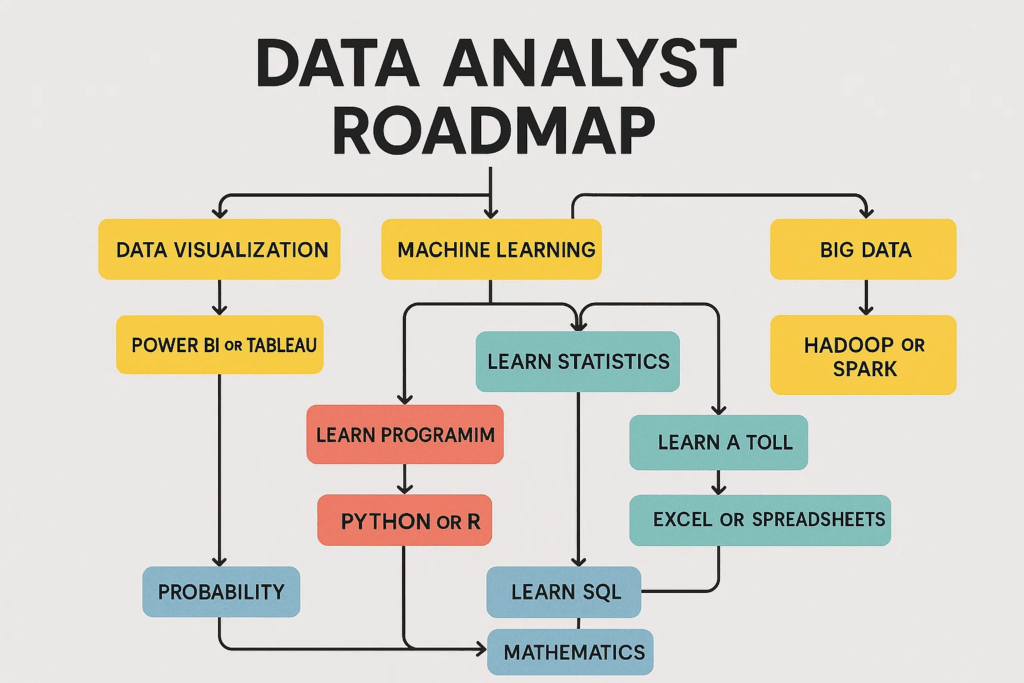


Core Skills & Tools for Data Analysts (2026 Edition)
Modern analysts must master both foundational and advanced data analytics tools 2026. These tools help with cleaning, analyzing, visualizing, and communicating insights. The following table summarizes the core skill categories and their importance.
| Skill Area | Key Tools | Why Important in 2026 |
| Data Wrangling & Cleaning | Excel, Python (Pandas) | Handle real-time and large datasets efficiently |
| Databases & Querying | SQL, NoSQL, Cloud SQL | Data volume growing; complex queries required |
| Programming & Automation | Python, R, APIs | Automate dashboards, reports, and processes |
| BI & Visualization | Power BI, Tableau, Looker | Business leaders need interactive insights |
| Cloud & Edge Analytics | BigQuery, Snowflake, AWS Analytics | Data moving to cloud; edge analytics emerging |
These tools form the backbone of the data analyst skill set 2026, and mastering them increases employability and salary potential.
Domain Specialisation for 2026
Domain specialisation is becoming one of the most important parts of the data analyst roadmap 2026 because companies now prefer analysts who understand both data and the business behind it. Having domain knowledge improves decision making, increases job opportunities, and helps analysts grow faster into senior roles. It strengthens the data analyst skill set 2026 and makes your profile stand out in a competitive job market.
In 2026, several domains are driving strong hiring demand:
Marketing Analytics: This involves understanding customer behaviour, analysing campaign performance, and identifying funnel drop offs. Companies rely on marketing analysts to optimise ads, improve conversions, and personalise customer journeys. As marketing becomes more data driven, this specialisation plays a major role in shaping the data analyst career path 2026.
Financial Analytics: This domain focuses on revenue tracking, financial forecasting, credit risk assessment, and fraud detection. Analysts in finance work with sensitive and high stakes data, making this one of the most respected and well paid specialisations. The importance of financial compliance and digital transactions has increased the value of financial analytics in the 2026 job market.
Healthcare Analytics: Healthcare companies use data to improve patient outcomes, understand treatment patterns, and increase operational efficiency. Analysts help hospitals and health tech startups manage massive volumes of patient data and optimise workflows. The growth of digital health platforms makes healthcare analytics an important part of the overall data analyst roadmap 2026.
Here is a summary table for you. Do check this out and read along for a detailed data analyst roadmap:
| Step | What You’ll Learn | Suggested Timeline |
| 1. Learn the Basics – Math, Stats & Excel | Core math functions, descriptive stats, quick analysis | 4-6 weeks |
| 2. Learn SQL and Databases | Querying, joins, subqueries, window functions | 3-4 weeks |
| 3. Pick a Programming Language | Python (pandas, NumPy, matplotlib, seaborn) or R (dplyr, ggplot2) | 4-6 weeks |
| 4. Data Cleaning & Exploration | Handle missing values, outliers, and feature engineering | 2-3 weeks |
| 5. Data Visualization & Reporting | Principles of dashboards, storytelling with data | 3-4 weeks |
| 6. Projects & Portfolio | Beginner to advanced projects, GitHub hosting | Ongoing |
What is Data Analysis?
Data analysis is the process of examining raw data to interpret patterns, trends, and insights to help businesses understand key findings of their problem area. It involves cleaning, transforming, and interpreting data so organizations can act on it effectively.
There are four main types:
- Descriptive: Summarizes past data (e.g., monthly sales reports).
- Diagnostic: Explains why something happened (e.g., drop in website traffic).
- Predictive: Forecasts future outcomes (e.g., demand prediction in retail).
- Prescriptive: Suggests actions to optimize results (e.g., personalized product recommendations).
Build your analytics foundation now — live masterclasses can set the pace.
Scaler Masterclasses
Learn from industry experts and accelerate your career with hands-on, interactive sessions.
To make you understand better, here’s what happens in a real-life scenario: banks analyzing transactions to detect fraud, healthcare providers using data to improve patient outcomes, and e-commerce platforms studying user behavior to increase sales.
Who is a Data Analyst and What Do They Do?
A data analyst is a professional who is expected to structure raw data and interpret the findings. Their role usually involves:
- Collecting data from databases, spreadsheets, or APIs.
- Cleaning and preparing it to remove errors or inconsistencies.
- Analyzing trends using statistical methods and visualization.
- Communicating findings clearly through dashboards, reports, or presentations.
Some common tools include Excel, SQL, Python, Tableau, and Power BI.
And how is a data analyst different from others?
While data scientists build predictive models and work on advanced machine learning, and data engineers focus on managing pipelines and infrastructure, data analysts focus on descriptive and diagnostic insights that guide business decisions day to day.
Step-by-Step Roadmap to Become a Data Analyst in 2026

Step 1: Learn the Basics: Math, Stats & Excel
Start with the essentials that every data analyst uses daily: basic math, core statistics, and practical Excel skills. These let you understand datasets, spot patterns, and produce quick answers for business questions.
Theory meets practice: attend a free live masterclass and turn these roadmap steps into action.
Upcoming Scaler Events
What to learn
- Mathematics: functions, probability, calculus, algebra, basic logic, and arithmetic needed to manipulate formulas and interpret results.
- Statistics: descriptive stats, i.e., mean, median, mode, variance, distributions, sampling, and basic inferential ideas like confidence intervals, p-values.
- Excel: data cleaning, pivot tables, VLOOKUP/XLOOKUP, conditional formulas, and basic charts for quick analysis.
Here are some resources that you can use as a beginner:
- You can refer to Data Analytics Essentials for math refreshers or short Coursera modules for statistics.
- For Excel, follow Microsoft’s beginner-to-intermediate tutorials or credible courses on LinkedIn Learning.
And if you feel stuck after all the trial and error, try to enroll in a program that provides guidance, mentorship, a proper roadmap, and career growth potential, such as Scaler’s Data Science Program. Here, we guide our students in every way we can, from preparing a learning structure to assisting industry experts. So, do check out and don’t hesitate to contact us for any queries!
Take action on your goals, join a free live session with our experts.
Upcoming Scaler Events
Suggested timeline: 4-6 weeks of regular practice.
Step 2: Learn SQL and Databases
Once you’re comfortable with math, stats, and Excel, the next must-have skill is SQL. Almost every company stores data in relational databases (RDBMS), and SQL is the language that lets you query, filter, and extract the information you need.
What to learn
- SQL basics: SELECT, WHERE, ORDER BY, GROUP BY.
- Joins: combine multiple tables to get richer insights.
- Subqueries & Window Functions: advanced queries for ranking, running totals, and moving averages.
Databases to know
- MySQL and PostgreSQL are widely used for business data.
- Cloud-based tools like Google BigQuery are common in larger organizations.
How to learn
- Practice with free platforms like LeetCode, Mode Analytics tutorials, or datasets on Kaggle.
- Apply queries on open datasets, e.g., COVID-19 data, e-commerce transactions.
Suggested timeline: 3-4 weeks, with daily query practice.
Step 3: Pick a Programming Language (Python or R)
While SQL and Excel are great for handling data, you’ll eventually need a programming language for deeper analysis, automation, and advanced visualization. The two most popular options are Python and R.
Python/R
- Python: It is used for general-purpose, easy to learn, and widely used in both data analytics and data science. Great for automation, dashboards, and integrating with machine learning.
- R: Built for statistical analysis and research-heavy projects. Popular in academia and among analysts focusing on advanced statistical modeling.
When to choose which
Choosing a programming language is essential; you can always learn both, but specializing in one is better aligned with your career. If you see yourself moving toward data science, ML, or automation, go with Python. If your focus is statistics, surveys, or research-heavy roles, consider R.
Key libraries to learn
- Python: pandas and NumPy for data handling, matplotlib and seaborn for visualizations.
- R: dplyr for data manipulation, ggplot2 for visualization.
How to learn effectively
- Use Jupyter Notebook or RStudio for interactive coding.
- Practice with open datasets on Kaggle.
![[DS] Not sure how to be a top data scientist](https://scaler-blog-prod-wp-content.s3.ap-south-1.amazonaws.com/wp-content/uploads/2024/11/19104522/Banner-1-2.jpg)
Also, Check out: R Programming for Data Science
Suggested timeline: 4-6 weeks of consistent practice.
Step 4: Data Cleaning & Exploration
Before you can analyze or model data, you need to make sure it’s clean and structured. In practice, data rarely comes ready-to-use, which is why cleaning and exploratory data analysis (EDA) are critical skills for analysts.
Key steps in data cleaning
- Handling missing values: decide whether to drop, fill, or impute them.
- Outlier detection: use boxplots, z-scores, or domain rules to identify unusual values.
- Feature engineering basics: create new variables to make data more useful.
EDA practices
- Summarize data with descriptive statistics, i.e, mean, median, and variance.
- Visualize distributions and relationships with histograms, scatter plots, or correlation heatmaps.
- Spot trends, anomalies, or biases before running deeper analysis.
For example: In an e-commerce dataset, you might clean duplicate transactions, engineer features like “purchase frequency,” and run EDA to see which customer groups spend the most.
Suggested timeline: 2-3 weeks.
Step 5: Learn Data Visualization & Reporting
You are able to interpret the data, but what if your team is unable to understand it? And that’s why data visualization is important.
Principles of good visualization
- Keep charts simple and focused; always avoid clutter.
- Use the right chart type, like bar for comparison, line for trends, scatter for relationships.
- Highlight insights along with data points.
Dashboards & storytelling
If there are multiple aspects to showcase, then it’s best to prepare dashboards that combine visuals, filters, and KPIs. This helps stakeholders understand the data easily. The main goal is to make the teams understand the numbers as to what they mean and why they matter.
Tools to learn
- Tableau: Widely used for interactive dashboards.
- Power BI: Strong integration with Microsoft tools, popular in enterprises.
- Looker Studio: Free and cloud-friendly for quick reporting.
Try learning these tools while practicing on various datasets you can find online; it’ll be good practice and can help you polish your skills.
Step 6: Projects, Portfolio & Practice
The best way to grow credibility in the field of data analytics is to build a good portfolio, and that can be made very easily by the projects you volunteer for.
Here are some project ideas that you can try:
- Beginner projects: sales reports, survey analysis, simple dashboards.
- Intermediate projects: customer churn analysis, loan approval insights, A/B testing reports.
Our students usually practice with datasets along with learning theoretically. Hence, it makes it easier for them to make a full portfolio by the time they are done with the program.
Use Kaggle or public datasets like the UCI Machine Learning Repository to practice. Document your workflow, visualize results, and share conclusions. Hosting projects on GitHub shows technical skills, while a personal portfolio site or LinkedIn posts clearly validate your skills and ability.
You should aim for 3-5 polished projects that highlight different skills like SQL queries, visualization dashboards, Python analysis, and reporting.
How Scaler Academy Can Help in Your Data Analytics Journey?
Following this roadmap alone can feel overwhelming. The Scaler Data Science Program is designed to guide you through each step, from math and SQL basics to EDA, visualization, and advanced projects. With live classes, 1:1 mentorship, and practical projects, at Scaler, we ensure that your concept learning and real-world application go hand-in-hand.
Other Valuable Skills for Data Analysts
In today’s job market, having a value-added skill set along with technical skills is very important. Here are some skills that you might want to work on:
1. Business Acumen
Understanding the domain you work in makes your interpretations and insights more understandable. For example, in finance, you might analyze credit risk, while in healthcare, it could be patient outcomes. Knowing the business context helps you ask the right questions and deliver results accordingly
2. Communication & Soft Skills
With enough practice, you’ll get the hang of preparing your dashboards and charts, but what’s important is to communicate your findings in a language your team can understand. Clear presentations, storytelling with data, and translating technical terms into plain language can help you.
3. Basics of Big Data & Cloud
As datasets grow, exposure to tools like Apache Spark and cloud-based SQL (Google BigQuery, AWS Redshift, Azure Synapse) can boost your career. While not mandatory for entry-level roles, they’re valuable for growth into senior positions.
Career Path & Job Opportunities
Here are some opportunities that you can look for after learning all the concepts and tools for data analytics:
Entry-Level Titles
- Junior Data Analyst
- Reporting Analyst
- Business Analyst
These roles focus on data collection, basic cleaning, and creating simple reports.
Mid-Level to Advanced Roles
- Senior Data Analyst
- BI Analyst
- Analytics Consultant
These involve deeper analysis, mentoring, dashboard ownership, and sometimes managing a small team or influencing strategy.
Here are some salary ranges you can expect in accordance with your experience:
| Experience Level | India (Annual Salary) | United States (Annual Salary) |
| Entry-Level (0-2 yrs) | ₹5-₹10 LPA | $33k-$81k |
| Mid-Level (3-5 yrs) | ₹5-₹12 LPA | $51k-$138k |
| Senior / Advanced | ₹13-₹18 LPA | $70k-$148k |
![[DS] think data science is for you](https://scaler-blog-prod-wp-content.s3.ap-south-1.amazonaws.com/wp-content/uploads/2024/11/19104524/Banner-2-2.jpg)
Source: Glassdoor Reports & Indeed Insights
When finding opportunities, it is important to follow current market trends. Try to keep up with the latest tools, upskill with credible certifications, and finally, always carry on with a job search on various job portals and company websites. This will give you an idea as to how often the roles are open and what the most desirable requirements are.
Conclusion
Becoming a data analyst might take time. You will have to cover various topics from math, stats, and Excel to SQL, Python/R /R, visualization, and even practical projects. The data analytics roadmap shows you exactly where to begin and how to progress. The point is to start small, practice consistently, and focus on refining your major skill set.
If you want guided learning, mentorship, and projects that prepare you for jobs, programs like Scaler’s Data Science course can provide helpful resources for your journey.
Don’t hesitate too much and believe in yourself., Take the first step!
Read These Important Roadmaps: More Paths to Career Success
FAQs
Can you become a data analyst in 3 months?
You can cover basics like Excel, SQL, and simple dashboards in three months, but becoming job-ready usually takes 6-9 months of consistent practice and projects.
How much SQL is needed for data analysts?
You don’t need to master everything, but you should be comfortable with joins, subqueries, aggregations, and window functions. These cover 80% of real-world tasks.
Is data analysis still in demand in 2025 and beyond?
Yes. Businesses continue to rely on analysts to guide decisions. Demand is growing across finance, healthcare, e-commerce, and government roles.
Should I learn SQL or Tableau first?
Start with SQL; it’s an important tool for data extraction. Once you can query data, move to Tableau or Power BI for visualization.
Can you become a data analyst without a tech degree?
Yes. Many analysts come from economics, business, or even the humanities. What matters is skills, projects, and a strong portfolio.
Is Python necessary for data analysts?
Not always for entry-level roles, but Python expands your ability to handle complex analysis, automation, and career growth.
What are the key differences between a data analyst and a data scientist?
Analysts focus on descriptive and diagnostic insights, while data scientists build predictive models and advanced ML solutions.
How do I get real-world experience as a beginner?
Start with Kaggle datasets, contribute to GitHub, and apply for internships or freelance projects. Even small case studies count as experience.