
The demand for data analysts continues to rise in India and globally because companies rely heavily on real-time insights, automated dashboards, and data-driven decisions. This data analyst roadmap 2026 provides a complete, structured, and updated guide for anyone planning to enter the field.
Unlike traditional guides, this roadmap reflects the latest changes in analytics such as cloud-first systems, edge analytics, streaming dashboards, and self-service BI. Whether you are a student, a career-switcher, or an early professional, this roadmap helps you understand the skills, tools, projects, and learning path required to succeed in the data analyst career path 2026.
As organizations continue processing massive datasets from apps, IoT devices, digital payments, and cloud platforms, the need for capable analysts is growing. Salaries, job openings, and career opportunities are expected to increase even more in 2026. This updated data analyst roadmap 2026 shows exactly how to prepare for these opportunities with the right tools, the right training, and the right project portfolio.Accelerate your journey: If you’re looking for a structured learning path with mentorship and placement support, explore Scaler’s Data Analytics Program.
What is a Data Analyst & Why Now in 2026?
A data analyst converts raw data into insights that support better business decisions. In 2026, the role has expanded because companies now work with real-time data, online behavior patterns, streaming dashboards, mobile analytics, and edge-based calculations. Modern analysts also work with automated BI tools, cloud data warehouses, API-based reporting, and AI-assisted analytics.
A major reason to choose the data analyst career path 2026 is the massive increase in data volume. Businesses use dashboards across finance, ecommerce, logistics, education, and healthcare. As more organizations shift toward digital operations, the requirement for people who understand data grows. Salaries are competitive, and career progression is strong because analysts can transition into senior analytics roles, business intelligence roles, or even data science roles.
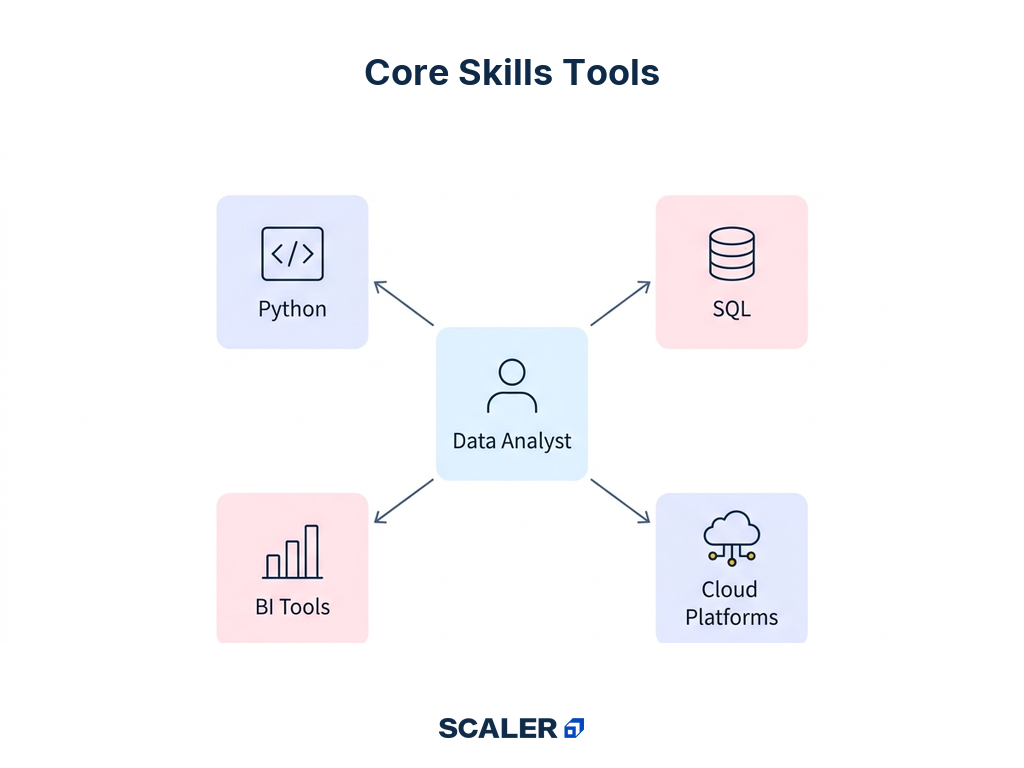
Core Skills & Tools for Data Analysts (2026 Edition)
Modern analysts must master both foundational and advanced data analytics tools. These tools help with cleaning, analyzing, visualizing, and communicating insights.
| Skill Area | Key Tools | Why Important in 2026 |
| Data Wrangling & Cleaning | Excel, Python (Pandas) | Handle real-time and large datasets efficiently |
| Databases & Querying | SQL, Cloud SQL, BigQuery | Complex queries required as data volume grows |
| Programming & Automation | Python, R, APIs | Automate dashboards, reports, and ETL processes |
| BI & Visualization | Power BI, Tableau, Looker | Business leaders need interactive, self-service insights |
| Cloud & Edge Analytics | Snowflake, AWS, Azure | Data is moving to cloud; edge analytics emerging |
Domain Specialisation for 2026
Domain specialisation is becoming one of the most important parts of the data analyst roadmap 2026 because companies now prefer analysts who understand both data and the business behind it. Having domain knowledge improves decision making, increases job opportunities, and helps analysts grow faster into senior roles.
In 2026, several domains are driving strong hiring demand:
- Marketing Analytics: Optimizing ads, improving conversions, and analyzing customer behavior/funnels.
- Financial Analytics: Revenue tracking, credit risk assessment, fraud detection, and compliance.
- Healthcare Analytics: Improving patient outcomes, managing hospital data, and optimizing workflows in digital health.
Supply Chain & Logistics: Route optimization, inventory forecasting, and real-time tracking.
These tools form the backbone of the data analyst skill set 2026, and mastering them increases employability and salary potential.
Step-by-Step Roadmap to Become a Data Analyst in 2026
Step 1: Learn the Basics: Math, Stats & Excel
Start with the essentials that every data analyst uses daily: basic math, core statistics, and practical Excel skills. These let you understand datasets, spot patterns, and produce quick answers for business questions.
What to learn
- Mathematics: Functions, probability, calculus, algebra, and basic logic.
- Statistics: Descriptive stats (mean, median, mode, variance, distributions) and basic inferential ideas (confidence intervals, p-values).
- Excel: Data cleaning, pivot tables, VLOOKUP/XLOOKUP, conditional formulas, and basic charts.
- Resources: Use free online courses for statistics or practice with Kaggle’s free micro-courses.
Suggested timeline: 4-6 weeks of regular practice.
Step 2: Learn SQL and Databases
Once you’re comfortable with math, stats, and Excel, the next must-have skill is SQL. Almost every company stores data in relational databases (RDBMS), and SQL is the language that lets you query, filter, and extract the information you need.
What to learn
- SQL basics: SELECT, WHERE, ORDER BY, GROUP BY.
- Joins: Combine multiple tables to get richer insights.
- Advanced Queries: Subqueries, window functions (ranking, running totals, moving averages), and CTEs.
- Databases: MySQL, PostgreSQL, and cloud-based tools like Google BigQuery.
How to learn
- Practice with free platforms like LeetCode (SQL track) or Mode Analytics tutorials.
- Apply queries on open datasets (e.g., COVID-19 data, e-commerce transactions).
Suggested timeline: 3-4 weeks, with daily query practice.
Step 3: Pick a Programming Language (Python or R)
While SQL and Excel are great for handling data, you’ll eventually need a programming language for deeper analysis, automation, and advanced visualization. The two most popular options are Python and R.
When to choose which
- Python: General-purpose, easy to learn, widely used in both data analytics and machine learning. Great for automation and dashboards.
- R: Built for statistical analysis and research-heavy projects. Popular in academia.
Key libraries to learn
- Python: pandas and NumPy for data handling, matplotlib and seaborn for visualizations.
- R: dplyr for data manipulation, ggplot2 for visualization.
Suggested timeline: 4-6 weeks of consistent practice.
Step 4: Data Cleaning & Exploration
Before you can analyze data, you need to make sure it’s clean and structured. In practice, data rarely comes ready-to-use, which is why cleaning and exploratory data analysis (EDA) are critical skills.
Key steps in data cleaning
- Handling missing values: decide whether to drop, fill, or impute them.
- Outlier detection: use boxplots, z-scores, or domain rules to identify unusual values.
- Feature engineering basics: create new variables to make data more useful.
EDA practices
- Summarize data with descriptive statistics.
- Visualize distributions and relationships with histograms, scatter plots, or correlation heatmaps.
- Spot trends, anomalies, or biases before running deeper analysis.
Suggested timeline: 2-3 weeks.
Step 5: Learn Data Visualization & Reporting
You are able to interpret the data, but what if your team is unable to understand it? Data visualization is the bridge between raw numbers and business decisions.
![[DS] Not sure how to be a top data scientist](https://scaler-blog-prod-wp-content.s3.ap-south-1.amazonaws.com/wp-content/uploads/2024/11/19104522/Banner-1-2.jpg)
Principles of good visualization
- Keep charts simple and focused; always avoid clutter.
- Use the right chart type (bar for comparison, line for trends, scatter for relationships).
- Highlight insights alongside data points.
Tools to learn
- Tableau: Widely used for interactive dashboards.
- Power BI: Strong integration with Microsoft tools, popular in enterprises.
- Google Looker Studio: Free and cloud-friendly for quick reporting.
Suggested timeline: 3-4 weeks.
Data Analyst Skills Checklist (2026)
Use this self-assessment to identify your current level and which roadmap step to focus on next.
| Tier | Skills | Maps to Step |
| Foundation | Excel (advanced formulas, Power Query, pivots), descriptive statistics, data cleaning principles | Step 1 |
| Core Technical | SQL (joins, GROUP BY, subqueries, window functions, CTEs); Python (Pandas, NumPy) or R | Steps 2–3 |
| Data Prep & EDA | Handling missing values, outlier detection, feature engineering, exploratory analysis | Step 4 |
| Visualisation & BI | One of Tableau / Power BI / Looker Studio; dashboard design; data storytelling | Step 5 |
| Domain & Soft | Business acumen, A/B testing, KPI design, stakeholder communication | Steps 5–6 |
| Growth (Senior) | Big-data exposure (Spark), cloud SQL (BigQuery/Redshift), AI-assisted analytics (Copilot, ChatGPT) | Career Path |
Data Analytics Tools: What to Learn and When
To capture the full scope of modern analytics, here is a prioritized learning order for 2026:
- Start with the Core: Excel + SQL. These two handle 80% of entry-level data work.
- Add Programming: Python (Pandas) for automation and complex data wrangling.
- Master BI Tools: Pick one of Power BI or Tableau to build interactive dashboards. Add Looker Studio for free, quick reporting.
- Embrace AI-Assisted Analytics: Learn how to use tools like Copilot to write complex SQL queries faster and summarize data patterns.
- Go Cloud: Familiarize yourself with cloud data warehouses like Google BigQuery or Snowflake as your datasets scale.
Projects, Portfolio & Practice
The best way to grow credibility is to build a good portfolio. Here is a library of projects to build your resume, from beginner to advanced.
| Project | Tools | Dataset Source | Difficulty | What It Demonstrates |
| Sales Performance Dashboard | Excel / Power BI | Kaggle retail sales | Beginner | KPI design, dashboard basics |
| SQL E-commerce Analysis | SQL / BigQuery | Public e-commerce dataset | Beginner–Int | Joins, aggregation, business querying |
| Customer Churn Analysis | Python (Pandas) | Telco churn (Kaggle) | Intermediate | EDA, segmentation, insight communication |
| A/B Test Report | Python / statistics | Experiment dataset | Intermediate | Hypothesis testing, statistical reasoning |
| Marketing Funnel Dashboard | Tableau | GA4 export / sample funnel | Intermediate | Storytelling, conversion analysis |
| Financial KPI Tracker | Power BI / SQL | Public financial data | Intermediate | Domain analytics, time-series KPIs |
| End-to-End Capstone | SQL + Python + BI | Real or Kaggle dataset | Advanced | Full workflow: extract → clean → analyse → present |
Tip: Host your projects on GitHub and write a README.md that explains the business question, your methodology, and the final insight. A portfolio site or LinkedIn posts clearly validate your skills to employers.
Is Data Analyst a Good Career in 2026? (ROI & Outlook)
Demand Outlook: The role is evolving, not disappearing. In India, demand is growing across finance, healthcare, e-commerce, and government sectors. As businesses shift to cloud-first operations, the need for analysts who can interpret streaming dashboards and edge analytics is surging.
Salary Potential: Salaries are competitive. Entry-level roles typically start at ₹5–7 LPA, while senior analysts with cloud and BI specializations can earn ₹15–20+ LPA within 3–5 years.
The AI Impact: Will AI replace data analysts? No. AI-assisted analytics speeds up querying and charting, but it doesn’t replace the analyst’s core value — framing the right business question, interpreting results in context, and communicating insights to stakeholders. Analysts who use AI tools well are actually more in demand, not less.
Data Analyst vs Data Scientist vs Data Engineer
Understanding the difference helps you self-qualify into the right path. While data scientists build predictive models and work on advanced machine learning, and data engineers focus on managing pipelines and infrastructure, data analysts focus on descriptive and diagnostic insights that guide business decisions day-to-day.
| Dimension | Data Analyst | Data Scientist | Data Engineer |
| Core focus | Descriptive & diagnostic insights, reporting | Predictive models, ML, experimentation | Data pipelines, warehousing, infrastructure |
| Key tools | Excel, SQL, Power BI/Tableau, Python basics | Python/R (advanced), ML libraries, stats | SQL, Spark, Airflow, dbt, cloud warehouses |
| Coding depth | Moderate | Heavy | Heavy |
| Maths/stats depth | Moderate | High | Low–Moderate |
| Typical salary India | ₹5–18 LPA | ₹7–30 LPA | ₹8–25 LPA |
| This roadmap prepares you for | Yes — directly | Partly (add ML later) | No (see Data Engineer roadmap) |
Source : Glassdoor, Ambitionbox .
Data Analyst Certifications Worth Getting (2026)
Validating your skills with certifications is crucial, especially when switching careers. These are the most valued in the current market:
| Certification | Provider | Level | Approx. Cost | Best For |
| Google Data Analytics Certificate | Coursera / Google | Beginner | ~₹3,000/mo | Entry-level roles, foundational skills |
| Microsoft Certified: Power BI Data Analyst (PL-300) | Microsoft | Intermediate | ~₹14,000 | Enterprise BI reporting roles |
| Tableau Desktop Specialist | Salesforce / Tableau | Intermediate | ~₹25,000 | Visual analytics and storytelling |
| IBM Data Analyst Professional Certificate | Coursera / IBM | Beginner | ~₹3,000/mo | Python & SQL fundamentals |
| Scaler Data Analytics Program | Scaler / IIT-R | Professional | ₹2–3 Lakhs | Mentorship, capstone projects & placement |
Data Analyst Interview Questions (Topic-Wise)
Preparing for interviews? Here are the most common data analyst interview questions categorized by skill area.
SQL & Database
- What is the difference between WHERE and HAVING? WHERE filters rows before aggregation, while HAVING filters groups after aggregation.
- Explain the different types of Joins. Inner, Left, Right, and Full Outer joins, used to combine rows from multiple tables.
- What are Window Functions? Functions like RANK(), LEAD(), and LAG() that perform calculations across a set of rows related to the current row.
- How do you optimize a slow SQL query? Use EXPLAIN to analyze the execution plan, add indexes on filtered columns, avoid SELECT *, and replace subqueries with CTEs or Joins where possible.
- What is a Primary Key vs a Foreign Key? A Primary Key uniquely identifies a record. A Foreign Key links to the Primary Key in another table to establish a relationship.
Excel & Data Cleaning
- How do you handle missing values in a dataset? Imputation (mean/median/mode), deletion, or flagging them as a separate category depending on the impact on analysis.
- What is VLOOKUP vs XLOOKUP? XLOOKUP is the modern, more flexible successor to VLOOKUP, allowing searches in any direction and handling missing values better.
- How do you identify outliers in Excel? Use Boxplots, Z-scores, or the IQR method (Interquartile Range) to spot data points that deviate significantly from the rest.
- What is Pivot Tables? A tool that summarizes large datasets by grouping and aggregating data based on specific categories.
Statistics & Analysis
- What is the difference between correlation and causation? Correlation means variables move together; causation means one variable actually affects the other. Correlation does not imply causation.
- Explain the p-value. It measures the strength of evidence against the null hypothesis; a p-value < 0.05 typically indicates statistical significance.
- What is A/B Testing? Comparing two versions of a webpage/app to determine which performs better based on a specific metric (e.g., click-through rate).
- Describe the Central Limit Theorem. It states that the sampling distribution of the sample mean approaches a normal distribution as the sample size gets larger, regardless of the population’s distribution.
- What is the difference between Type I and Type II errors? Type I is a false positive (rejecting a true null hypothesis). Type II is a false negative (failing to reject a false null hypothesis).
Visualisation & BI
- When would you use Tableau vs Power BI? Power BI is better for organizations deeply integrated into the Microsoft ecosystem; Tableau is often preferred for complex, customizable visual analytics and large datasets.
- How do you design an effective dashboard? Focus on the user’s key questions first, use clear charts (avoiding 3D/pie charts for complex data), minimize clutter, and ensure mobile responsiveness.
- What is a KPI and how do you choose one? Key Performance Indicator. Choose KPIs that directly align with business goals and are measurable over time.
- How do you handle large datasets in a BI tool? Aggregate data at the source (SQL/Python), use data modeling (star schema), or extract only necessary columns.
Case/Scenario
- How would you analyze a sudden drop in sales? Isolate the variable (time, region, product). Check data integrity first. Look for external factors (holidays, competitors, technical bugs). Analyze funnel drop-offs.
- What do you do if your data contradicts the stakeholder’s belief? Present the data clearly, explain your methodology, and offer to dig deeper together to find the root cause. Data drives decisions, but diplomacy is key.
Data Analyst Salary in India (2026)
Source: Glassdoor, AmbitionBox, LinkedIn Salary — 2026 estimates. Figures are approximate ranges for product-based companies.
| Experience Level | Role | Salary Range (India) | Top Hiring Cities | Key Notes |
| Entry-Level (0-2 yrs) | Junior Data Analyst | ₹5–9 LPA | Bangalore, Hyderabad, Pune | SQL + Excel basics required |
| Mid-Level (3-5 yrs) | Data Analyst / BI Analyst | ₹9–16 LPA | Bangalore, Mumbai, Hyderabad | Python + Power BI/Tableau required |
| Senior Level (5+ yrs) | Senior Analyst / Lead | ₹16–25+ LPA | Bangalore, Remote | Cloud (BigQuery) + Domain expertise |
City Premium: Salaries in Bangalore and Hyderabad are typically 15–25% higher than the national average due to the concentration of tech MNCs and startups.
Career Path & Job Opportunities
Here are some opportunities that you can look for after learning all the concepts and tools for data analytics:
Entry-Level Titles
- Junior Data Analyst
- Reporting Analyst
- Business Analyst
Focus: Data collection, basic cleaning, and creating simple reports.
Mid-Level to Advanced Roles
- Senior Data Analyst
- BI Analyst
- Analytics Consultant
Focus: Deeper analysis, dashboard ownership, and influencing strategy.
Next Steps: With enough practice, analysts often transition into Data Science (focusing on predictive modeling/ML), Data Engineering (focusing on pipeline infrastructure), or Analytics Management (leading teams and strategy).
Conclusion
Becoming a data analyst is a highly rewarding journey. You will cover various topics from math, stats, and Excel to SQL, Python, visualization, and even practical projects. The data analytics roadmap shows you exactly where to begin and how to progress. The point is to start small, practice consistently, and focus on refining your major skill set.
![[DS] think data science is for you](https://scaler-blog-prod-wp-content.s3.ap-south-1.amazonaws.com/wp-content/uploads/2024/11/19104524/Banner-2-2.jpg)
If you want guided learning, mentorship, and projects that prepare you for jobs, programs like Scaler’s Data Analytics Course can provide helpful resources for your journey. Take the first step toward a data-driven career today!
Read These Important Roadmaps
| Roadmap | Focus | Link |
| Data Science Roadmap | ML, Predictive Modeling | Read More |
| Data Engineer Roadmap | Pipelines, Warehousing | Read More |
| MLOps Roadmap | Deployment, Monitoring | Read More |
| Data Analyst Projects | Portfolio Ideas | Read More |
FAQs
- Can you become a data analyst in 3 months?
You can cover the basics like Excel, SQL, and simple dashboards in three months, but becoming fully job-ready usually takes 6–9 months of consistent practice and building a project portfolio. Employers look for demonstrable skills, not just theoretical knowledge.
- How much SQL is needed for data analysts?
You don’t need to be a database administrator, but you must be comfortable with joins, subqueries, aggregations, and window functions. These cover 80% of real-world analytical tasks. Proficiency in CTEs and query optimization will set you apart in interviews.
- Is data analysis still in demand in 2026 and beyond?
Yes. Businesses continue to rely heavily on analysts to guide decisions. Demand is growing across finance, healthcare, e-commerce, and government roles. While AI automates basic querying, the need for human analysts to interpret context and drive strategy has never been higher.
- Should I learn SQL or Tableau first?
Always start with SQL; it’s the foundational tool for data extraction. Once you can query and manipulate data efficiently, move to Tableau or Power BI for visualization. Visualization is only as good as the data you feed it.
- Can you become a data analyst without a tech degree?
Yes. Many successful analysts come from economics, business, finance, or even humanities backgrounds. What matters most is your technical skill set (SQL, Excel, BI), a strong portfolio of projects, and your ability to communicate business insights.
- Is Python necessary for data analysts?
Not always for entry-level roles, but Python is highly recommended for career growth. It expands your ability to handle complex analysis, automate repetitive tasks, perform web scraping, and eventually transition into machine learning or data science roles.
- What is the difference between a data analyst and a data scientist?
Data analysts focus on descriptive and diagnostic insights—answering “what happened” and “why it happened.” Data scientists build predictive models, run experiments, and use advanced machine learning to answer “what will happen.” Analysts typically use SQL/BI tools; scientists use Python/R/ML algorithms.
- Which certifications are most valued for data analysts in India? The Google Data Analytics Certificate (Coursera), Microsoft PL-300 (Power BI), and Tableau Desktop Specialist are the most recognized. Certifications support a portfolio but don’t replace it — practical projects and demonstrable skills matter most to employers.