


ABC Inventory Analysis using Excel (Example)
Overview
ABC analysis formula is one of the most popular methods for comprehending and classifying inventories. Consider yourself managing inventories at a facility that produces luxury, extremely expensive autos. There are many pieces (4,693) needed to put each car together. Some components cost thousands of dollars each, while others are inexpensive (50 cents per part). How can you then ensure that your inventory tracking efforts are streamlined so that you spend more time on expensive items and less on parts that cost 50 cents each? ABC analysis example is useful in this situation.
What are we building?
One of the few useful inventory management methods that assists companies in deciding which products are worth keeping in stock is done by using ABC analysis formula. Also, any CV for a warehouse manager should list this competency. Understanding your sales trends and the particular product value of each item is possible using ABC analysis formula and ABC analysis example. It is used in all industries and doesn't need much extra work. Also, it identifies locations where excessive resources are being used to produce substandard items.
Using the ABC inventory analysis method of product classification, you can group your products according to their worth and significance. The Pareto principle, which claims that just 20% of inventory accounts for 80% of inventory cost, is used in this process.
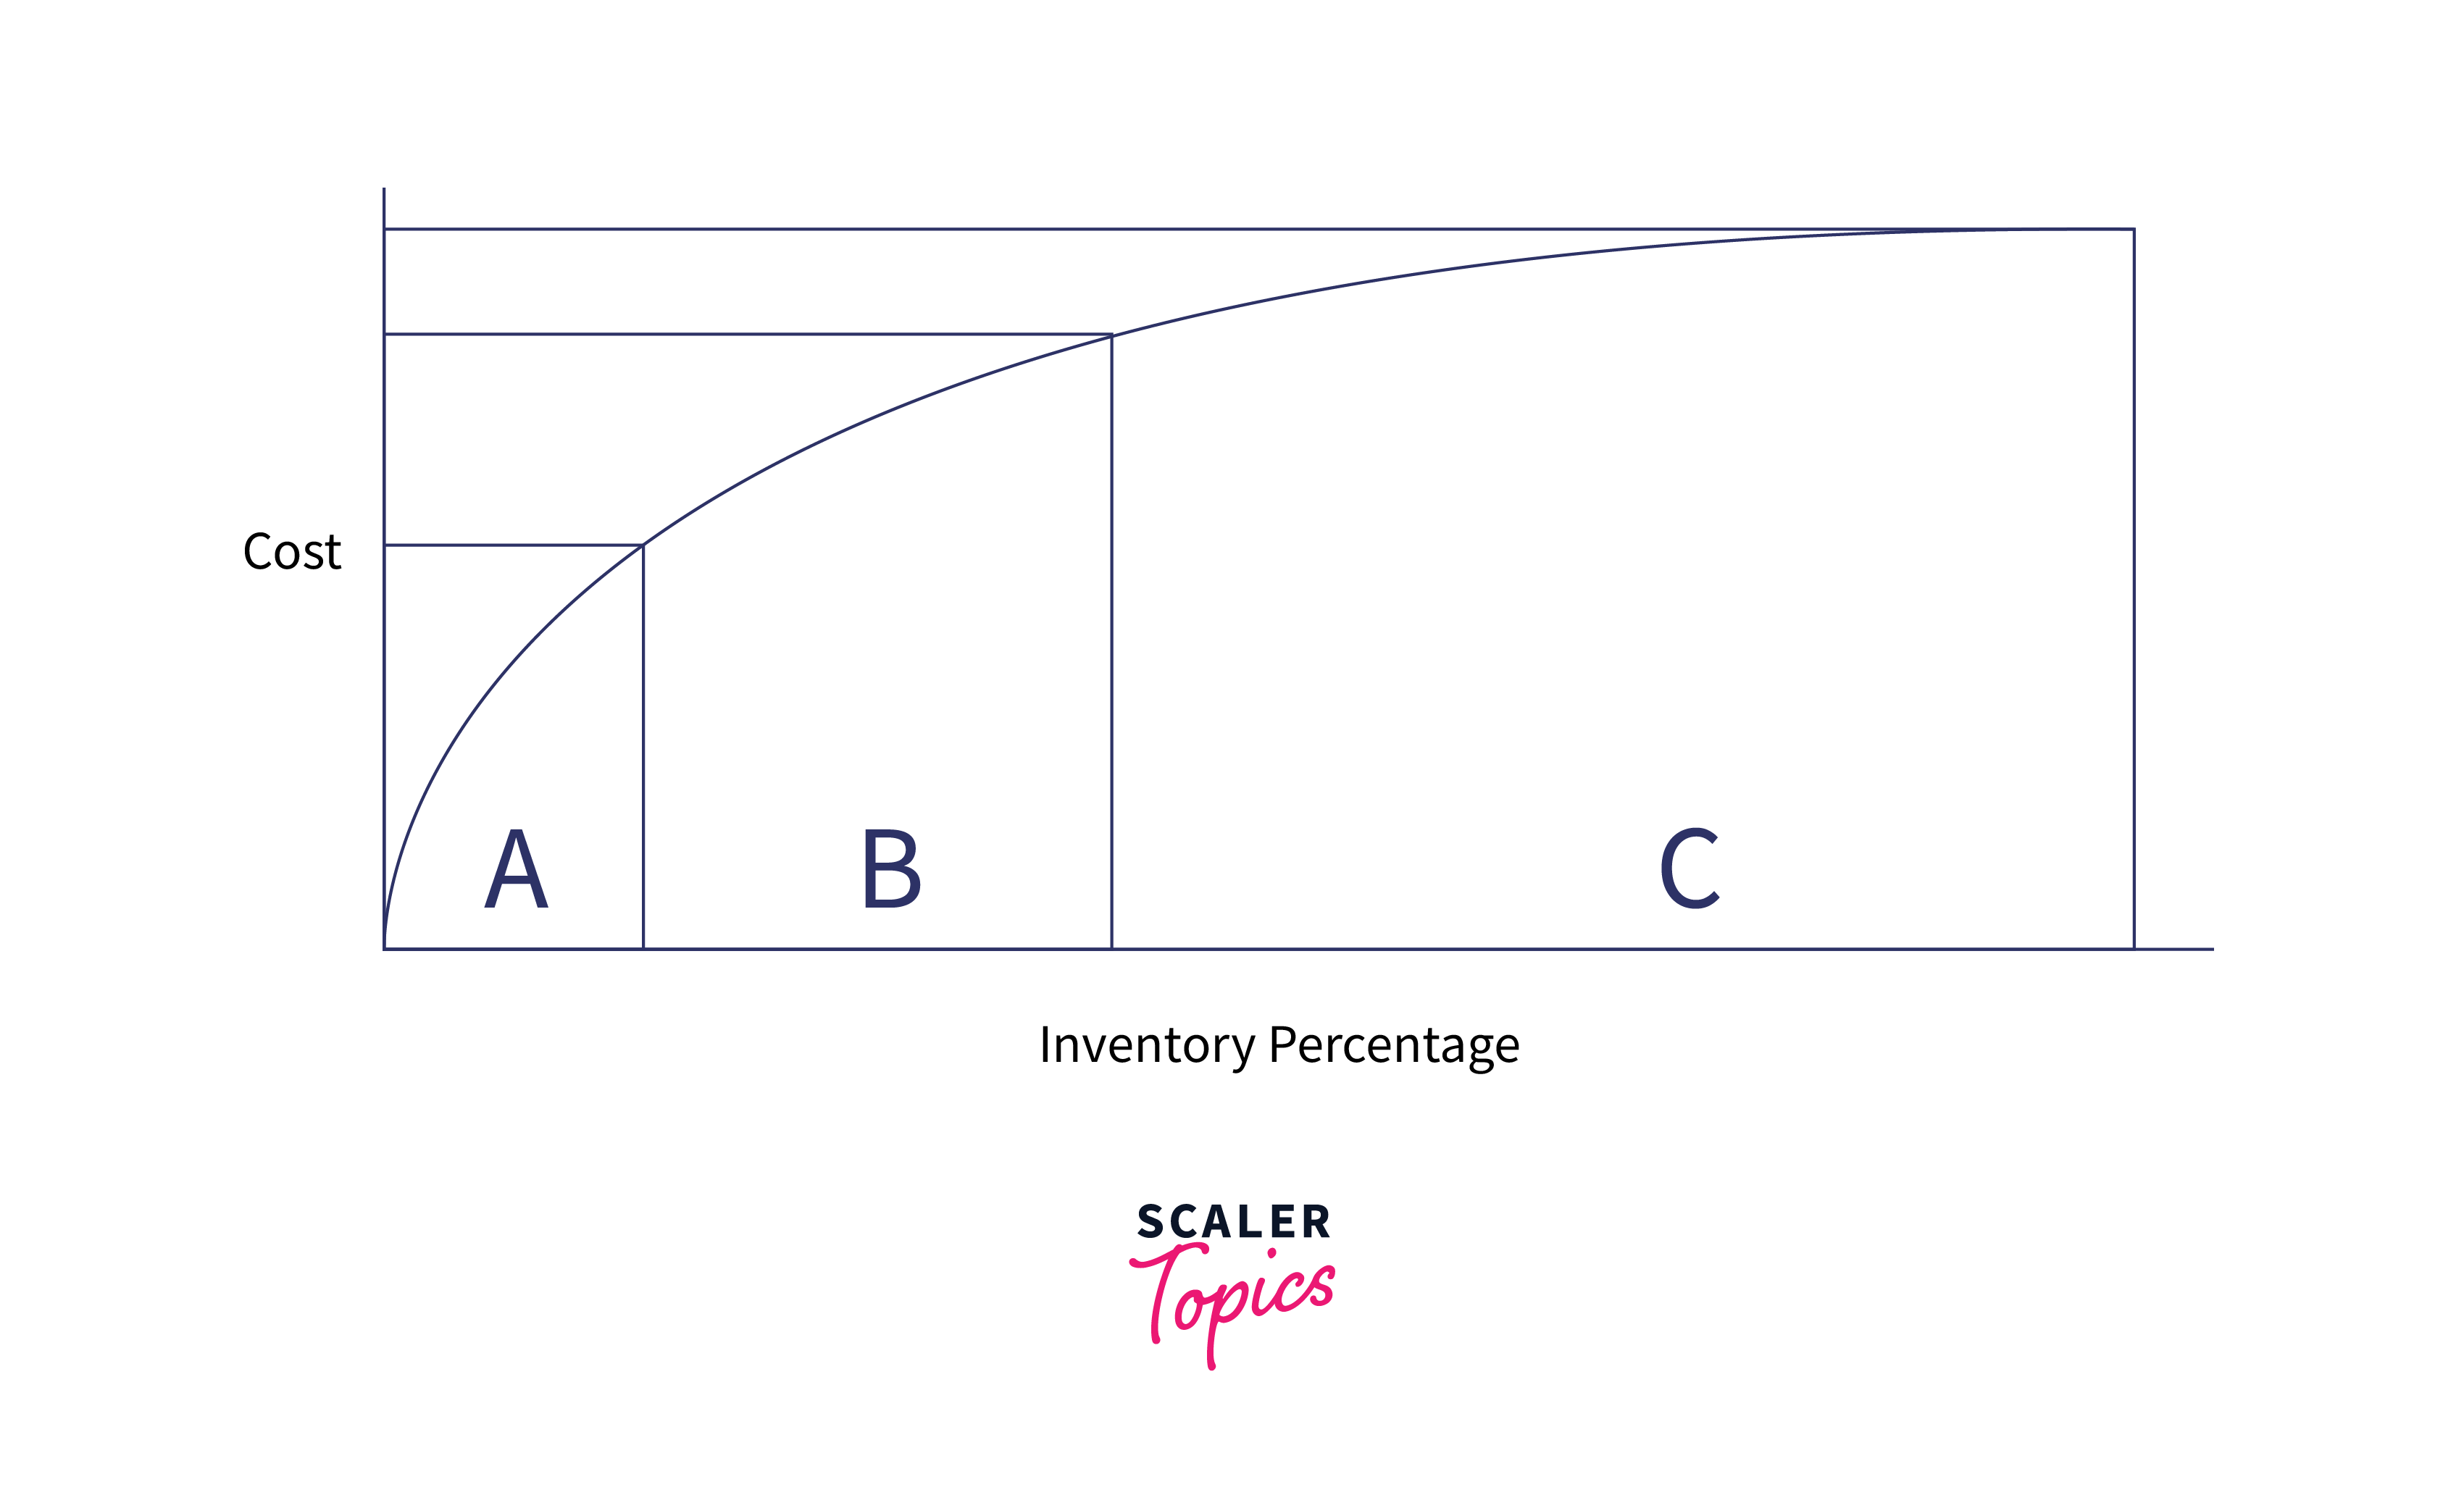
In order for management to focus on inventory items with high inventory costs, the primary goal of ABC analysis formula of inventory control is to identify products with high cost of inventory. It offers business owners insight into the worth of their inventory and points out areas where too much or too little time and effort is being spent.
Build an AI-First Career, Master the Complete Skillset
Choose from our industry-leading programs designed for career success
Modern Software and AI Engineering Program
Master full-stack development with AI integration


 +1000 more
Modern Data Science and ML with specialisation in AI
Advanced data science techniques with AI specialization
+1000 moreAdvanced AIML with Specialisation in Agentic AI
Deep dive into AIML with focus on Agentic systems
+1000 moreDevOps, Cloud & AI Platform Engineering
Build and manage AI-powered cloud infrastructure
+1000 moreAI Engineering Advanced Certification by IIT-Roorkee
Premier AI engineering certification from IIT-Roorkee

AI Forward Deployed Engineer Program
Full-stack engineering, production AI and client-facing consulting
+1000 morePre-requisites
- Basics of Excel.
- Data Visualization.
- Operations using Excel
How are we going to build this?
For building the project, we will first group the parts into 3 classes as given below:
- Class A: Expensive products. very precise tracking and control.
- B: Items with a moderate price tag. controlled tightly and tracked moderately.
- Items of Class C are inexpensive. little to no management and tracking.
Final Output
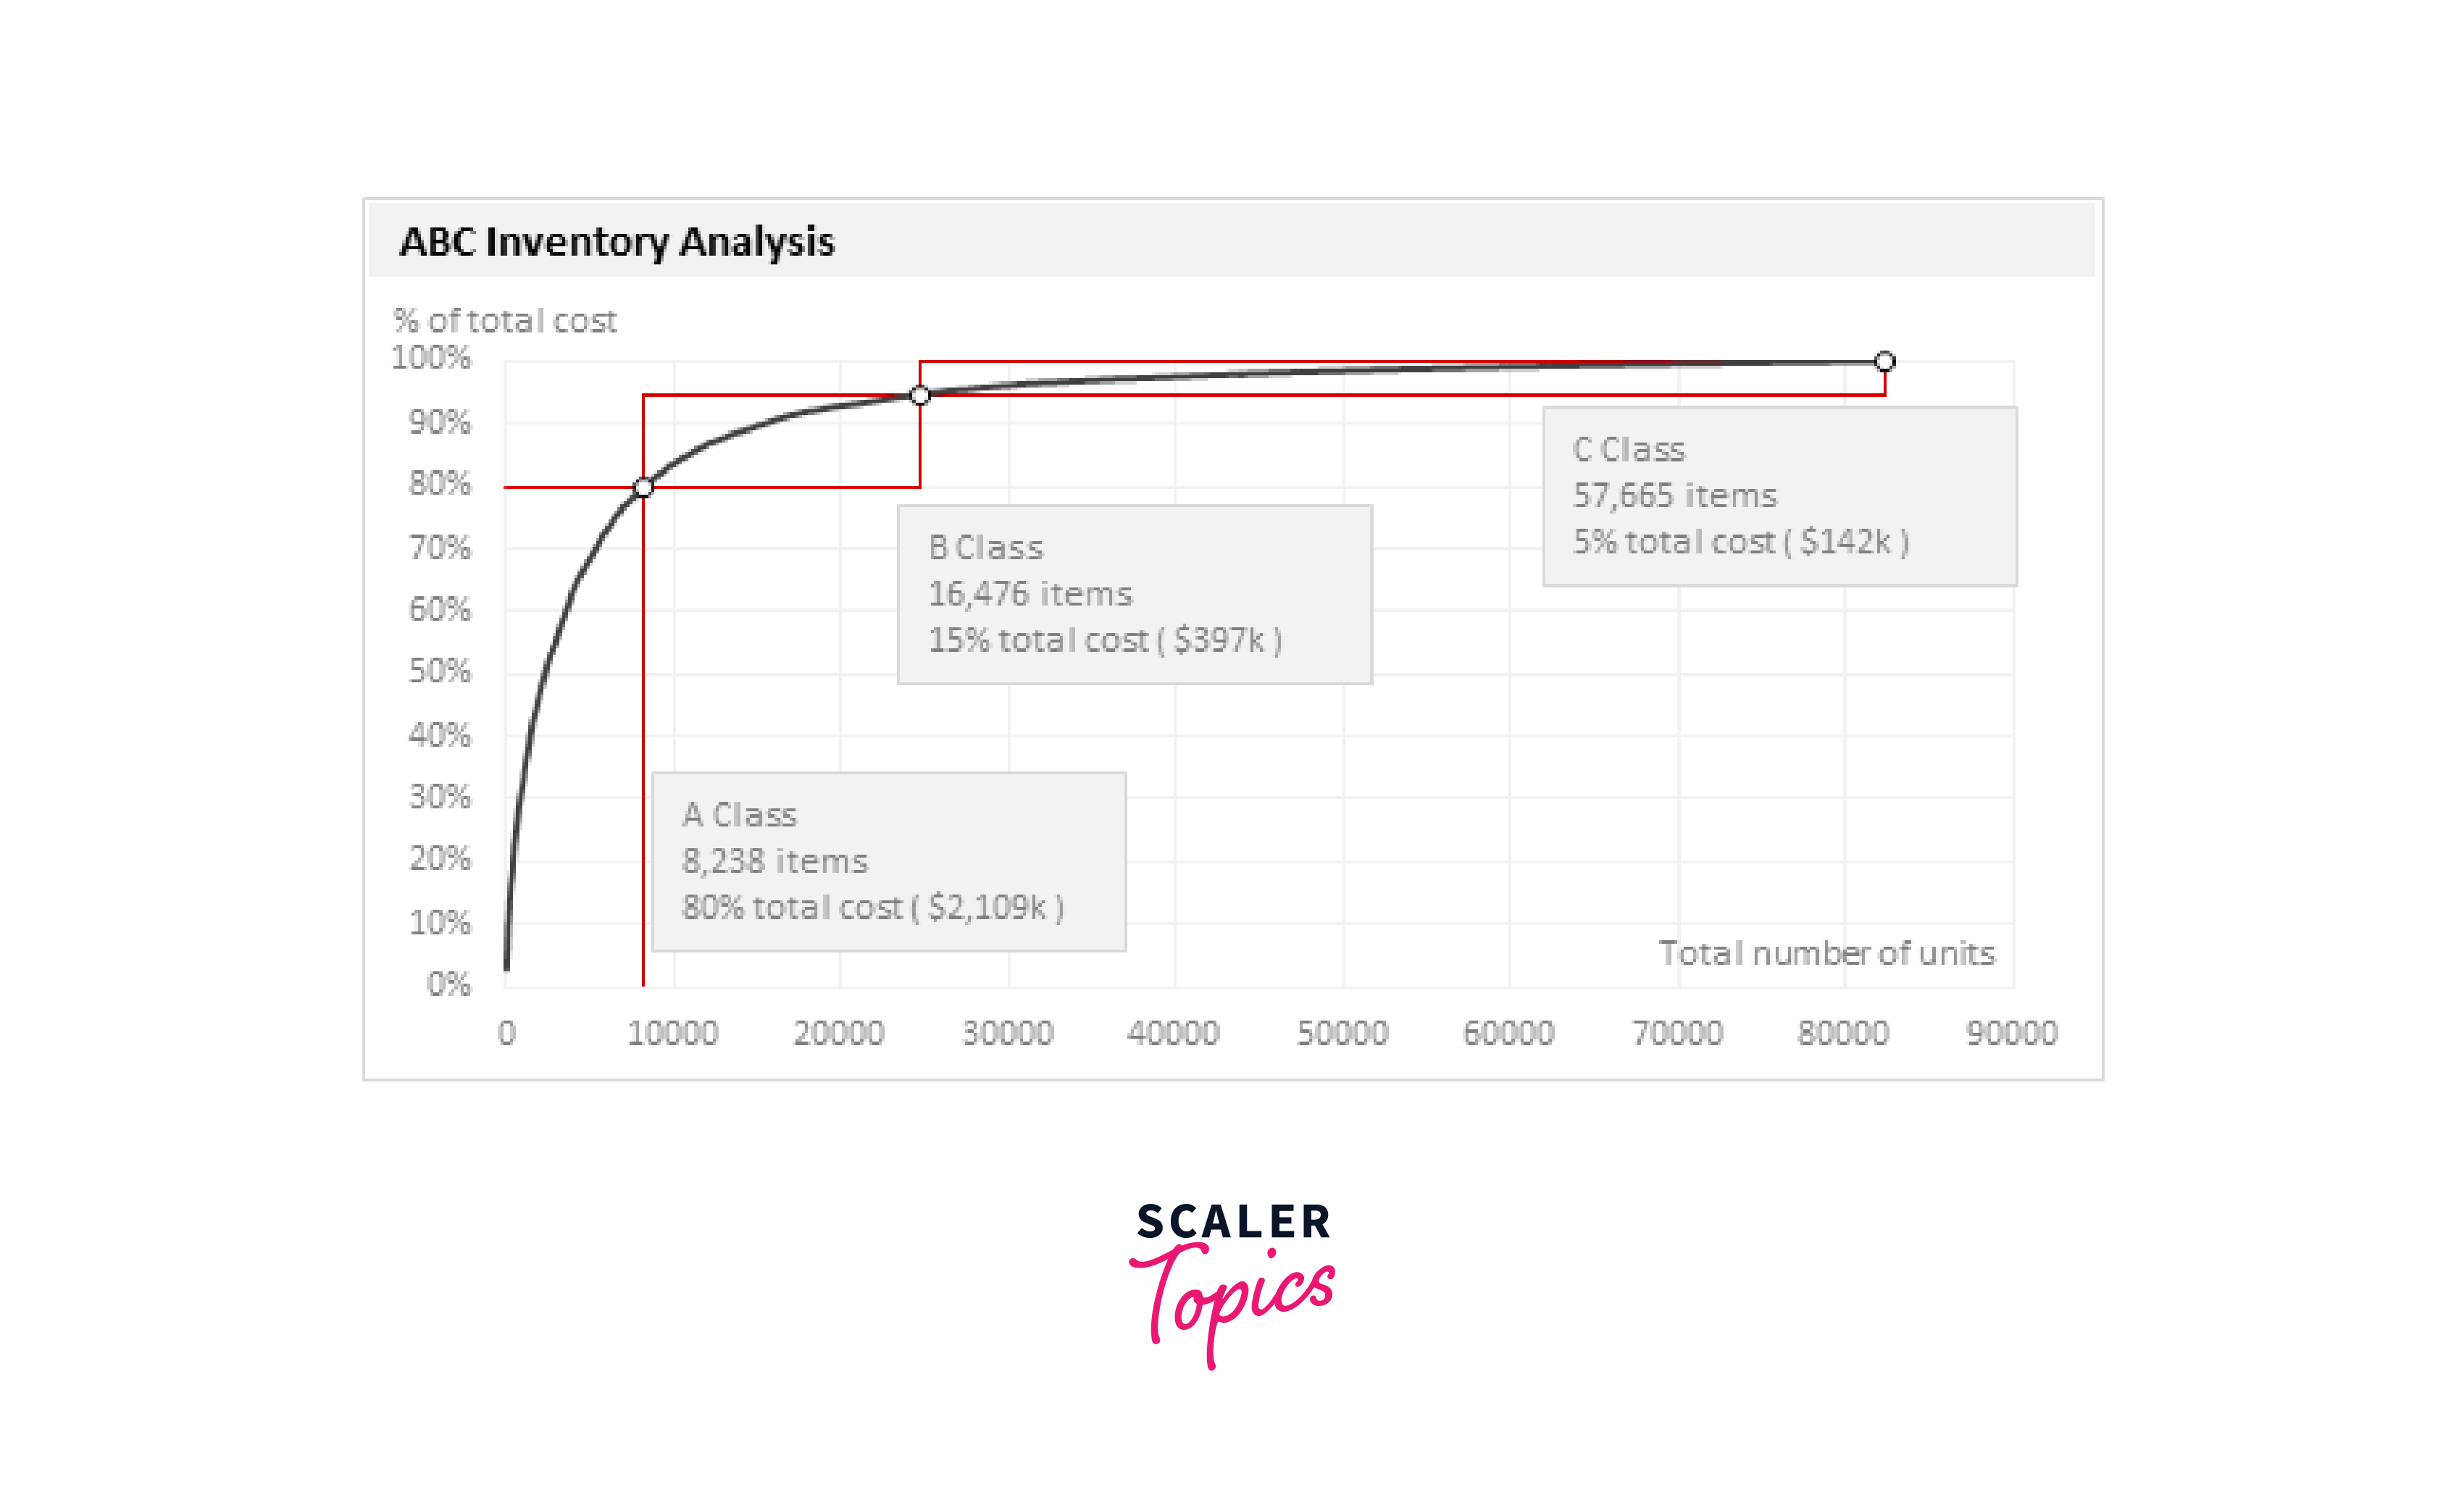
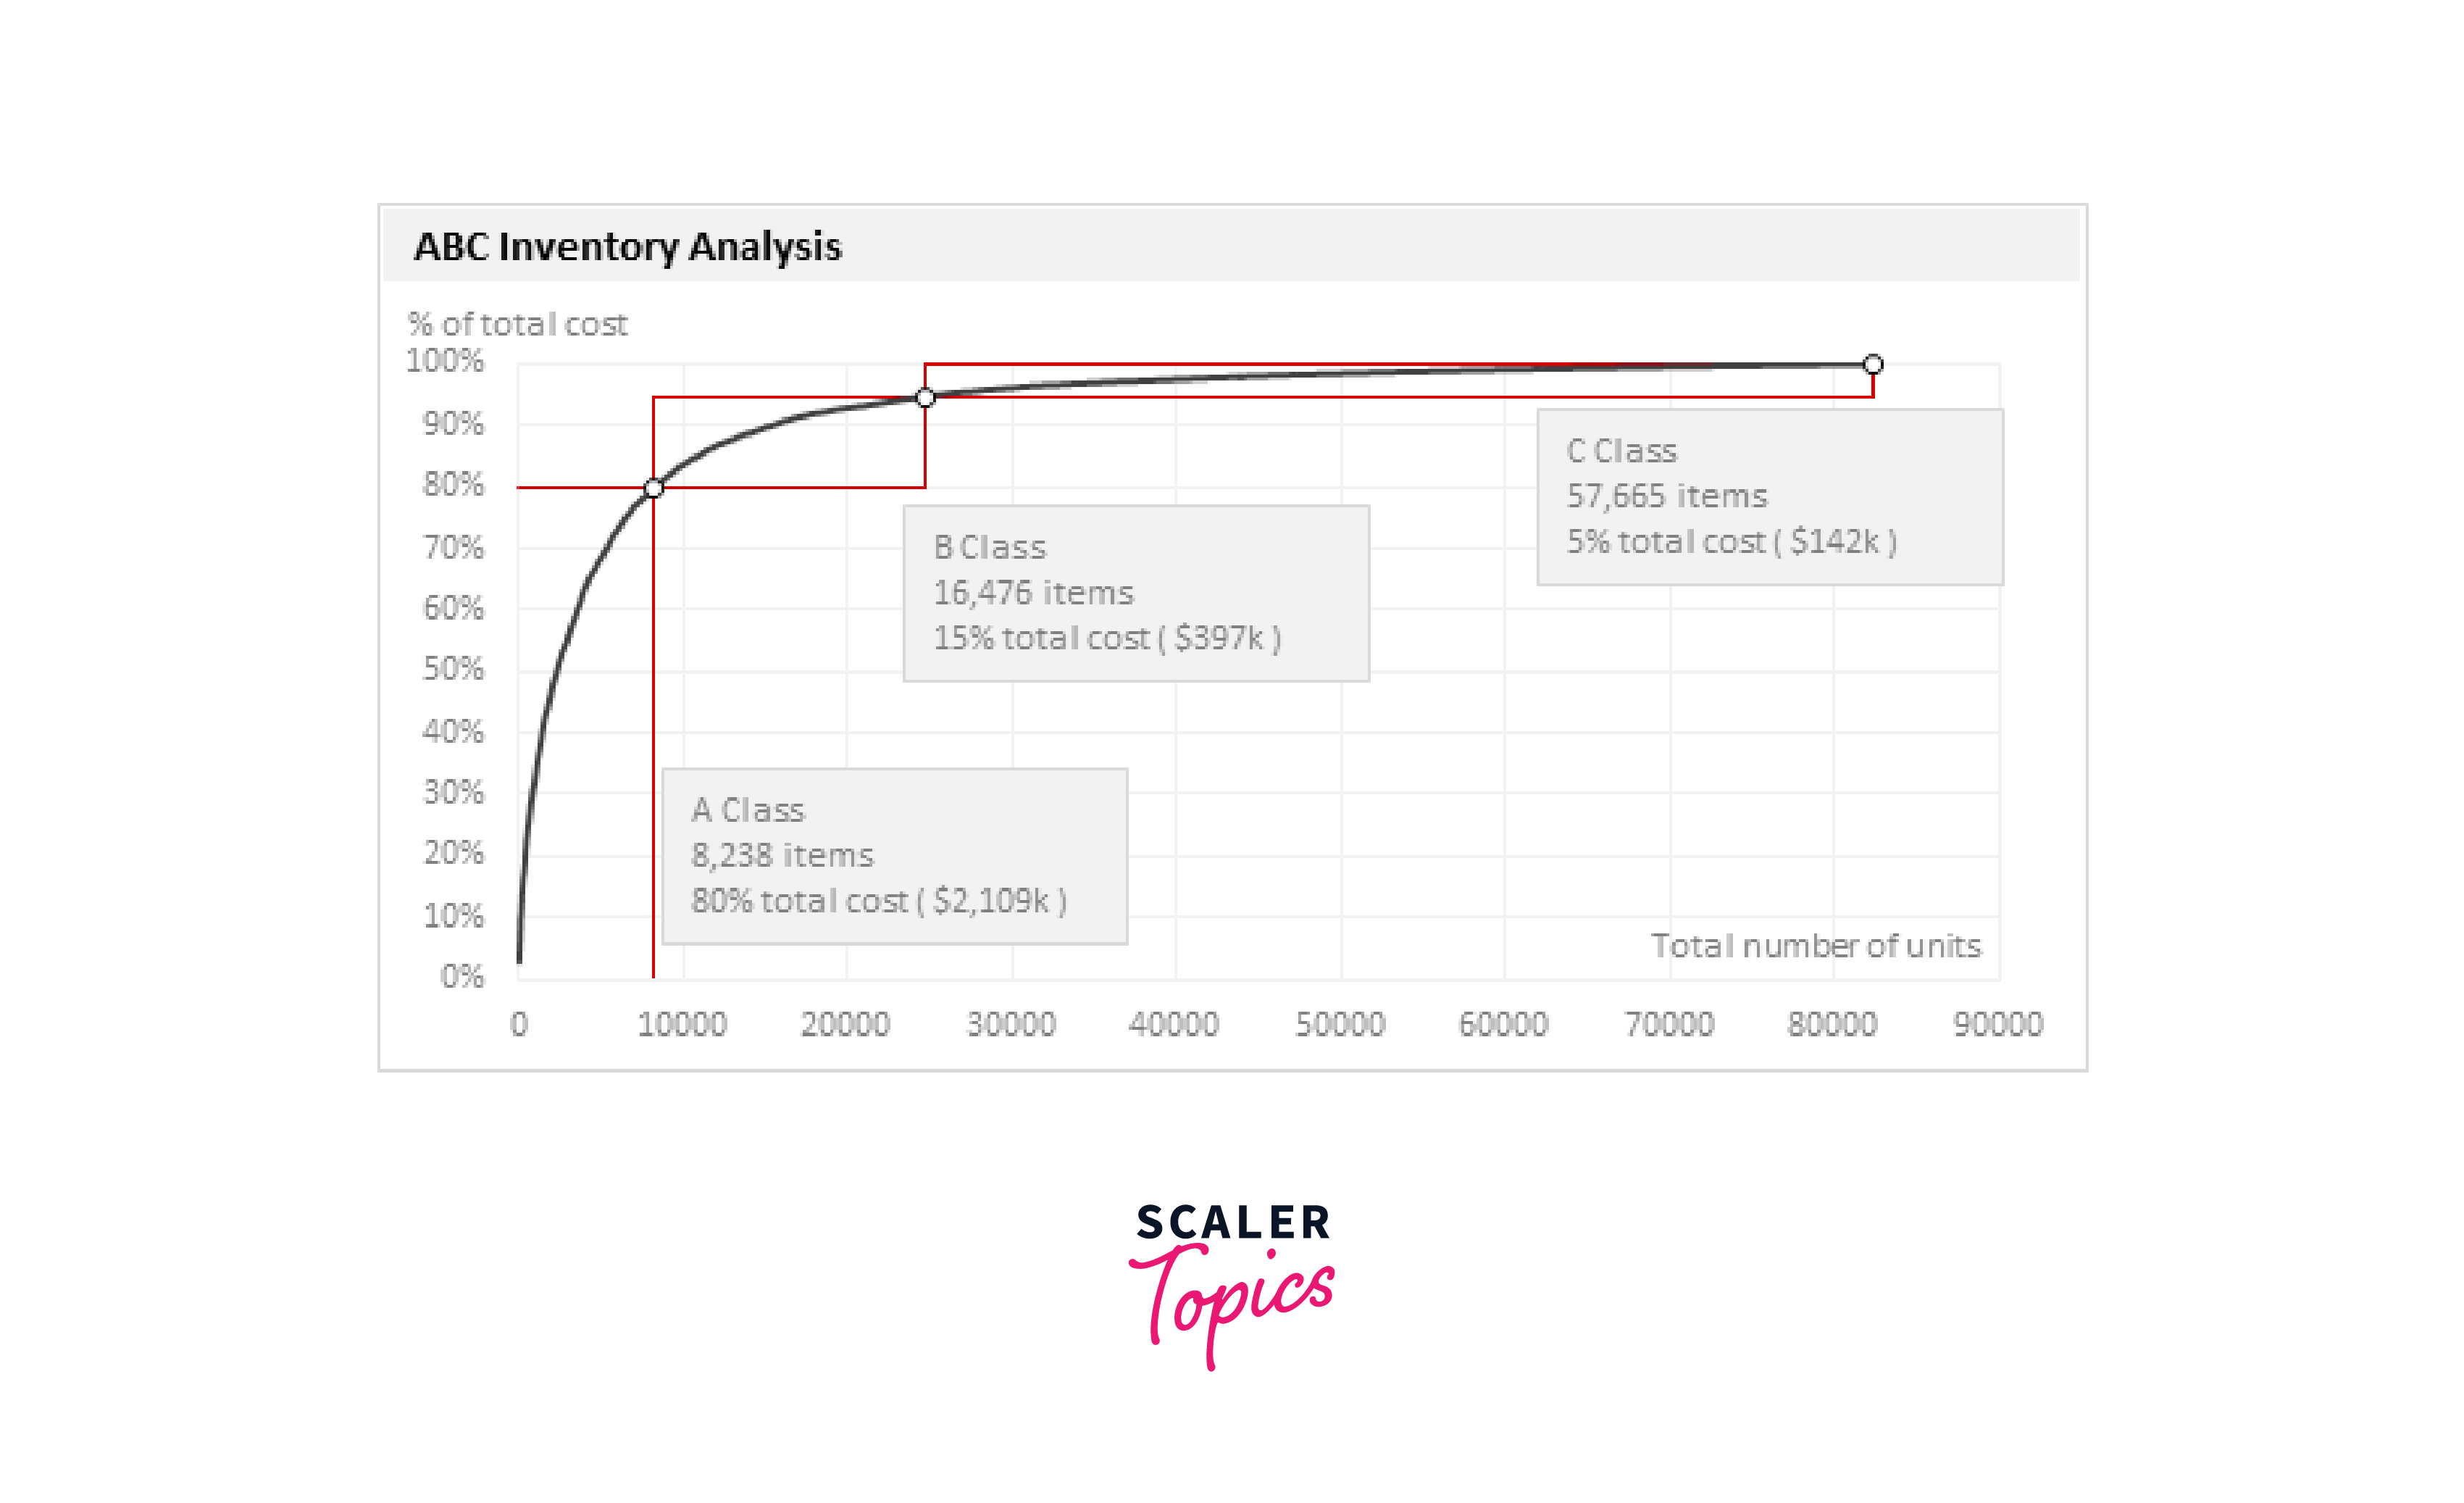
The final output will look something like this:
Requirements
- Data in Excel sheet
Note: before proceeding with the project, make sure you have an excel sheet with all the inventory data or at least the minimum information needed to perform the analysis.
Building the ABC Inventory Analysis in Excel
How Scaler Transformed Careers in Different Fields
Scaler learners achieved 2.5x salary growth with average post-Scaler CTC reaching ₹23L.
 Google
 Amazon
 Microsoft
 Flipkart
 Adobe1200+ more
Arrange the inventory data in Excel
Enter Excel with all the inventory (or parts) data. You should have at least these columns in your data.
- Part Name
- Unit cost
- '#' of units (if this is blank, just type 1 in all rows)
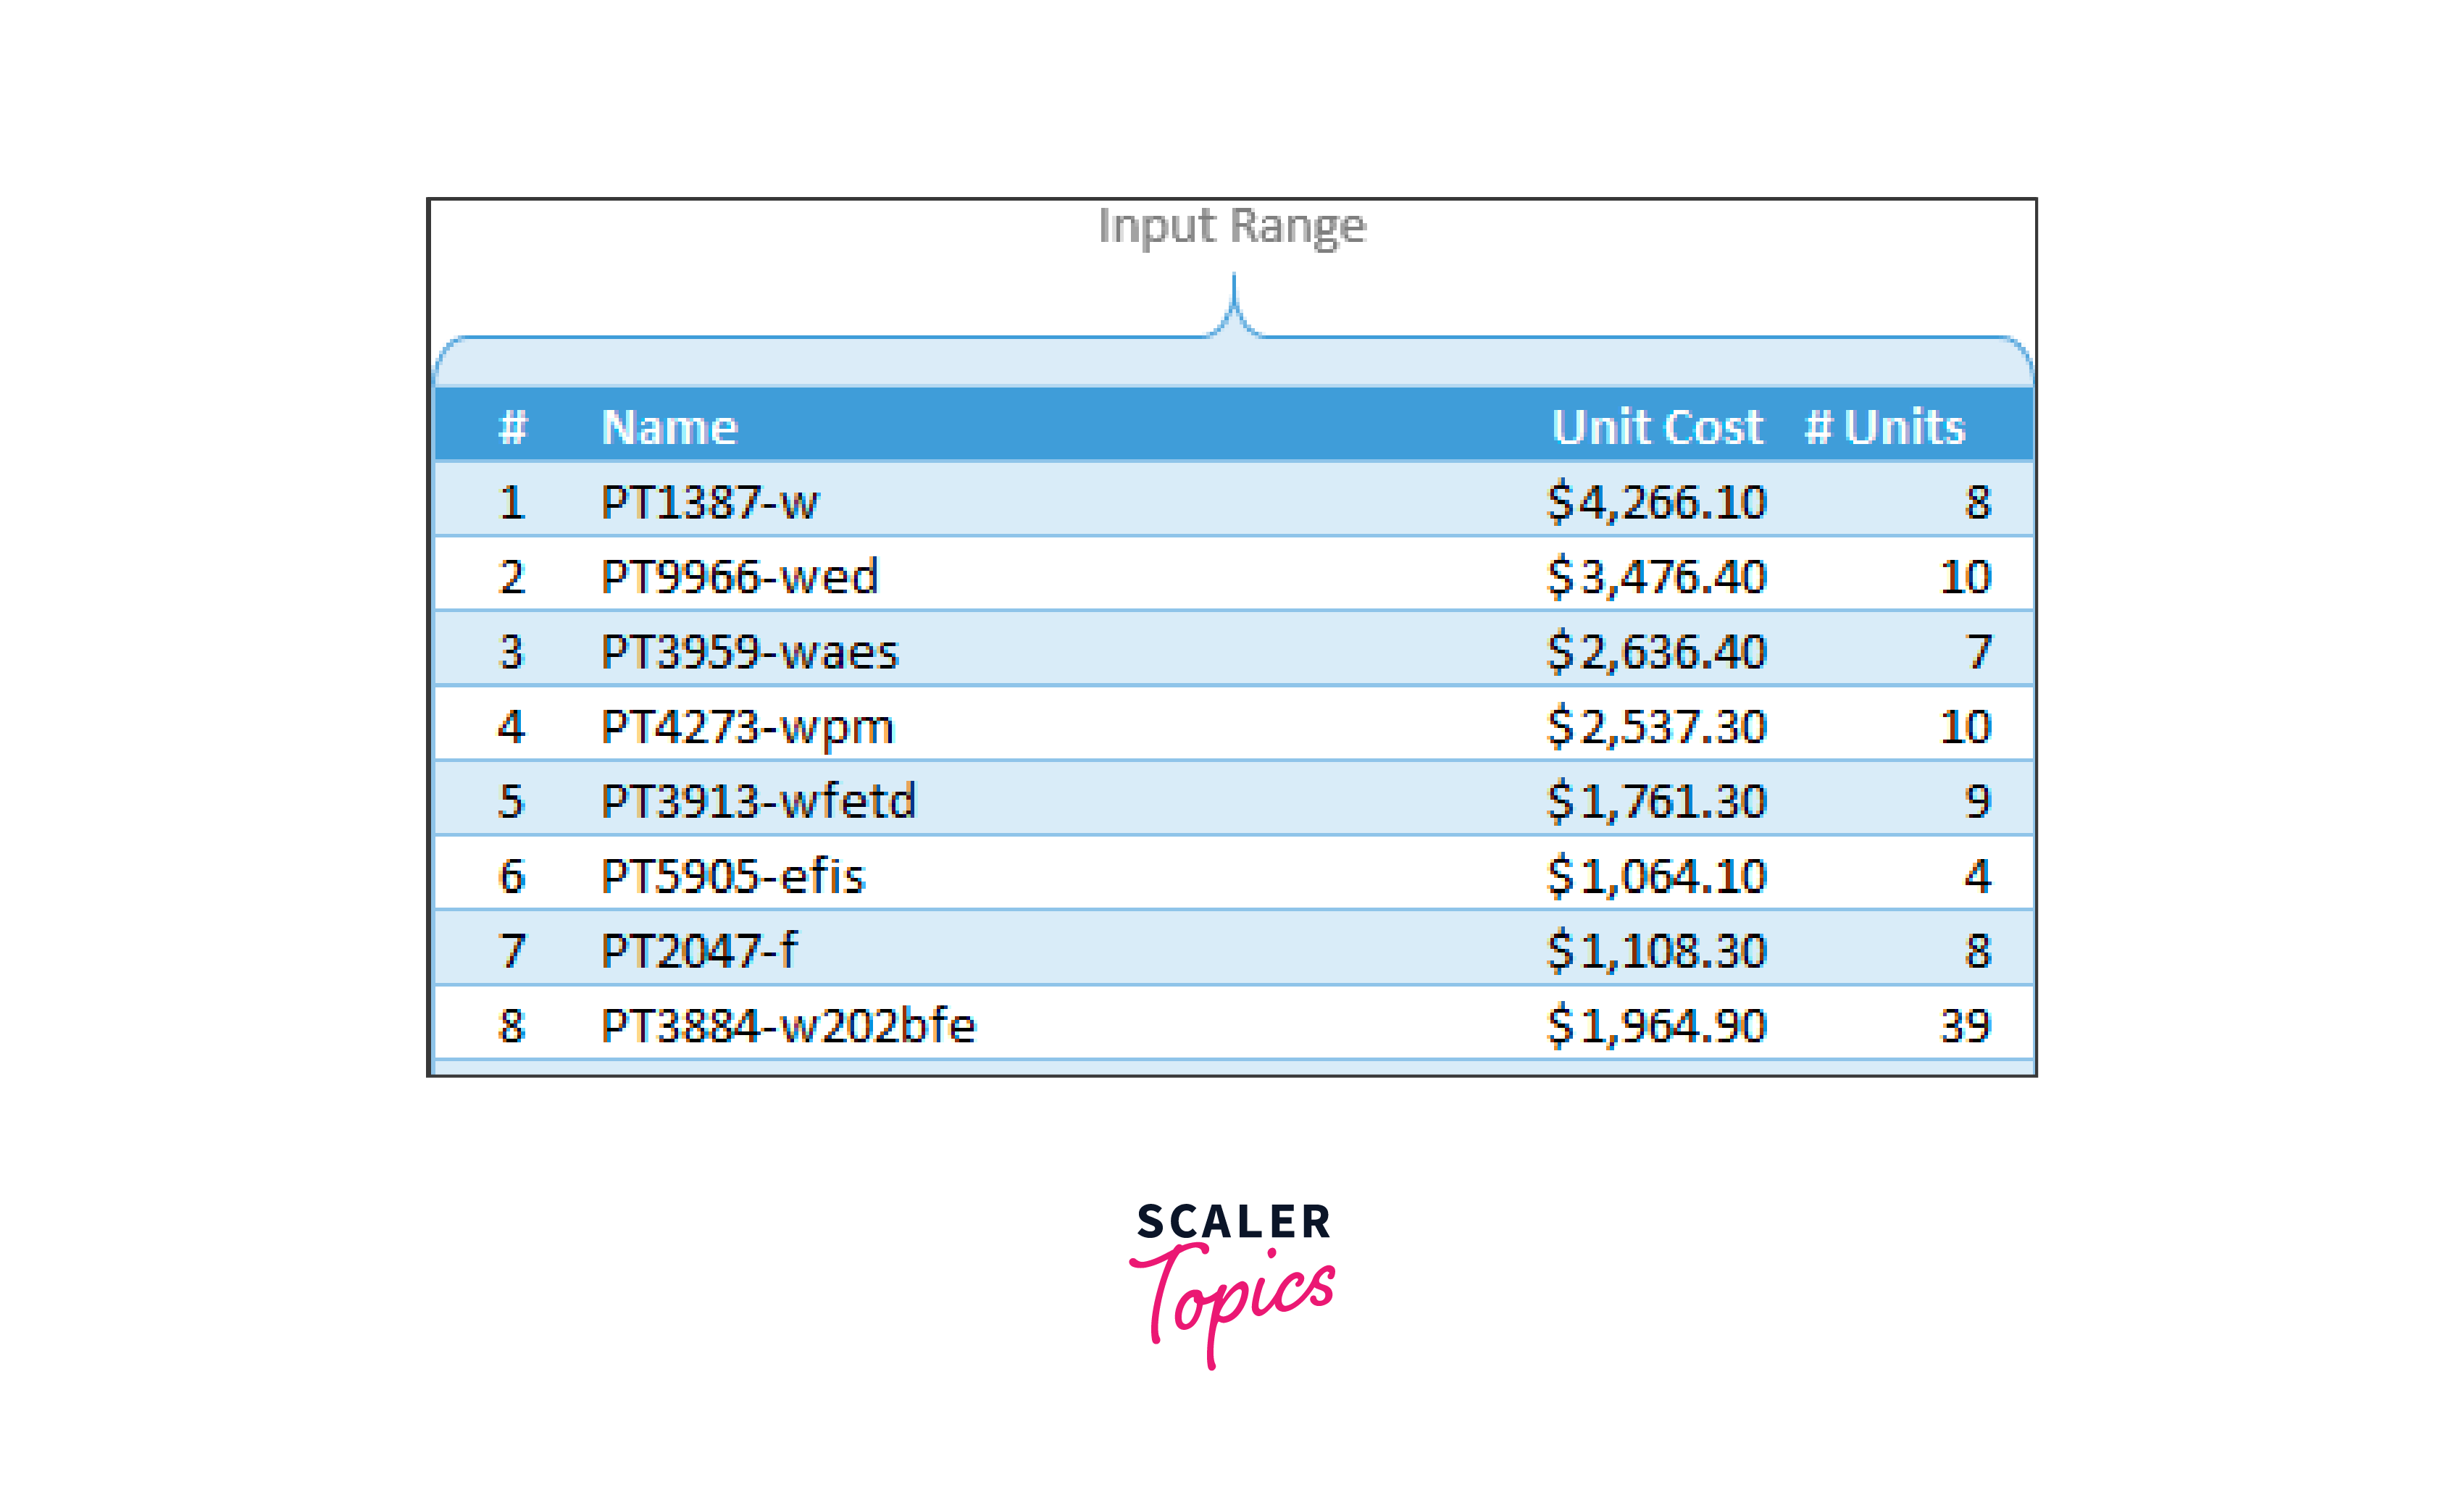
Press CTRL+T to convert the data to a table once it is in Excel. Call our data an inventory for now. On the Design tab, you can change the table name.
Calculate extra columns needed for ABC classification
Now for the exciting part analytically processing the inventory data.
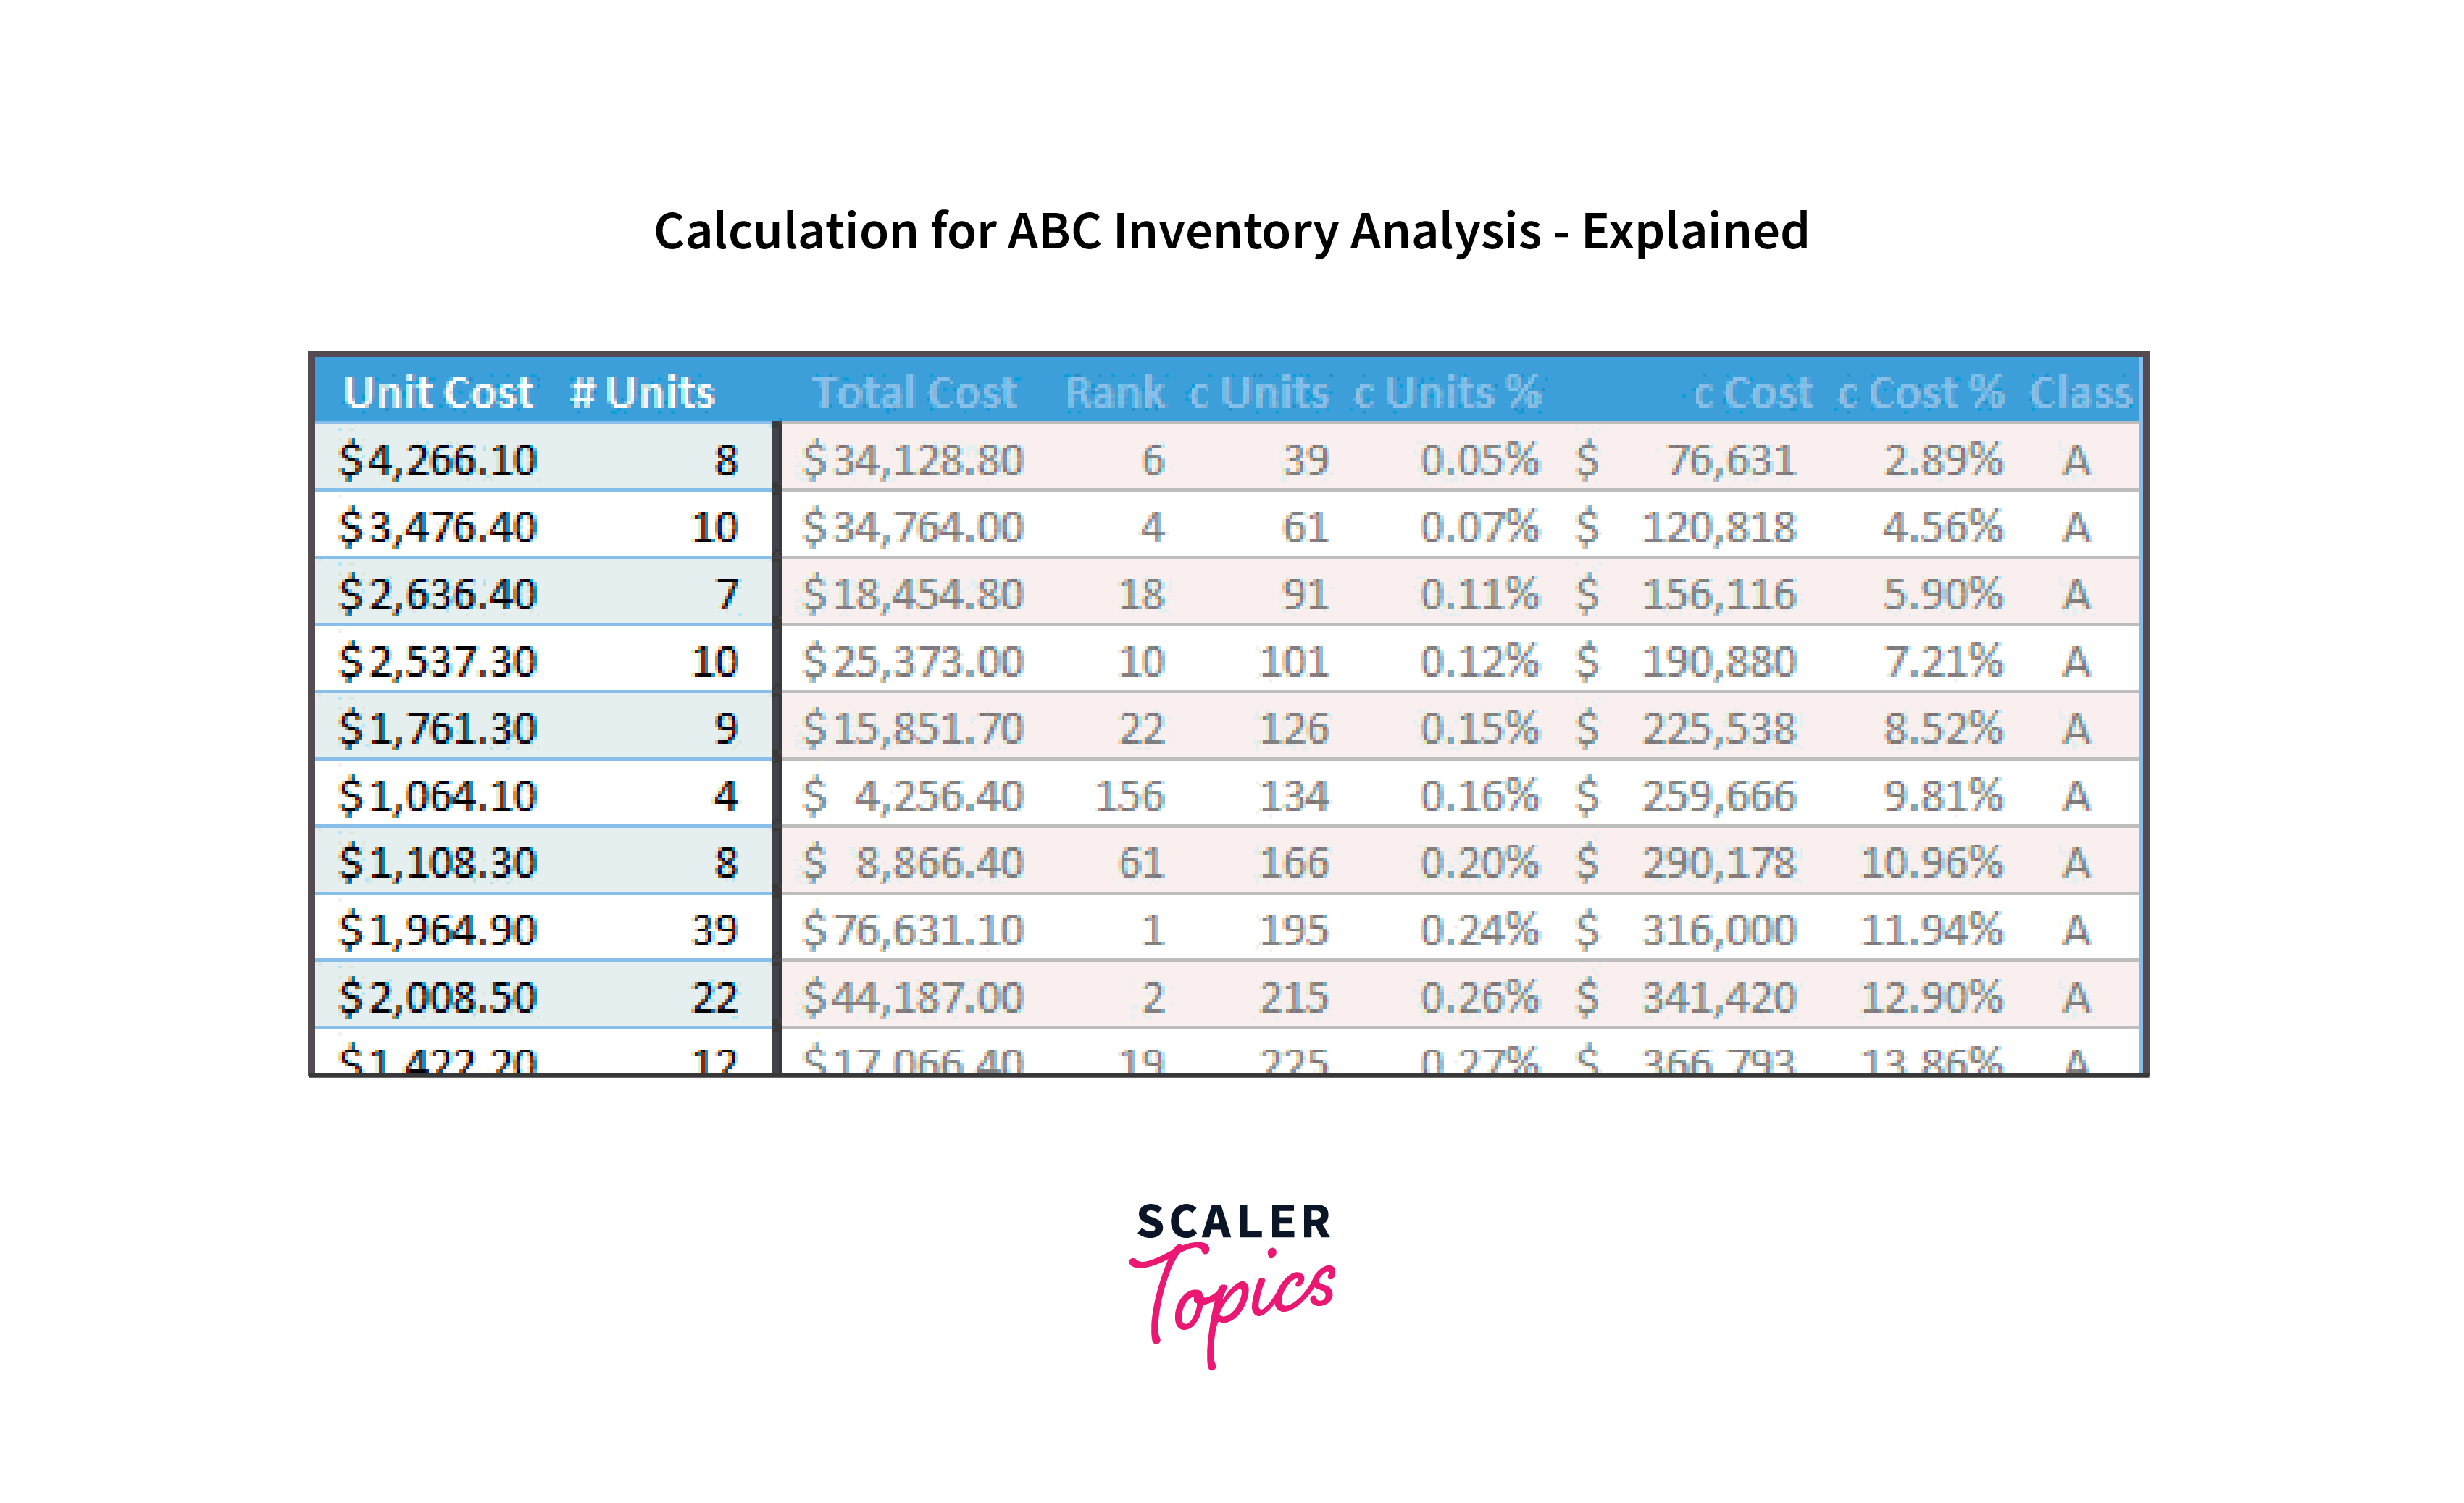
Total Cost: This is simply the sum of the unit cost and the number of units columns.
Rank: We must determine the rank of each total cost (in the total cost column). For this, we can implement the RANK formula. =RANK([@[Total Cost]],[Total Cost],0) will tell us the rank for each total cost. Cumulative Units: After determining the rank of each item, the following step is to determine how many cumulative units are required for items with a lower or equal rank.
For instance, The third section (PT3959-waes) has the number (#) 3. This has 91 units overall. This indicates that the first three ranking parts—parts 8, 9, and 16—have a combined total of 91 units. The formula for this is, =SUMIFS(['# Units],[Rank],"<="&[@['#]]) Recall that running numbers (1,2,3,...4692,4693) are denoted by [@['#]].
Cumulative Units%: This is the proportion of total cumulative units. The equation is as follows: =[@[c Units]]/MAX([c Units])
Cost cumulatively and cost percentage:
These computations are comparable (instead of units, we calculate cost)
See the picture below to see how the numbers are computed.

Create Inventory Distribution Chart
Select cumulative units & cumulative cost % columns and create an XY chart and Ensure that cumulative units are on the X-axis and cumulative cost percentage is on the Y-axis.
We want our curve to match this.
Turn Learning into Career Growth
Set up ABC classification thresholds
Now we have to choose what the cutoff is for classes A, B, and C.
Class A typically comprises the top 10% of the items in most circumstances.
20% of Class B would follow.
The final 70% would be in Class C.
However, these figures may vary based on your sector and the industrial environment.
Let's imagine that a user defined the class thresholds in our spreadsheet somewhat along the lines of the following:
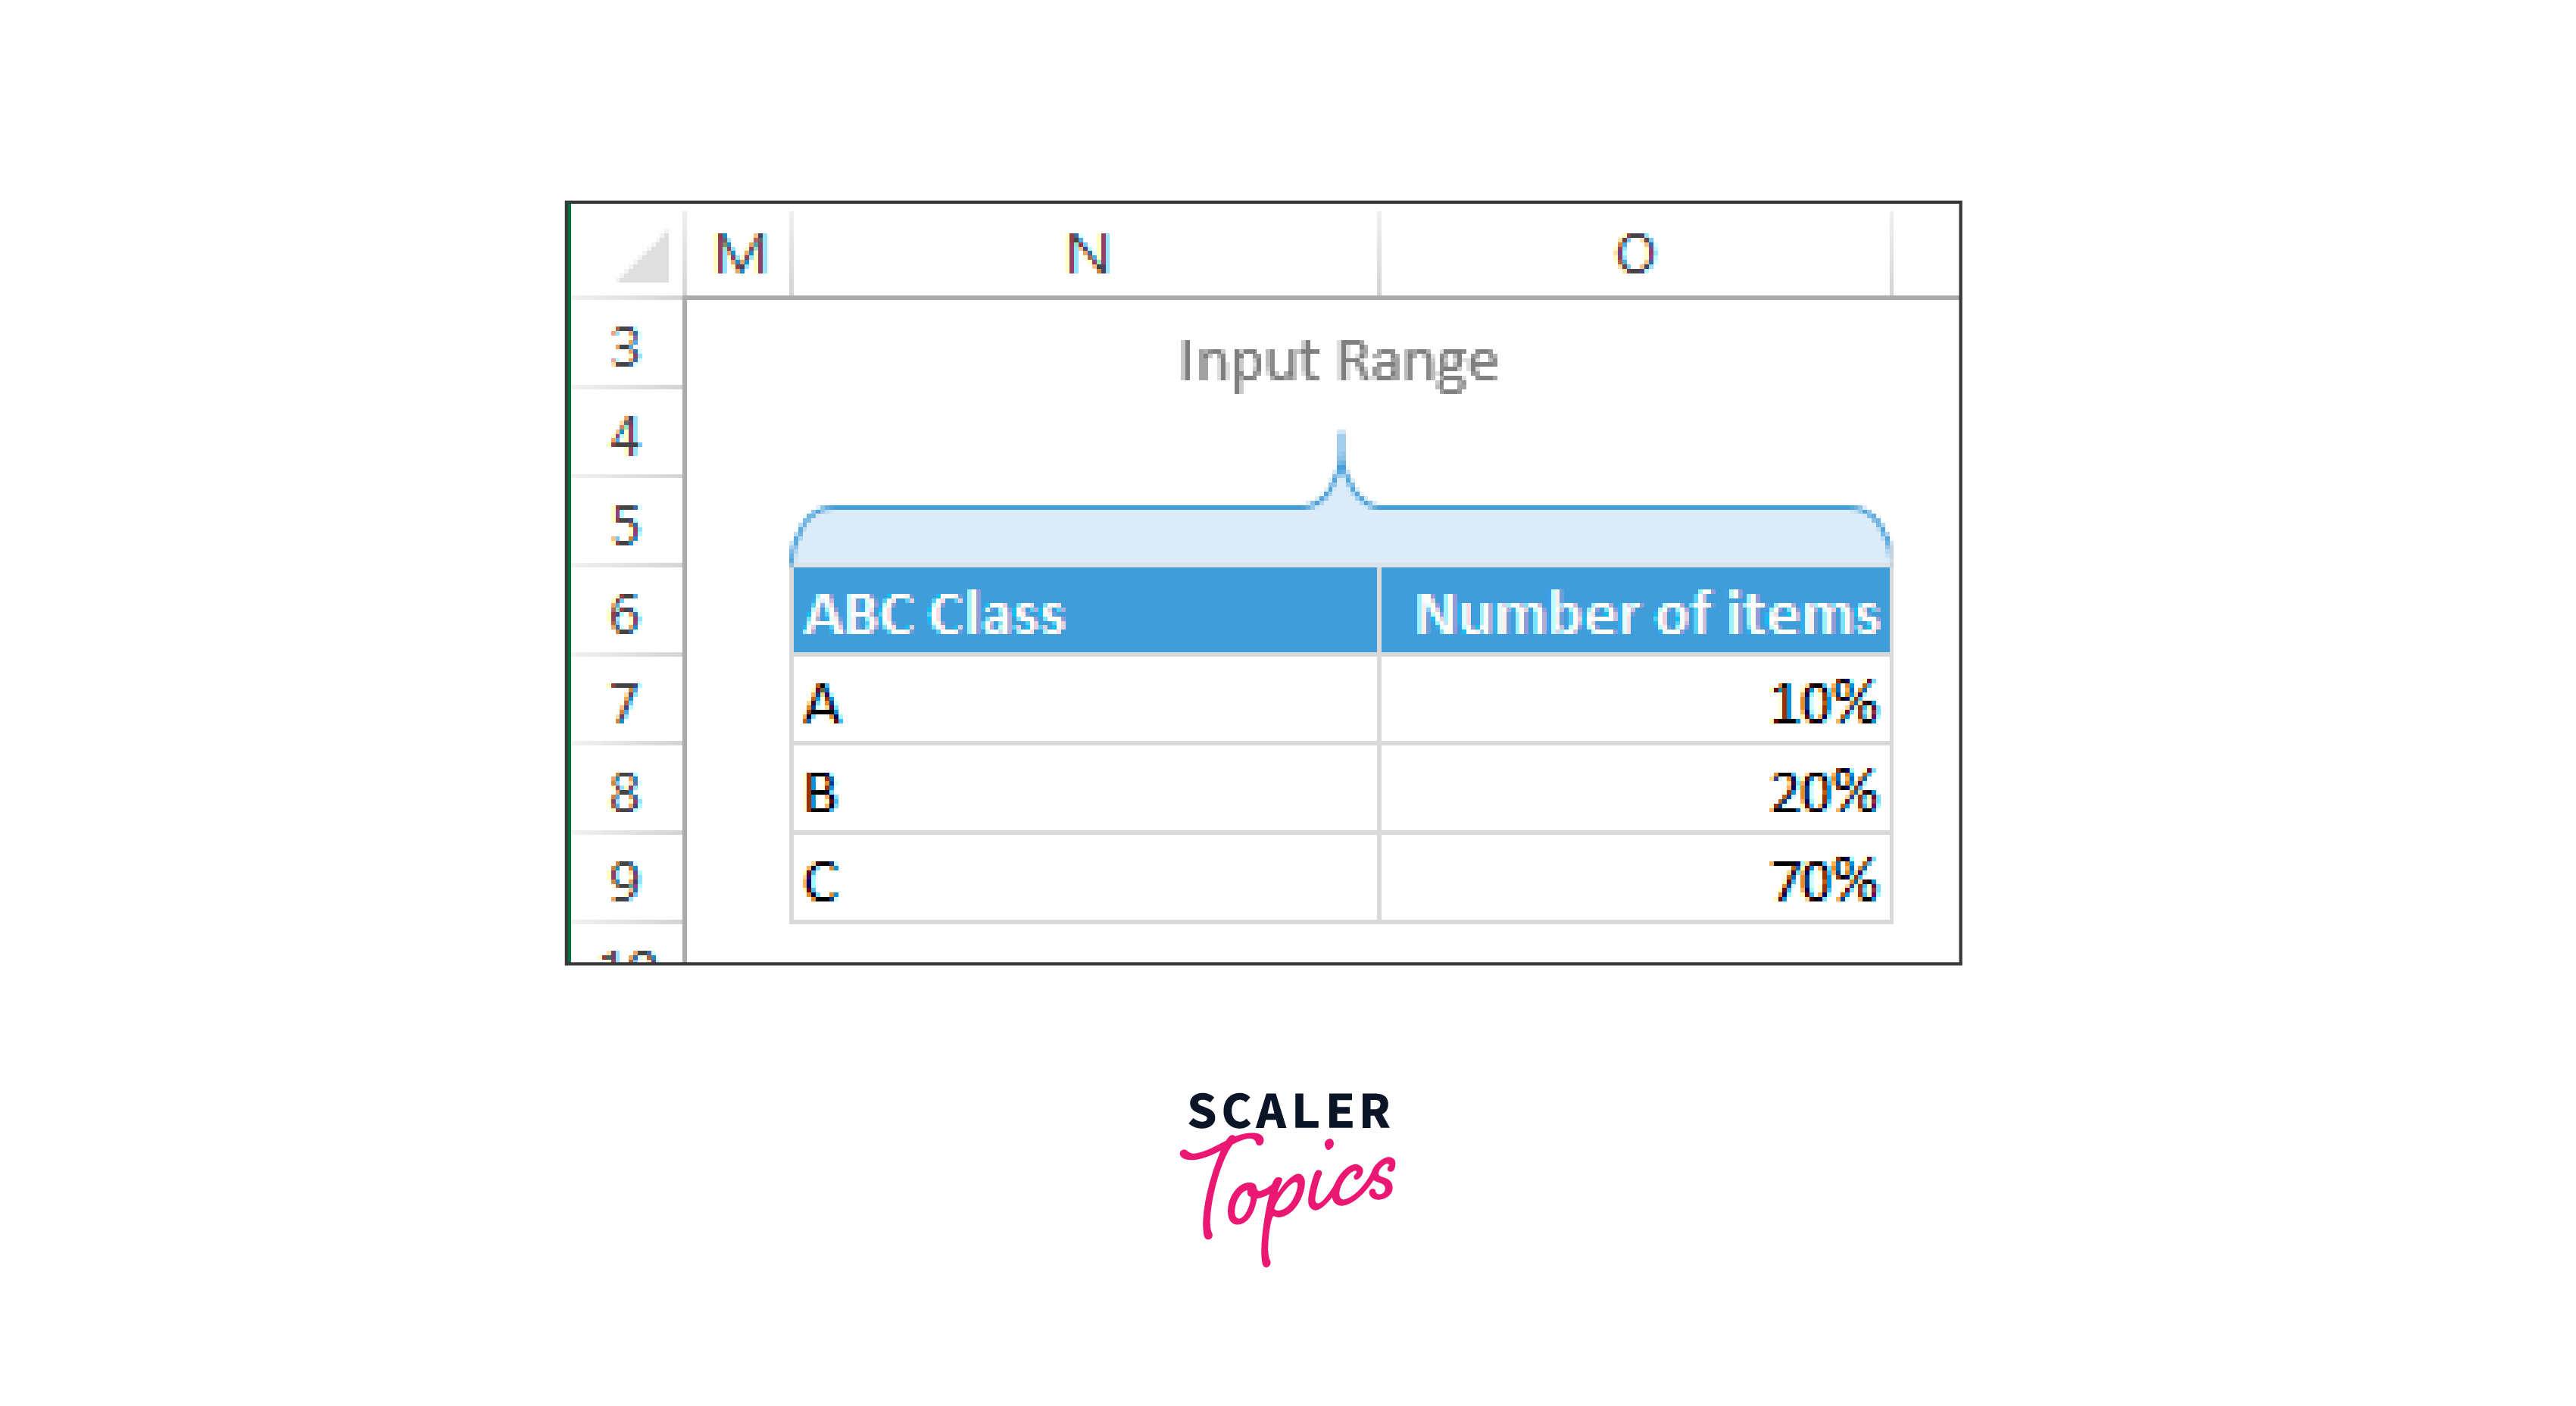
Thus, the thresholds included is as follows 7:9.
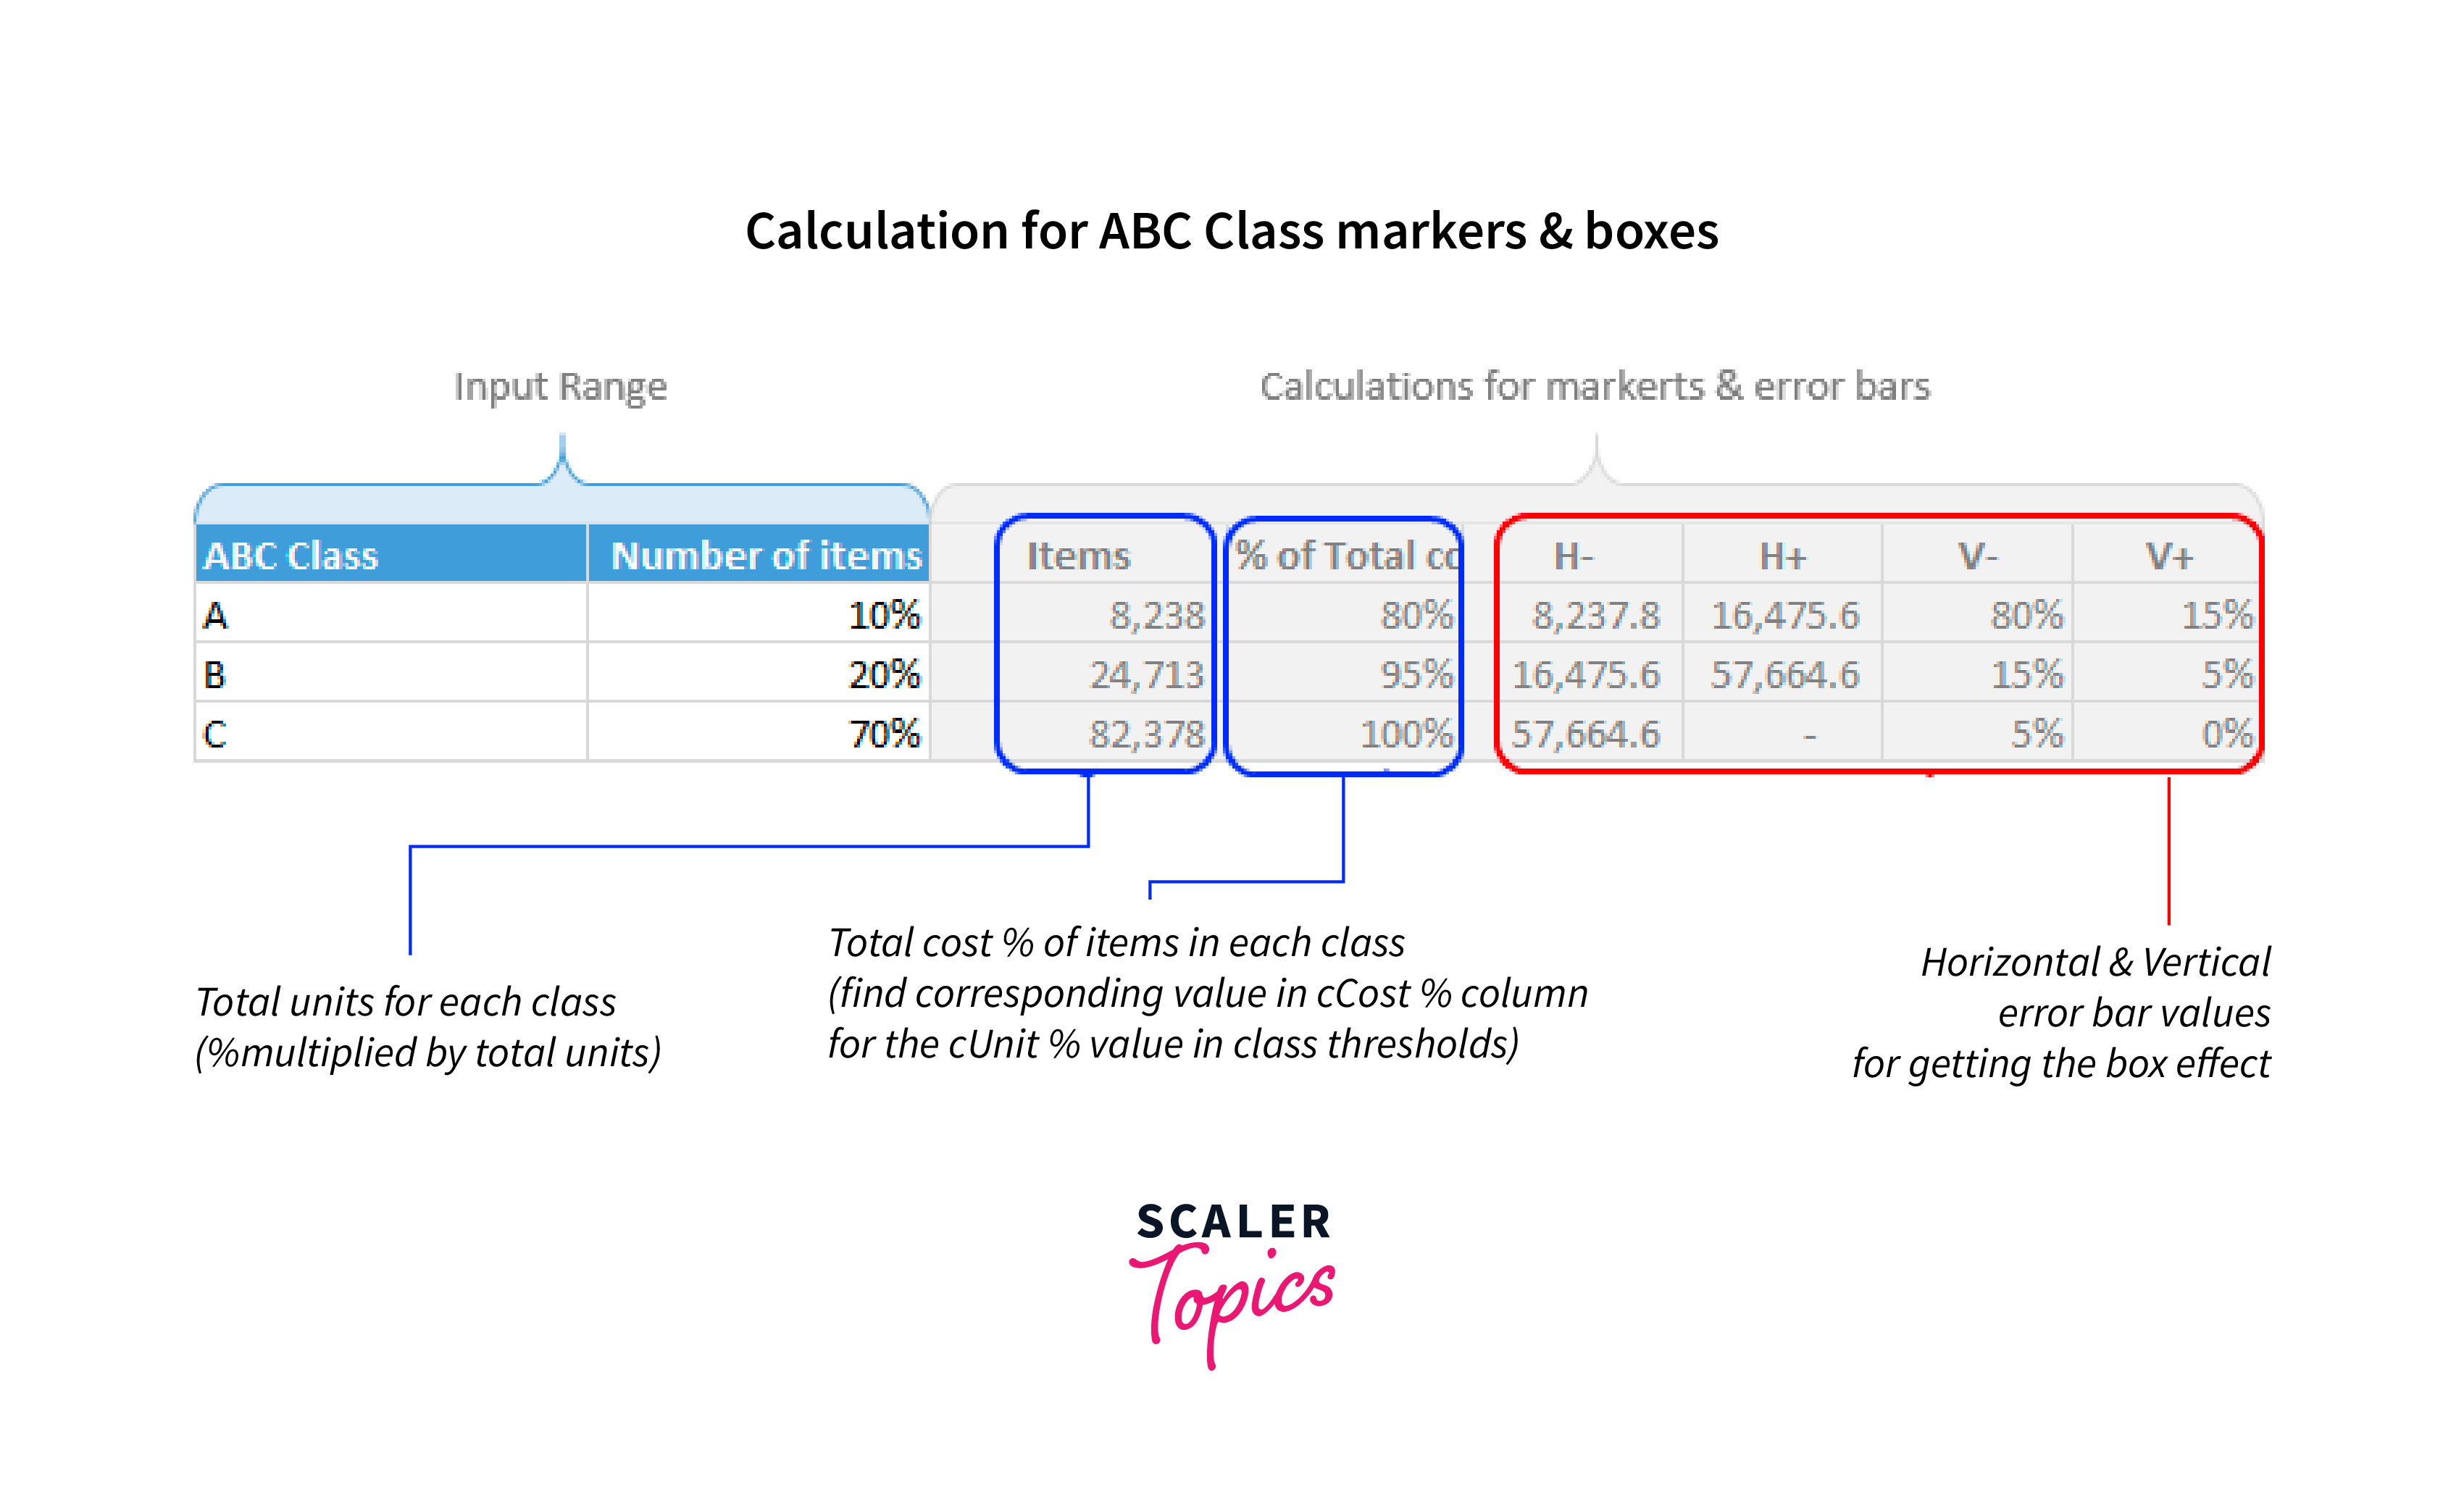
To plot A, B, and C markers and boxes, calculate extra numbers next to this range as follows:
Add the ABC items & % total cost columns to chart
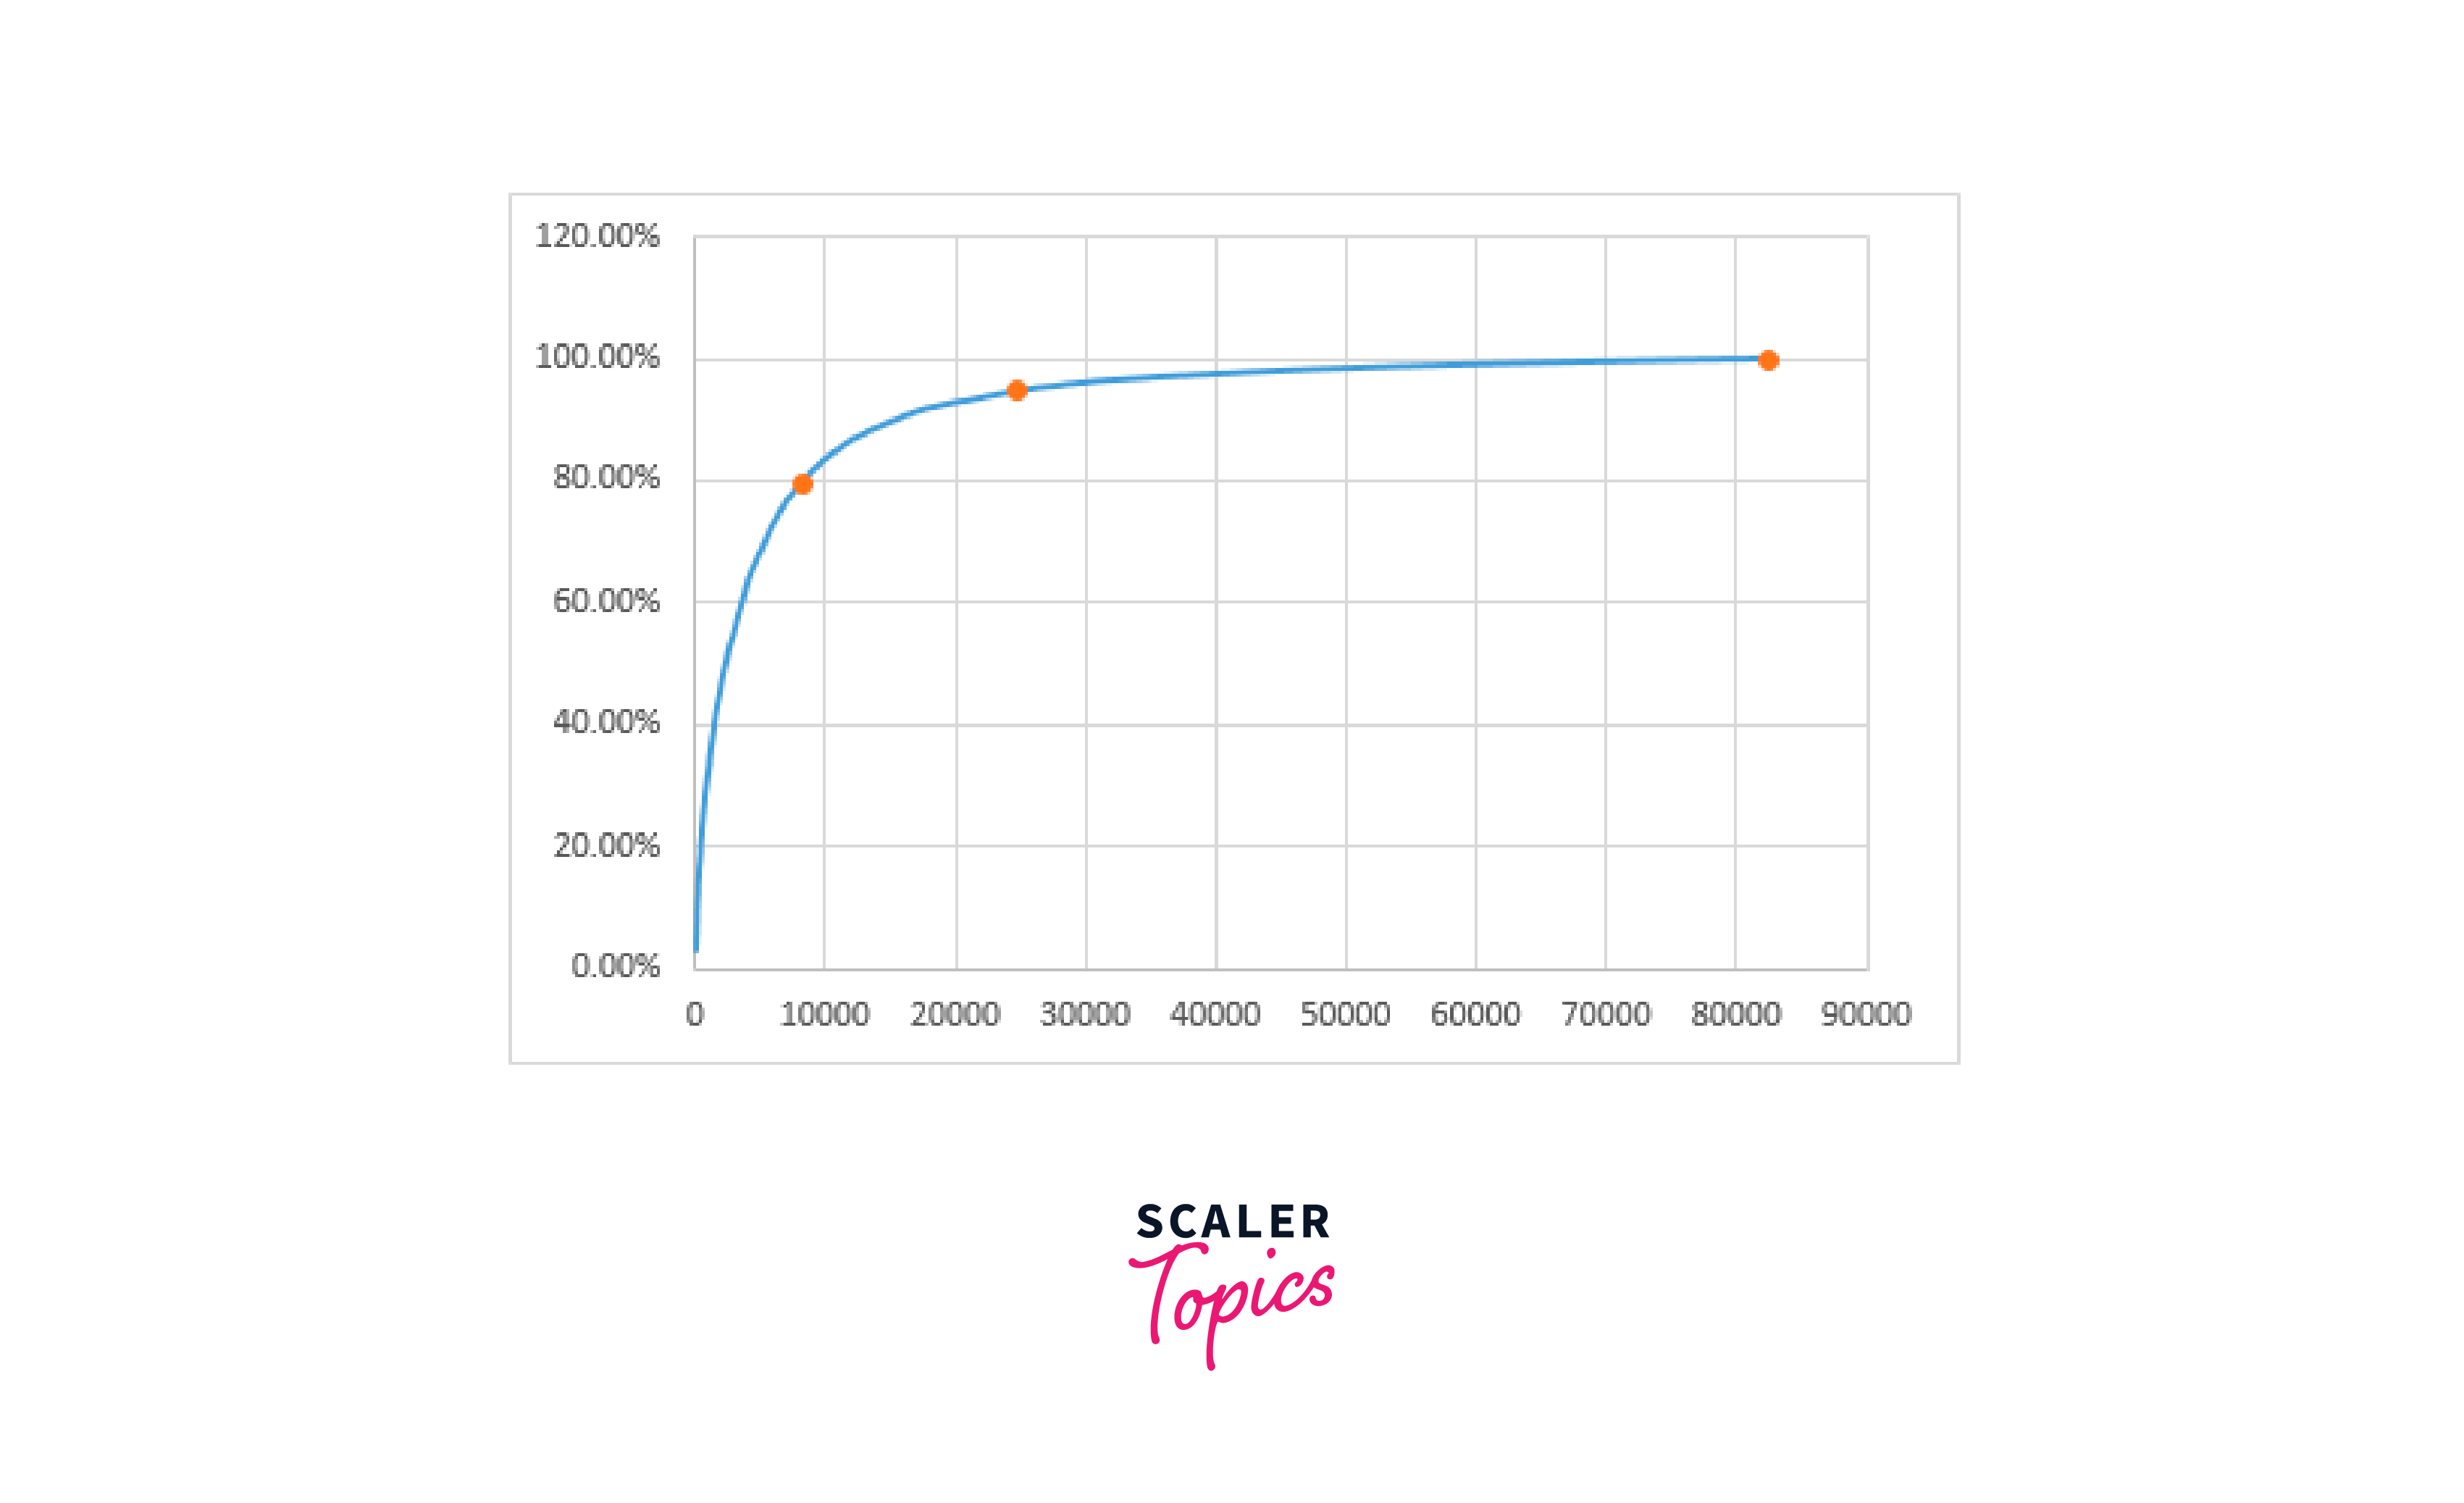
By right-clicking the chart, selecting the data box, and clicking the "Add" button, you may add the additional data to the chart.
Make sure to format the new series as markers only after it has been introduced so that it appears like this.
Add Error bars to the ABC markers to get boxes
This step includes modifying and adding error bars to ABC marker series.
Add error bars in Excel 2013 by selecting the Add button next to the chart.
In previous iterations: Do this using the layout ribbon.
Customize the error bars after they have been added (select and press CTRL+1). Choose the calculated error values as shown below, setting the error amount to Custom.
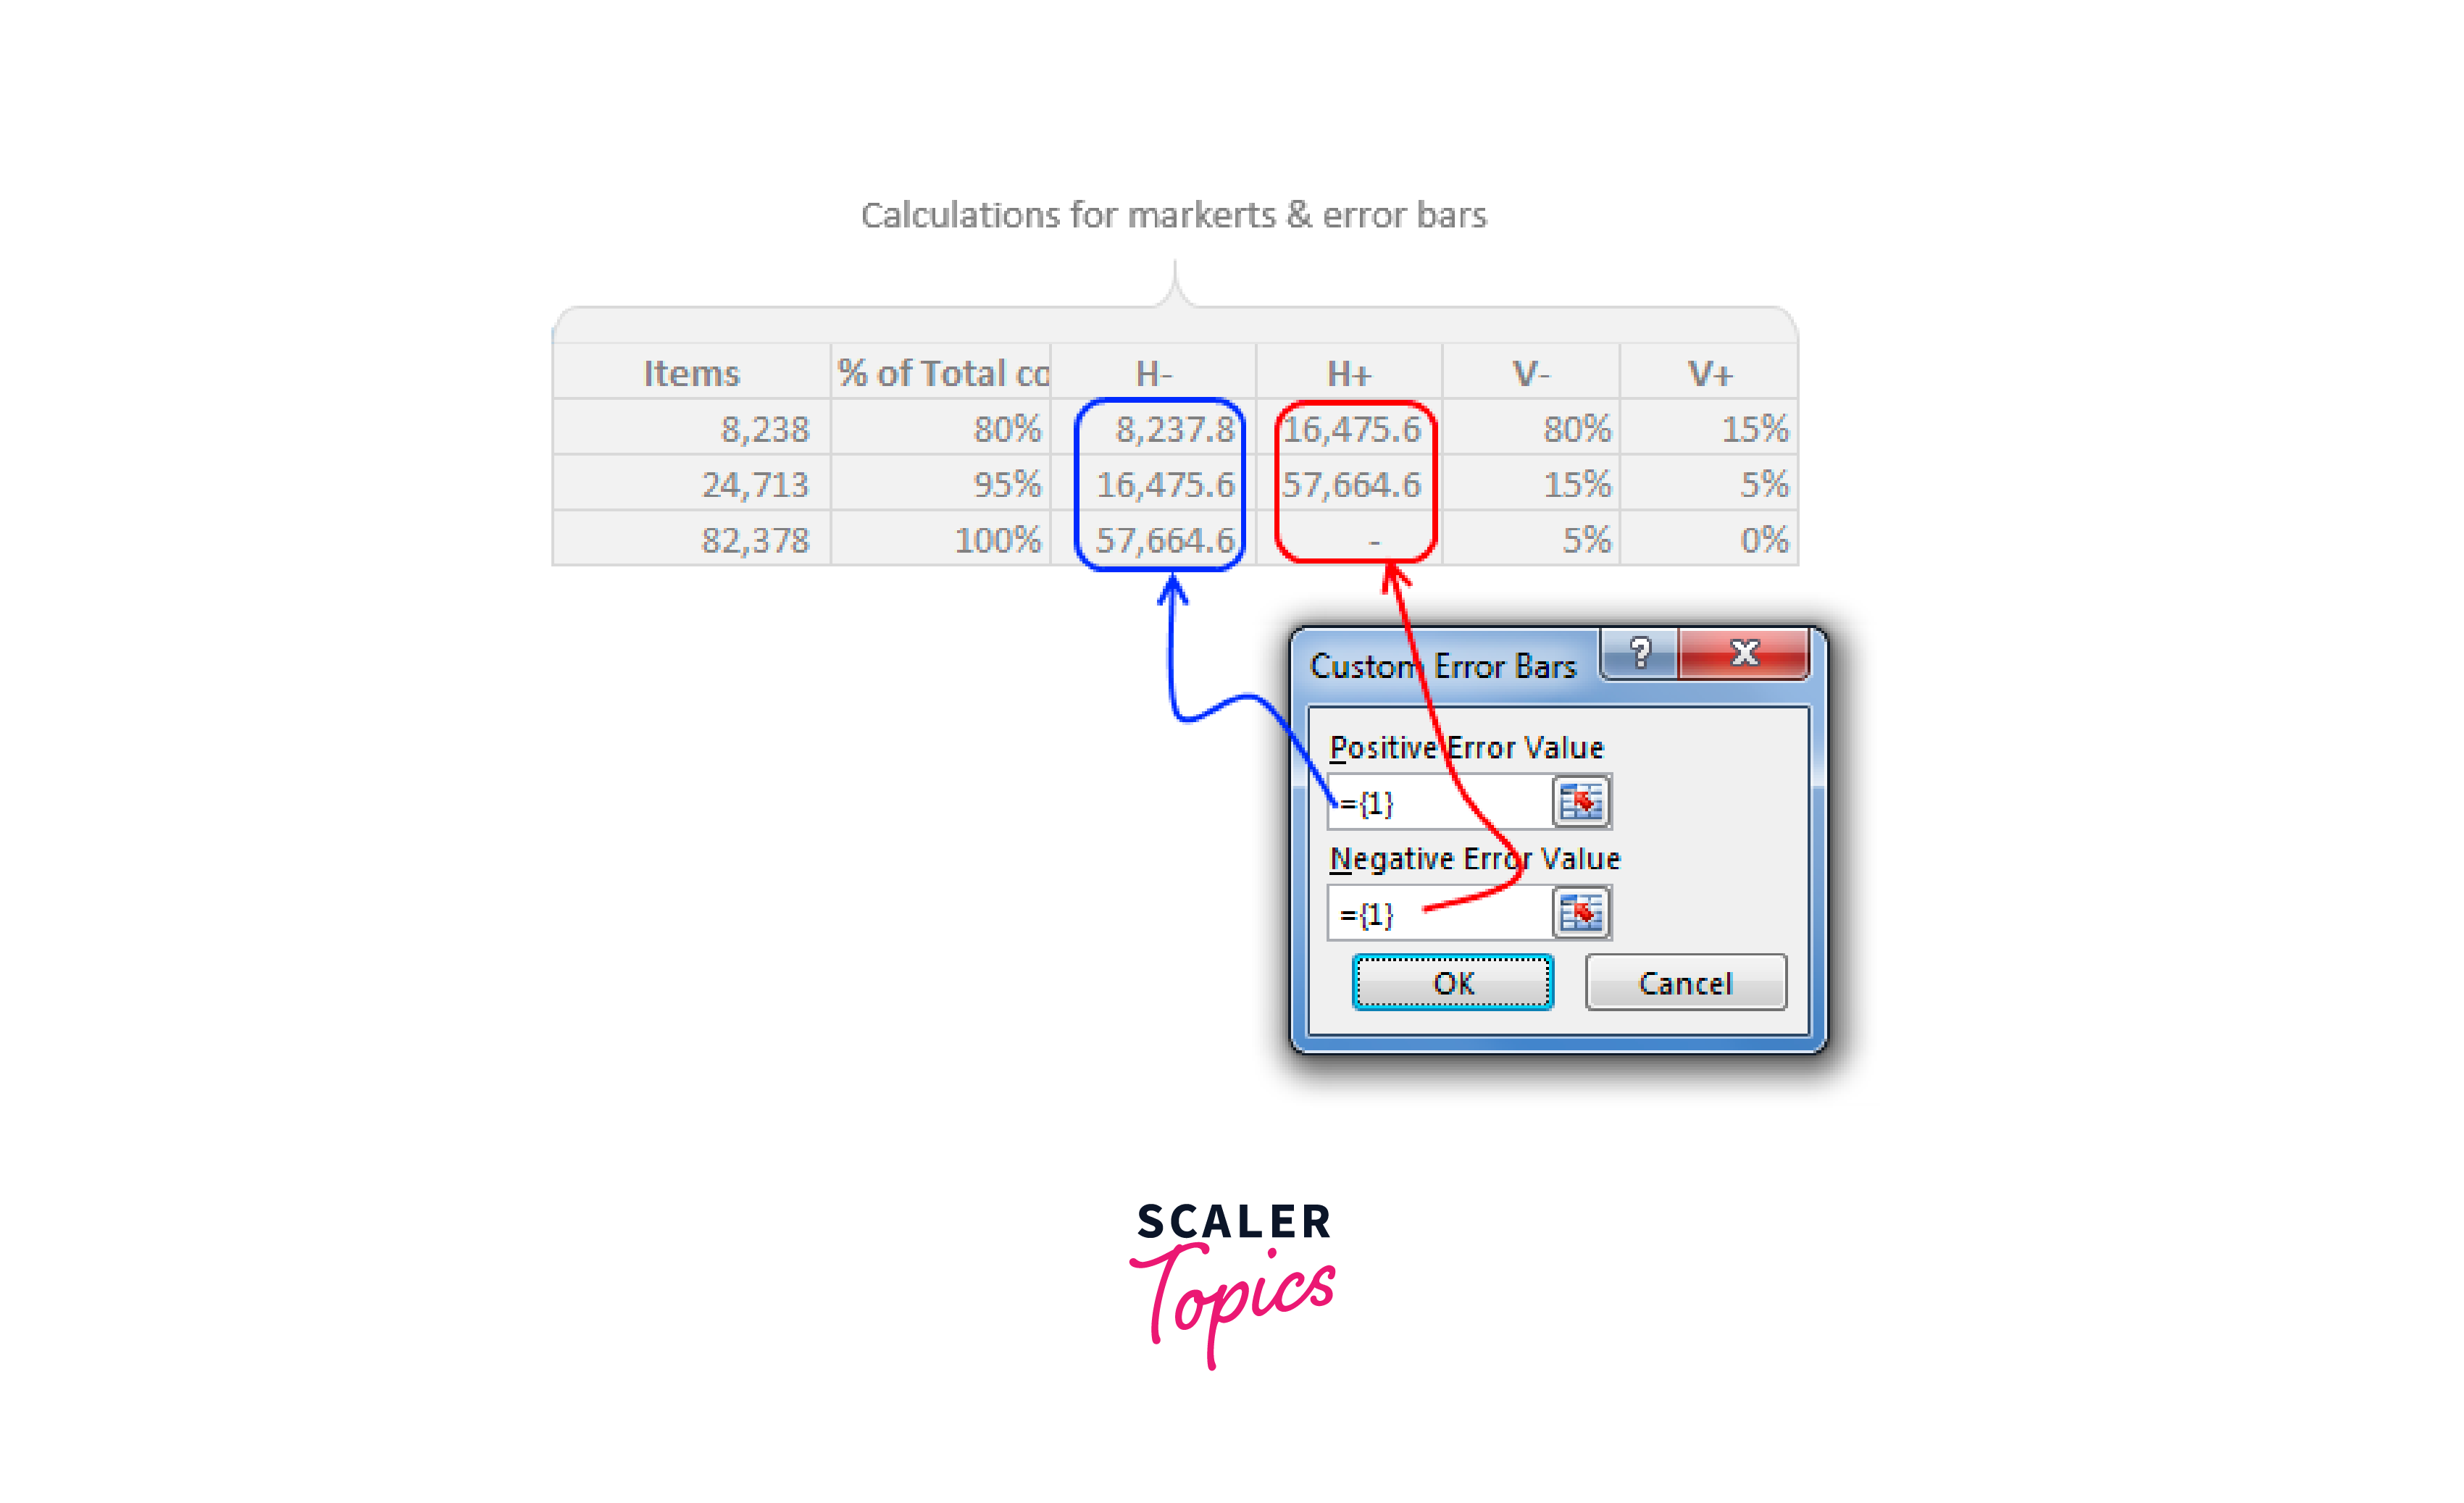
After being inserted, format the error bars to not display a cap and alter the line colour to a pleasant one.
In the chart, there are now boxes.
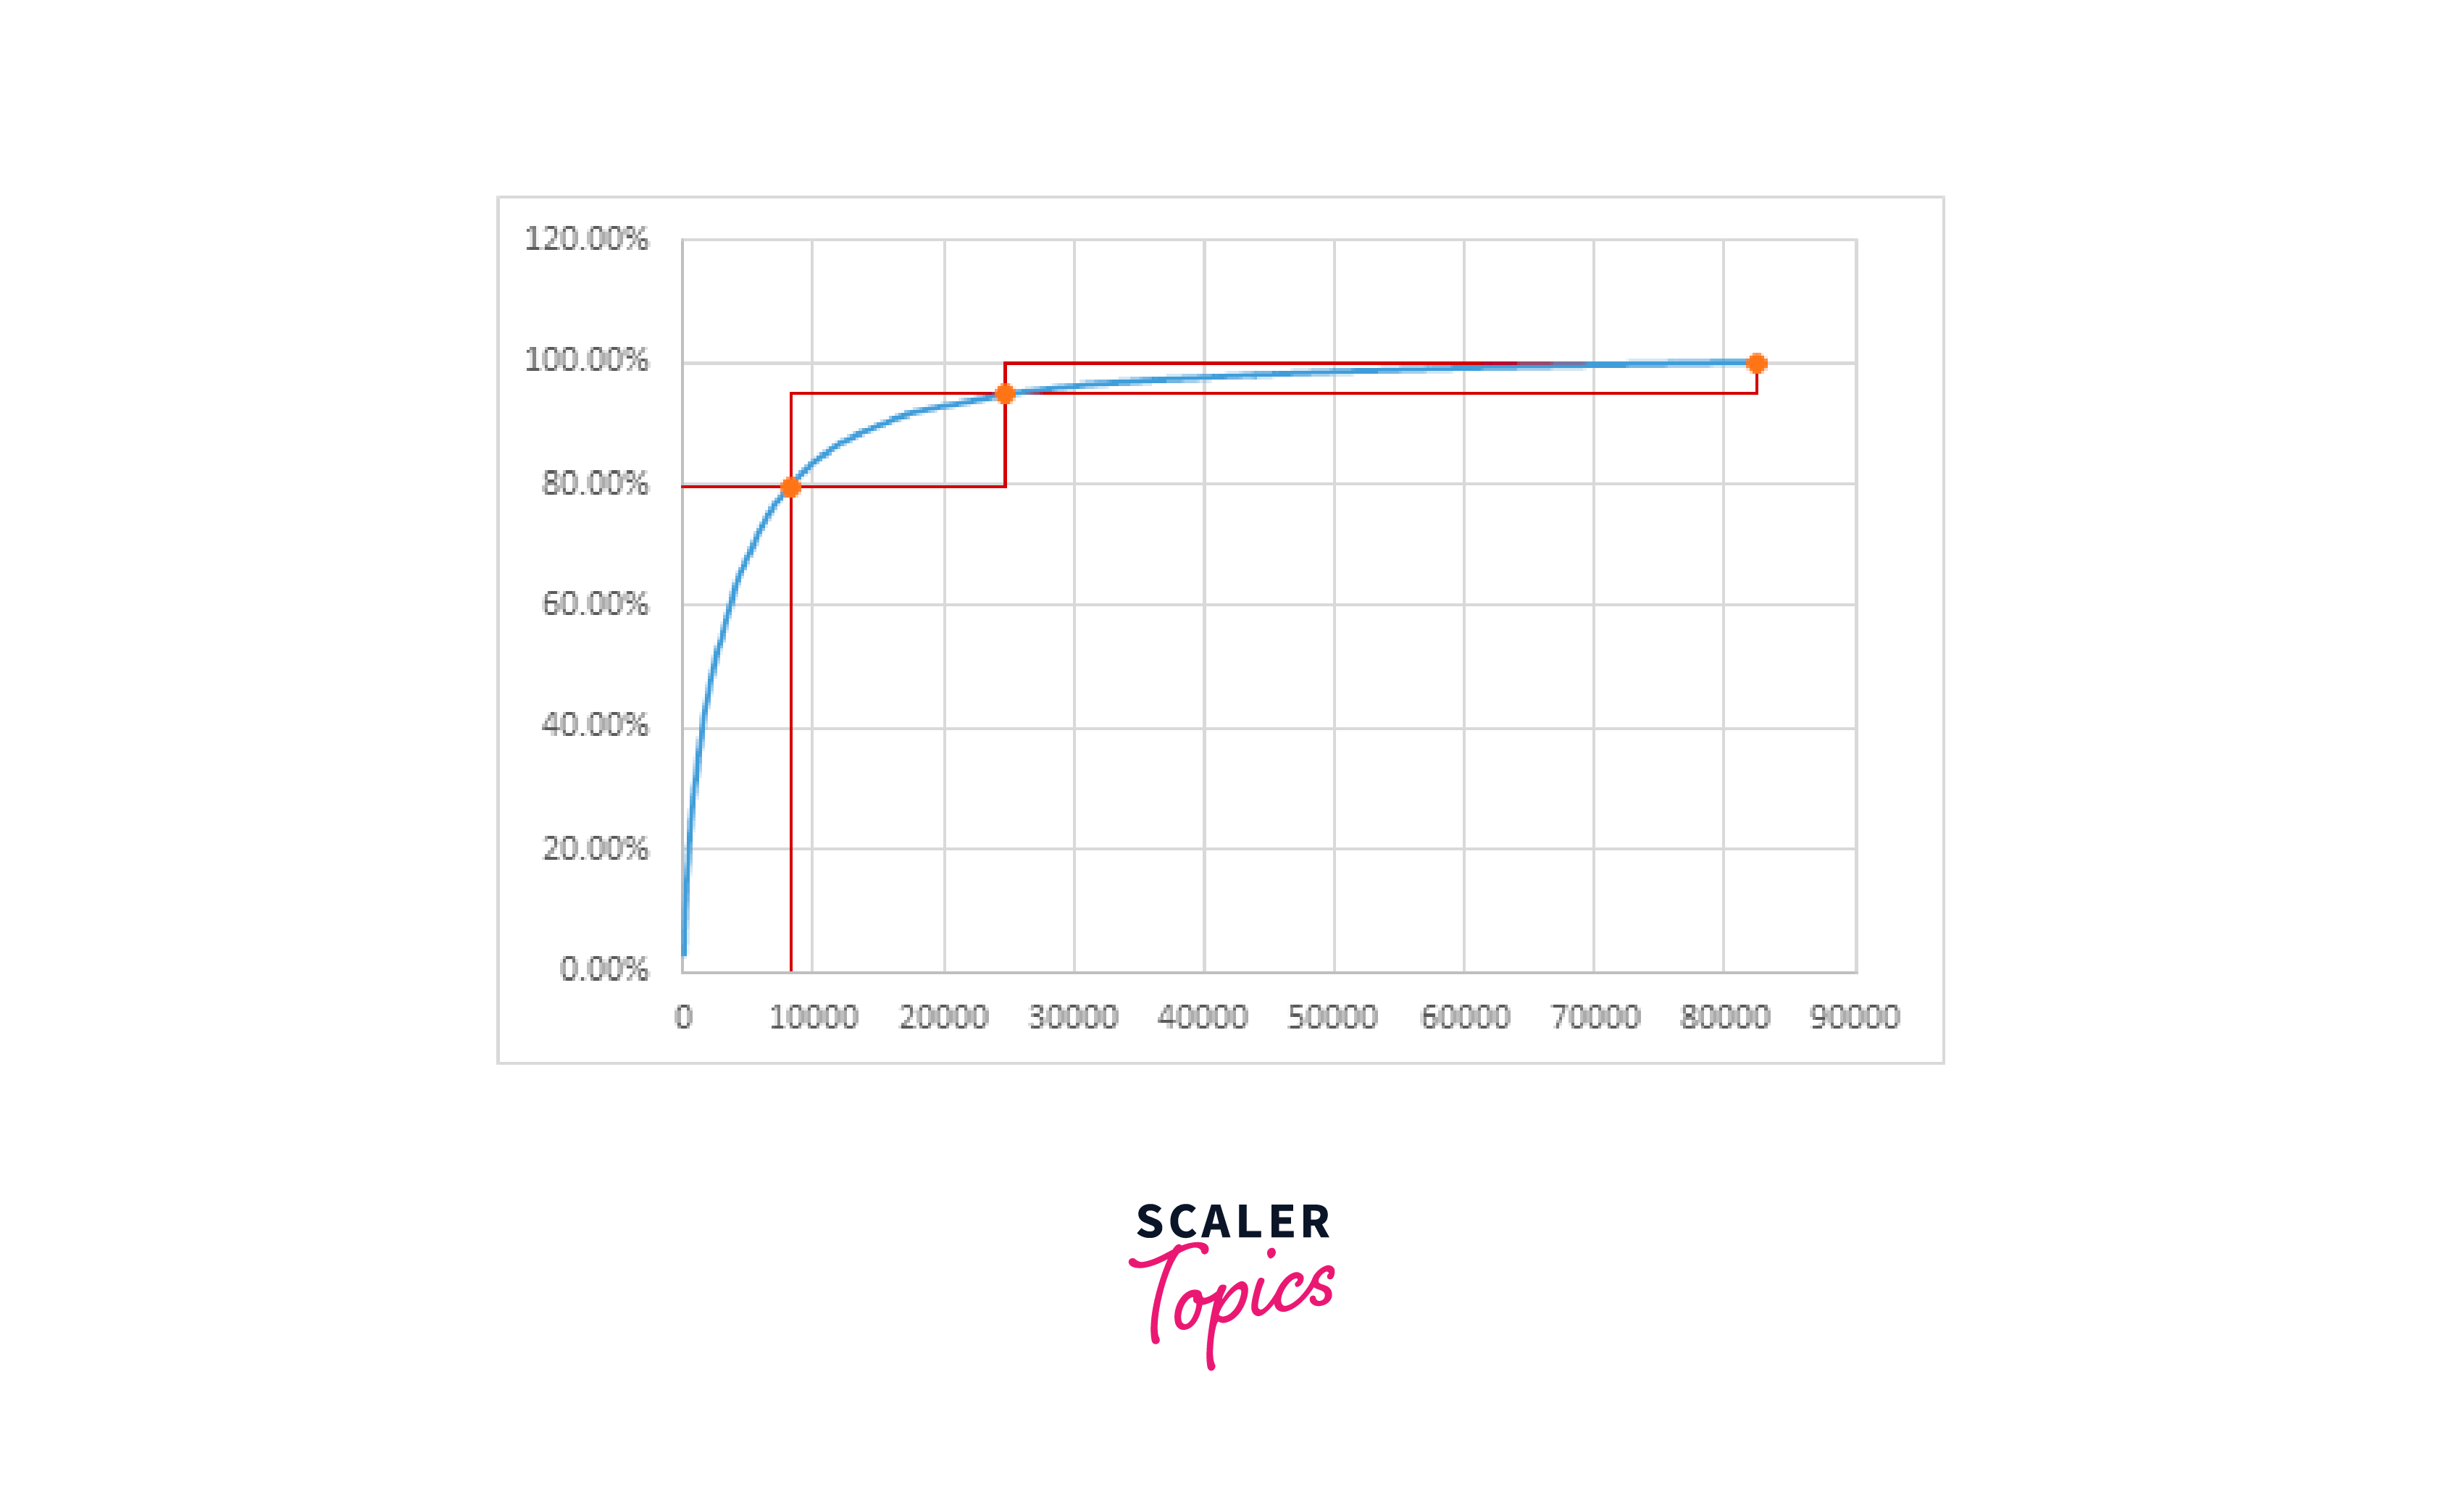
Clean up the chart, add labels & titles
Use your imagination here. We can get to a level like this with little cleanup.
Testing
ABC analysis is typically used by businesses to determine the goods that generate the greatest income and the key customers who purchase those products. But, it can also be used to pinpoint their target market or comprehend their clientele.
Customers are categorised in a similar way based on whether they purchase category A products, B products, or C products, similar to how goods are categorised as A, B, & C depending on their value in the market. The firms attempt to interact with the customers in accordance with this classification.
Conclusion
- The ABC analysis formula is a method of inventory classification that divides the products into three groups, A, B, and C, according to their revenue.
- In the ABC analysis formula, "A" stands for the most significant inventory, "B" for moderately necessary inventory, and "C" for the least important inventory.
- Your organisation will determine how the ABC categories are divided, but the percentages should be roughly 80%, 15%, and 5%.
- Businesses can determine customer demands with the aid of ABC analysis and stock products accordingly. As a result, there is less wastage of both commodities and capital.
- It enables you to negotiate the best prices with suppliers.
- You may satisfy your clients by always having what they want thanks to ABC analysis formula, which helps you keep up with their expectations.
- With the help of ABC analysis formula, only product demands are used as the basis for manufacturing. More money and resources can be saved as a result of this.
- Depending on the category to which they belong, particular commodities are counted more frequently. As a result, neither your inventory is overflowing with goods nor do you run out of stock.
- Because they fall under the category of necessary commodities, medications also fall under this category and should always be kept on hand. You may quickly categorise these medications using ABC analysis.




