ALL() Function in Power BI
Overview
In the dynamic world of data analysis and business intelligence, the DAX (Data Analysis Expressions) language plays a pivotal role. Among its array of functions, the ALL function in Power BI stands out as a powerful tool with a wide range of applications. The ALL function in Power BI is used to remove or modify filters on specific columns or tables, providing a comprehensive view of data without constraints. This article delves into the depths of the ALL function in Power BI, exploring its syntax, parameters, and various examples to revolutionize your data modeling and analysis endeavors.
Syntax of ALL() Function in DAX
The ALL function in Power BI is a filtering function that removes or modifies filters on specified columns or tables within a dataset. It allows for temporarily altering the filtering context, enabling comprehensive analysis and calculations across the entire dataset, disregarding existing filters. This function is valuable for gaining insights and making informed decisions by providing an unobstructed data view without constraints. The syntax of the ALL function in PowerBI DAX is quite straightforward. It looks like this -
Parameters of ALL() Function in DAX
Here are the parameters of the ALL function in Power BI in a tabular format -
| Parameter Name | Description |
| table_name | The name of the table from which filters are to be removed. |
| column_name | (Optional) The specific column for which filters should be cleared. |
Return Value of ALL() Function in DAX
When you use the ALL function in Power BI, it returns the table or column with all filters removed. This means you get a clear and unfiltered view of your data, allowing you to perform calculations and analysis without any filter constraints.
Exceptions of ALL() Function in DAX
While the ALL function in Power BI is a versatile tool, there are a few points you should keep in mind while using it -
- Context Matters - The effect of the ALL function in Power BI depends on the context in which it's used. It might only sometimes remove all filters if there are other functions or expressions involved. The interaction with other functions and filters can affect the outcome.
- Multiple Tables - When dealing with relationships between multiple tables, using the ALL function in Power BI might require additional considerations to achieve the desired results. The relationships between tables can influence the way filters are removed.
- Performance Impact - Using the ALL function in Power BI extensively in complex calculations or queries can potentially impact query performance. Using it judiciously is important, especially in scenarios involving large datasets.
- Column Interactions - Applying the ALL function to a specific column might lead to unexpected results when interacting with other columns in calculations. The removal of filters from one column can affect calculations involving related columns.
How Does The All() Function In Dax Work?
The ALL function in DAX is a data analysis expression used to alter the filtering context of a table or column, temporarily removing filters and enabling comprehensive calculations and analysis across the entire dataset. The ALL function in Power BI works as a filter modifier, allowing you to manipulate the filtering context of your data. When you use ALL, it clears or modifies filters on the specified table or column, providing a clean slate for calculations and analysis.
Imagine you're looking at a dataset with various filters applied, like filtered by region or category. Applying ALL to a table or column wipes away these filters, enabling you to view the data without any restrictions. This is particularly useful when you want to perform calculations across the entire dataset, ignoring the applied filters temporarily.
Consider a scenario where you're examining sales data for various products. By applying filters for specific products, you might focus on insights for a specific product. However, if you want to assess the ratio of product sales to the total sales across all regions, the ALL function comes into the picture. Using the ALL function on the product table, you can neutralize any filters, ensuring that the ratio calculation considers the complete sales dataset. This enables you to derive a more comprehensive understanding of each product's performance relative to the entire sales landscape, making strategic decisions based on a broader perspective.
Examples
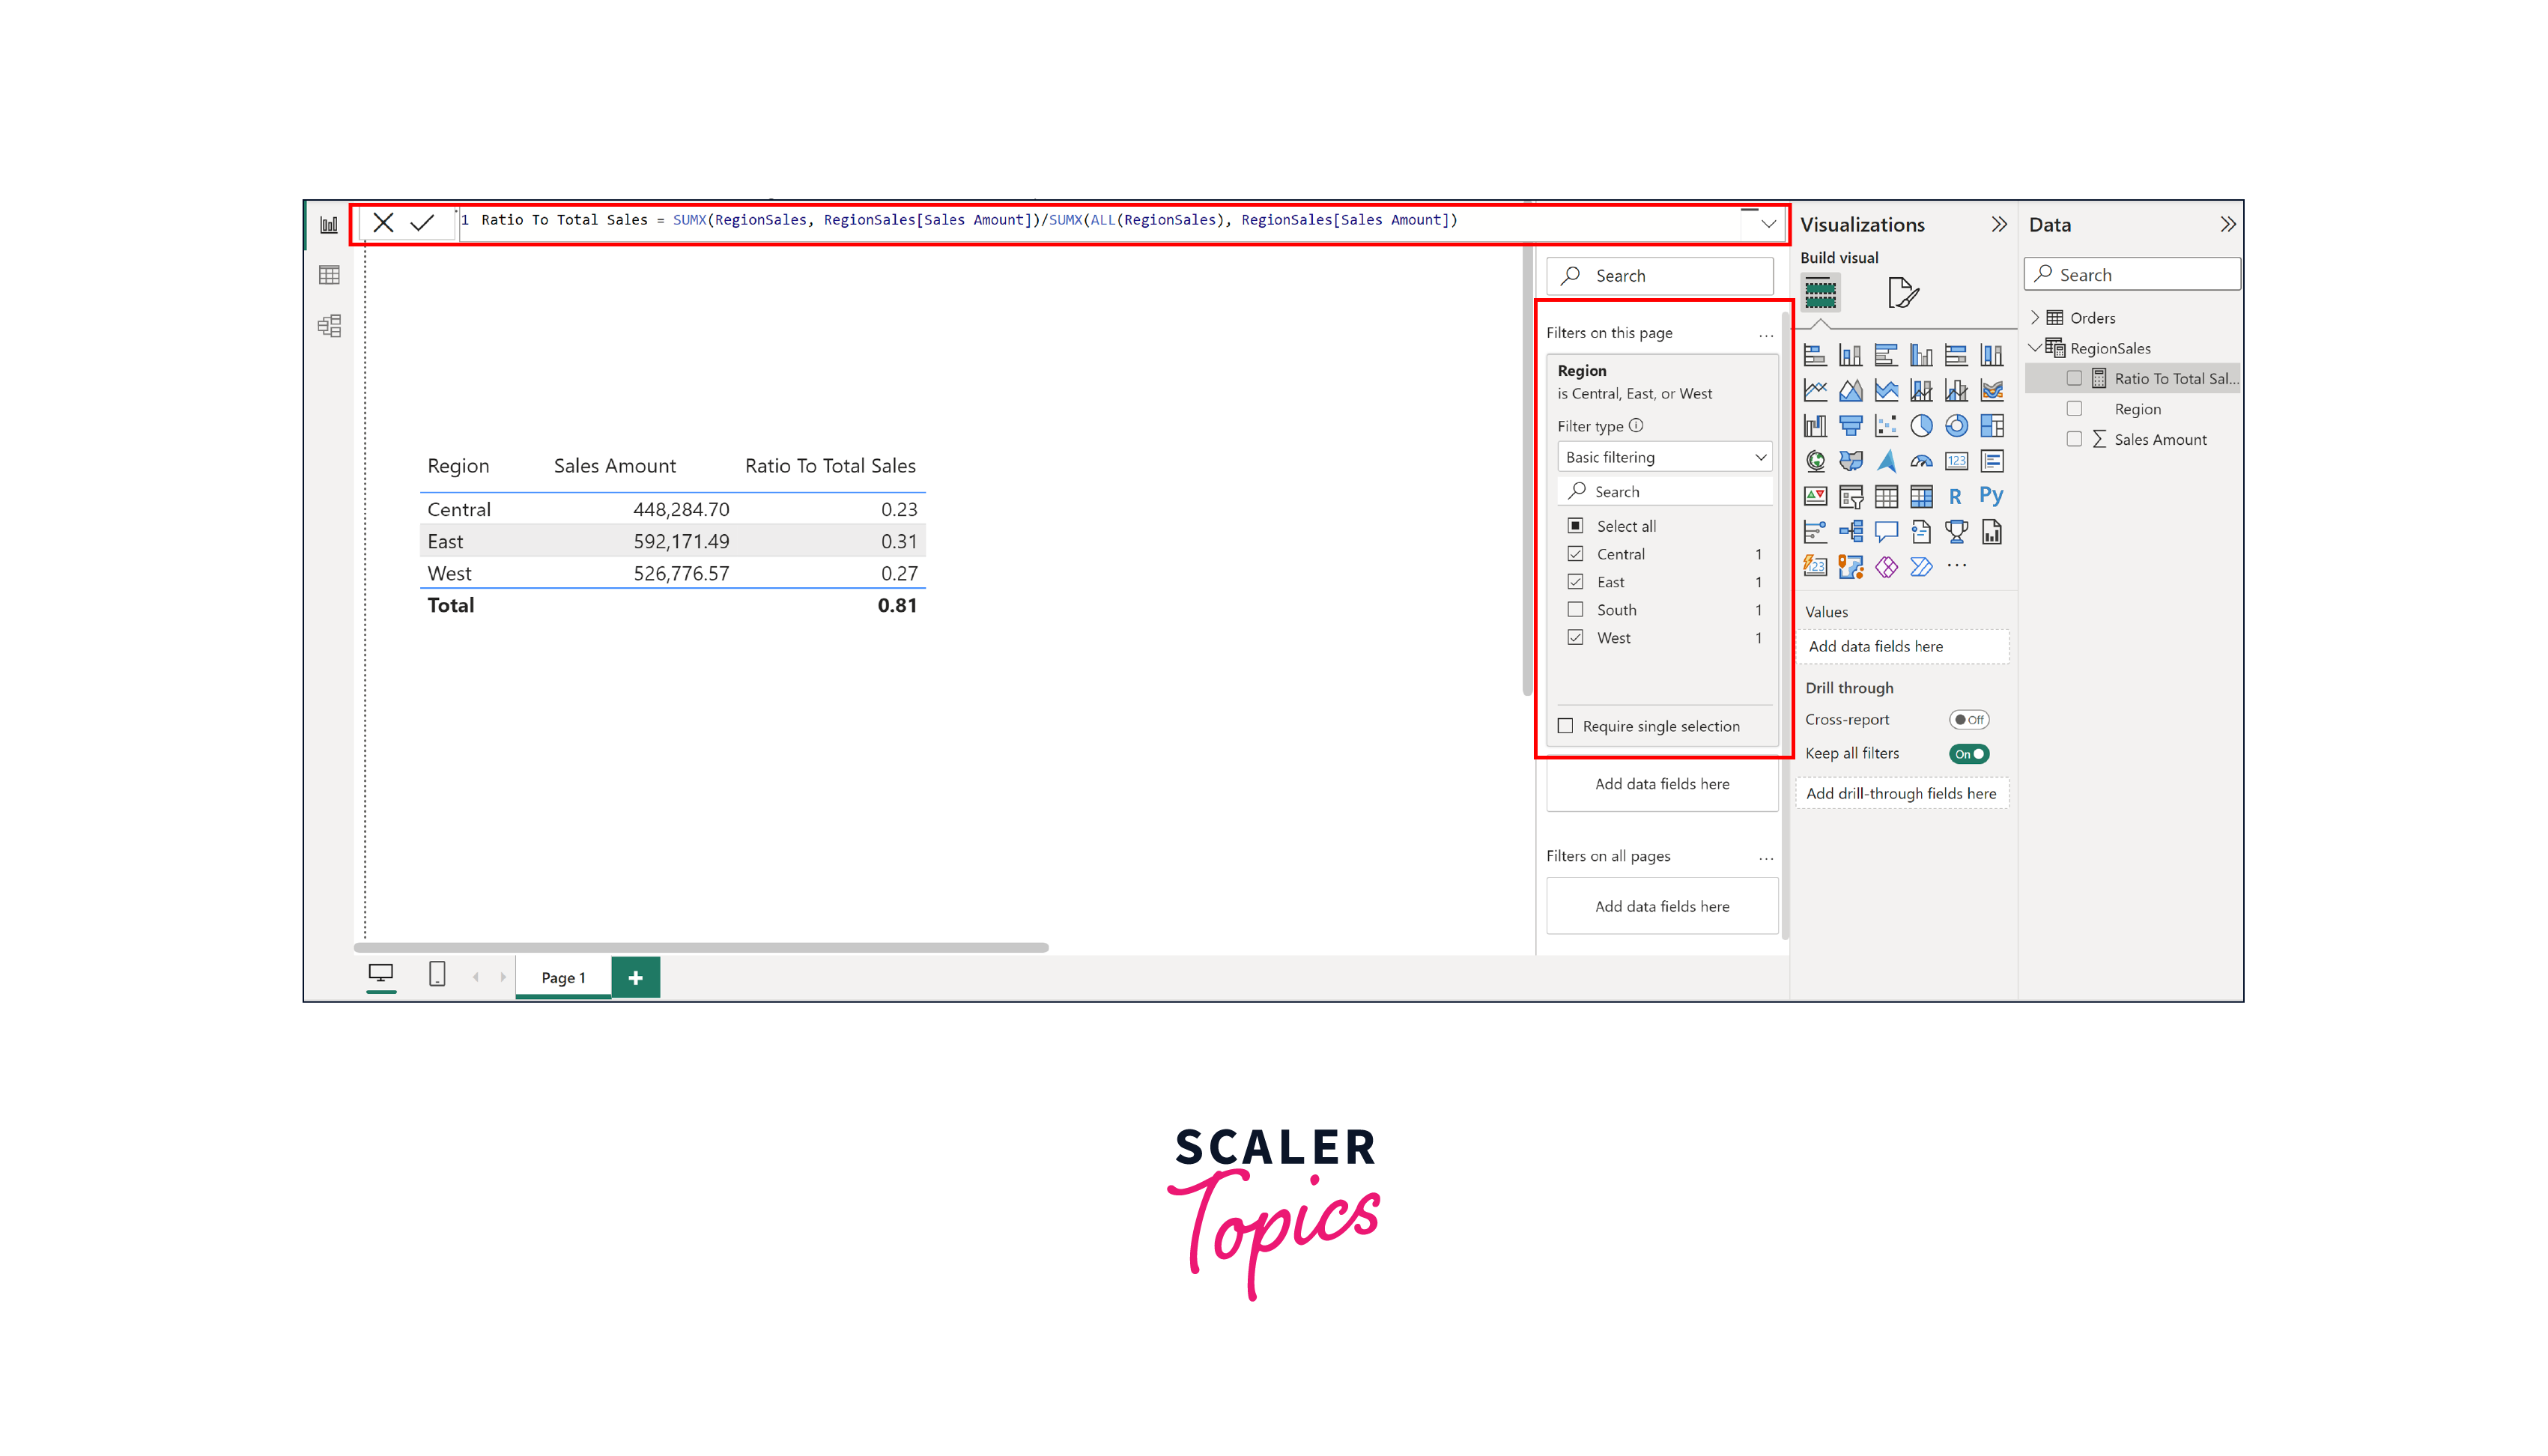
Suppose you have a sales dataset containing information about different regions and their respective sales amounts. The dataset includes two columns - "Region" and "Sales Amount". Now, you want to calculate the contribution of each region's sales to the total sales. You can use the ALL() function to temporarily disregard any filters applied to the "Region" column and compute the ratios accurately.
For this, we will create a new measure, "Ratio To Total Sales", representing the ratio of regional sales to total sales using DAX query as shown below -
the "Ratio To Total Sales" measure calculates the ratio of the sum of sales for each region to the sum of total sales across all regions. The ALL function removes any filters applied on the "Region" column, ensuring that the calculation considers the entire dataset's sales amount.
Conclusion
- The ALL function in Power BI DAX is a versatile tool that modifies the filtering context of data, enabling comprehensive analysis by temporarily removing filters from a specified table or column.
- It enhances data analysis by allowing for accurate calculations across the complete dataset, offering insights that might be obscured by individual filters.
- The syntax of the ALL function in Power BI is simple, with the option to specify a table or column to remove filters from.
- While the ALL function in Power BI provides a fresh perspective, its impact depends on the context and interactions with other functions, requiring cautious usage.
- Multiple table relationships and potential performance impacts should be considered when implementing the ALL function in Power BI.
- By utilizing the ALL function strategically, data professionals can gain a holistic view of their data, uncover hidden trends, and make informed decisions.
- In complex scenarios such as calculating regional sales contributions, the ALL function empowers analysts to evaluate data accurately, unburdened by specific filters, and achieve a comprehensive understanding of their data landscape.