Bayesian Belief Network
Overview
Bayesian belief networks (BBNs) are probabilistic graphical models that are used to represent uncertain knowledge and make decisions based on that knowledge. They are a type of Bayesian network, which is a graphical model that represents probabilistic relationships between variables. In this article, we will provide an overview of BBNs and their applications.
Introduction
In the field of artificial intelligence and decision-making, Bayesian Belief Networks (BBNs) have emerged as a powerful tool for probabilistic reasoning and inference. BBNs provide a framework for representing and analyzing complex systems by explicitly modelling the relationships between uncertain variables. With their ability to reason under uncertainty, BBNs have found wide-ranging applications in areas such as healthcare, finance, environmental management, and more. In this technical article, we will explore the fundamentals of Bayesian Belief Networks, their construction, inference algorithms, and real-world applications. Whether you are a researcher, practitioner or enthusiast in the field of AI, this article will provide you with a comprehensive understanding of BBNs and their potential for solving real-world problems.
Bayesian Network Consists Of Two Parts
Together, the DAG and the conditional probability tables allow us to perform probabilistic inference in the network, such as computing the probability of a particular variable given the values of other variables in the network. Bayesian networks have many applications in machine learning, artificial intelligence, and decision analysis.
Transform Your Career
Choose from our industry-leading programs designed for career success
Modern Software and AI Engineering Program
Master full-stack development with AI integration

Modern Data Science and ML with specialisation in AI
Advanced data science techniques with AI specialization
Advanced AIML with Specialisation in Agentic AI
Deep dive into AIML with focus on Agentic systems
DevOps, Cloud & AI Platform Engineering
Build and manage AI-powered cloud infrastructure
AI Engineering Advanced Certification by IIT-Roorkee
Premier AI engineering certification from IIT-Roorkee
Directed Acyclic Graph
This is a graphical representation of the variables in the network and the causal relationships between them. The nodes in the DAG represent variables, and the edges represent the dependencies between the variables. The arrows in the graph indicate the direction of causality.
Table of Conditional Probabilities
For each node in the DAG, there is a corresponding table of conditional probabilities that specifies the probability of each possible value of the node given the values of its parents in the DAG. These tables encode the probabilistic relationships between the variables in the network.
A Bayesian Belief Network Graph
A Bayesian network is a probabilistic graphical model that represents a set of variables and their conditional dependencies through a directed acyclic graph (DAG). The nodes in the graph represent variables, while the edges indicate the probabilistic relationships between them.
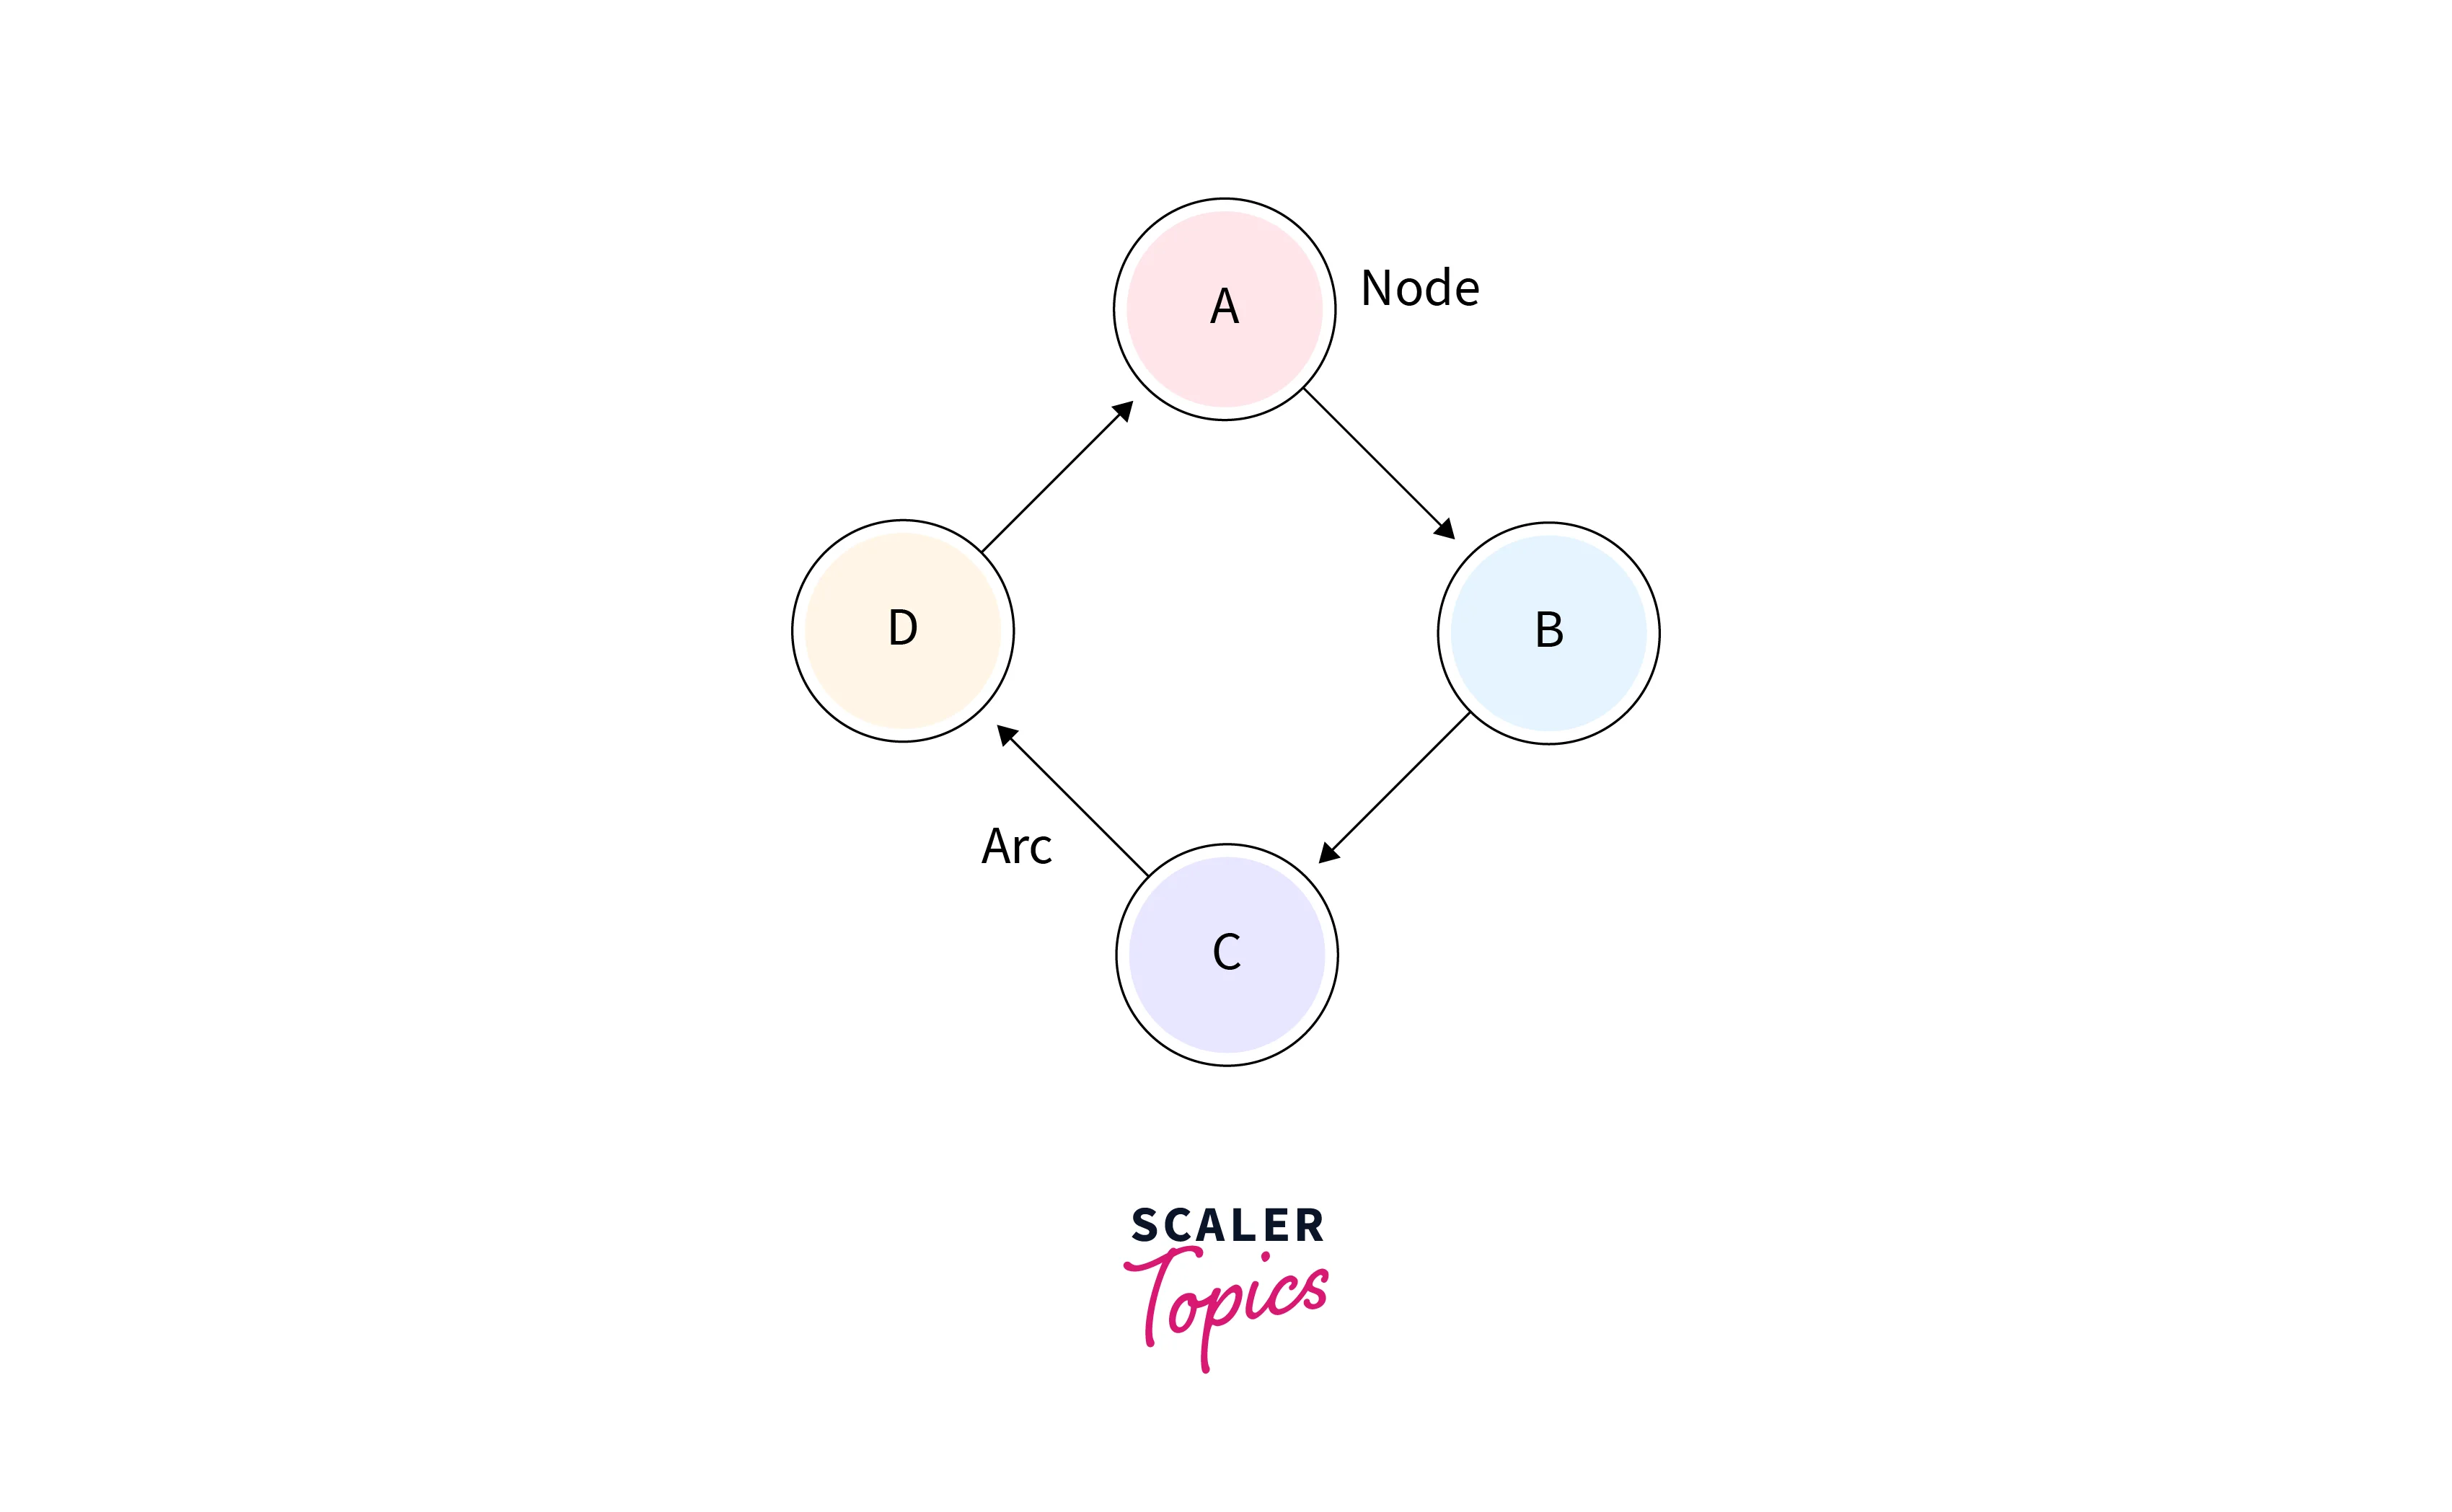
- The nodes of the network graph in the preceding diagram stand in for the random variables A, B, C, and D, respectively.
- Node A is referred to as the parent of Node B if we are thinking about node B, which is linked to node A by a directed arrow.
- Node C is independent of node A.
Stop learning AI in fragments—master a structured AI Engineering Course with hands-on GenAI systems with IIT Roorkee CEC Certification
AI Engineering Course Advanced Certification by IIT-Roorkee CEC
A hands on AI engineering program covering Machine Learning, Generative AI, and LLMs - designed for working professionals & delivered by IIT Roorkee in collaboration with Scaler.
Enrol Now
The Bayesian Network has Mainly Two Components
The Bayesian network has two main components: the causal component and the numerical component. The causal component represents the causal relationships between the variables in the system, while the numerical component provides the actual probabilities that are used to make predictions and to calculate probabilities.
Causal Component
The causal component of a Bayesian network represents the causal relationships between variables in the system. It consists of directed acyclic graphs (DAGs) that show the direction of causal relationships between the variables. The nodes in the DAG represent the variables in the system, and the edges represent the causal relationships between them. The causal component of a Bayesian network is often called the "structure" of the network.
The causal component of a Bayesian network is essential for understanding how the variables in the system are related to each other. It provides a visual representation of the causal relationships between the variables, which can be used to make predictions and to understand how changes in one variable will affect the others.


Actual Numbers
The numerical component of a Bayesian network consists of conditional probability tables (CPTs) for each node in the DAG. These tables specify the probability of each variable given the values of its parent variables. The numerical component of a Bayesian network is often called the "parameters" of the network.
The numerical component of a Bayesian network provides the actual numbers that are used to make predictions and to calculate probabilities. Each node in the network has a CPT that specifies the probability of that node given the values of its parent nodes. These probabilities are used to calculate the overall probability of the system given certain inputs or observations.
Joint Probability Distribution
In Bayesian network modeling, joint probability distribution is a crucial concept that describes the probability of all possible configurations of the network's variables.
The joint probability distribution of a Bayesian network is the product of the conditional probabilities of each node given its parents in the network. This means that the joint probability distribution provides a complete description of the probability distribution of all the variables in the network.
Mathematically, the joint probability distribution of a Bayesian network can be represented as:
P( , , ..., ) = P( | parents())
where , , ..., are the random variables in the network, and parents() represents the set of parent nodes of .
For example, consider a simple Bayesian network with two random variables A and B, where B is dependent on A. The joint probability distribution for this network can be represented as:
where is the probability distribution of A, and is the conditional probability distribution of B given A.
Master structured AI Engineering + GenAI hands-on, earn IIT Roorkee CEC Certification at ₹40,000
AI Engineering Course Advanced Certification by IIT-Roorkee CEC
A hands on AI engineering program covering Machine Learning, Generative AI, and LLMs - designed for working professionals & delivered by IIT Roorkee in collaboration with Scaler.
Enrol NowThe joint probability distribution of a Bayesian network can be used to perform a variety of tasks, such as:
- Inference: Given observed values of some variables in the network, the joint probability distribution can be used to calculate the probabilities of the remaining variables.
- Parameter Estimation: The joint probability distribution can be used to estimate the parameters of the network, such as the conditional probabilities of each node given its parents.
- Model Selection: The joint probability distribution can be used to compare different Bayesian network models and choose the best one that fits the observed data.
- Prediction: The joint probability distribution can be used to make predictions about the behavior of the variables in the network.
Scaler Placement Report and Statistics
Scaler learners achieved 2.5x salary growth with average post-Scaler CTC reaching ₹23L.
Explanation Of Bayesian Network
Let's construct a directed acyclic graph to illustrate the Bayesian network:
Example
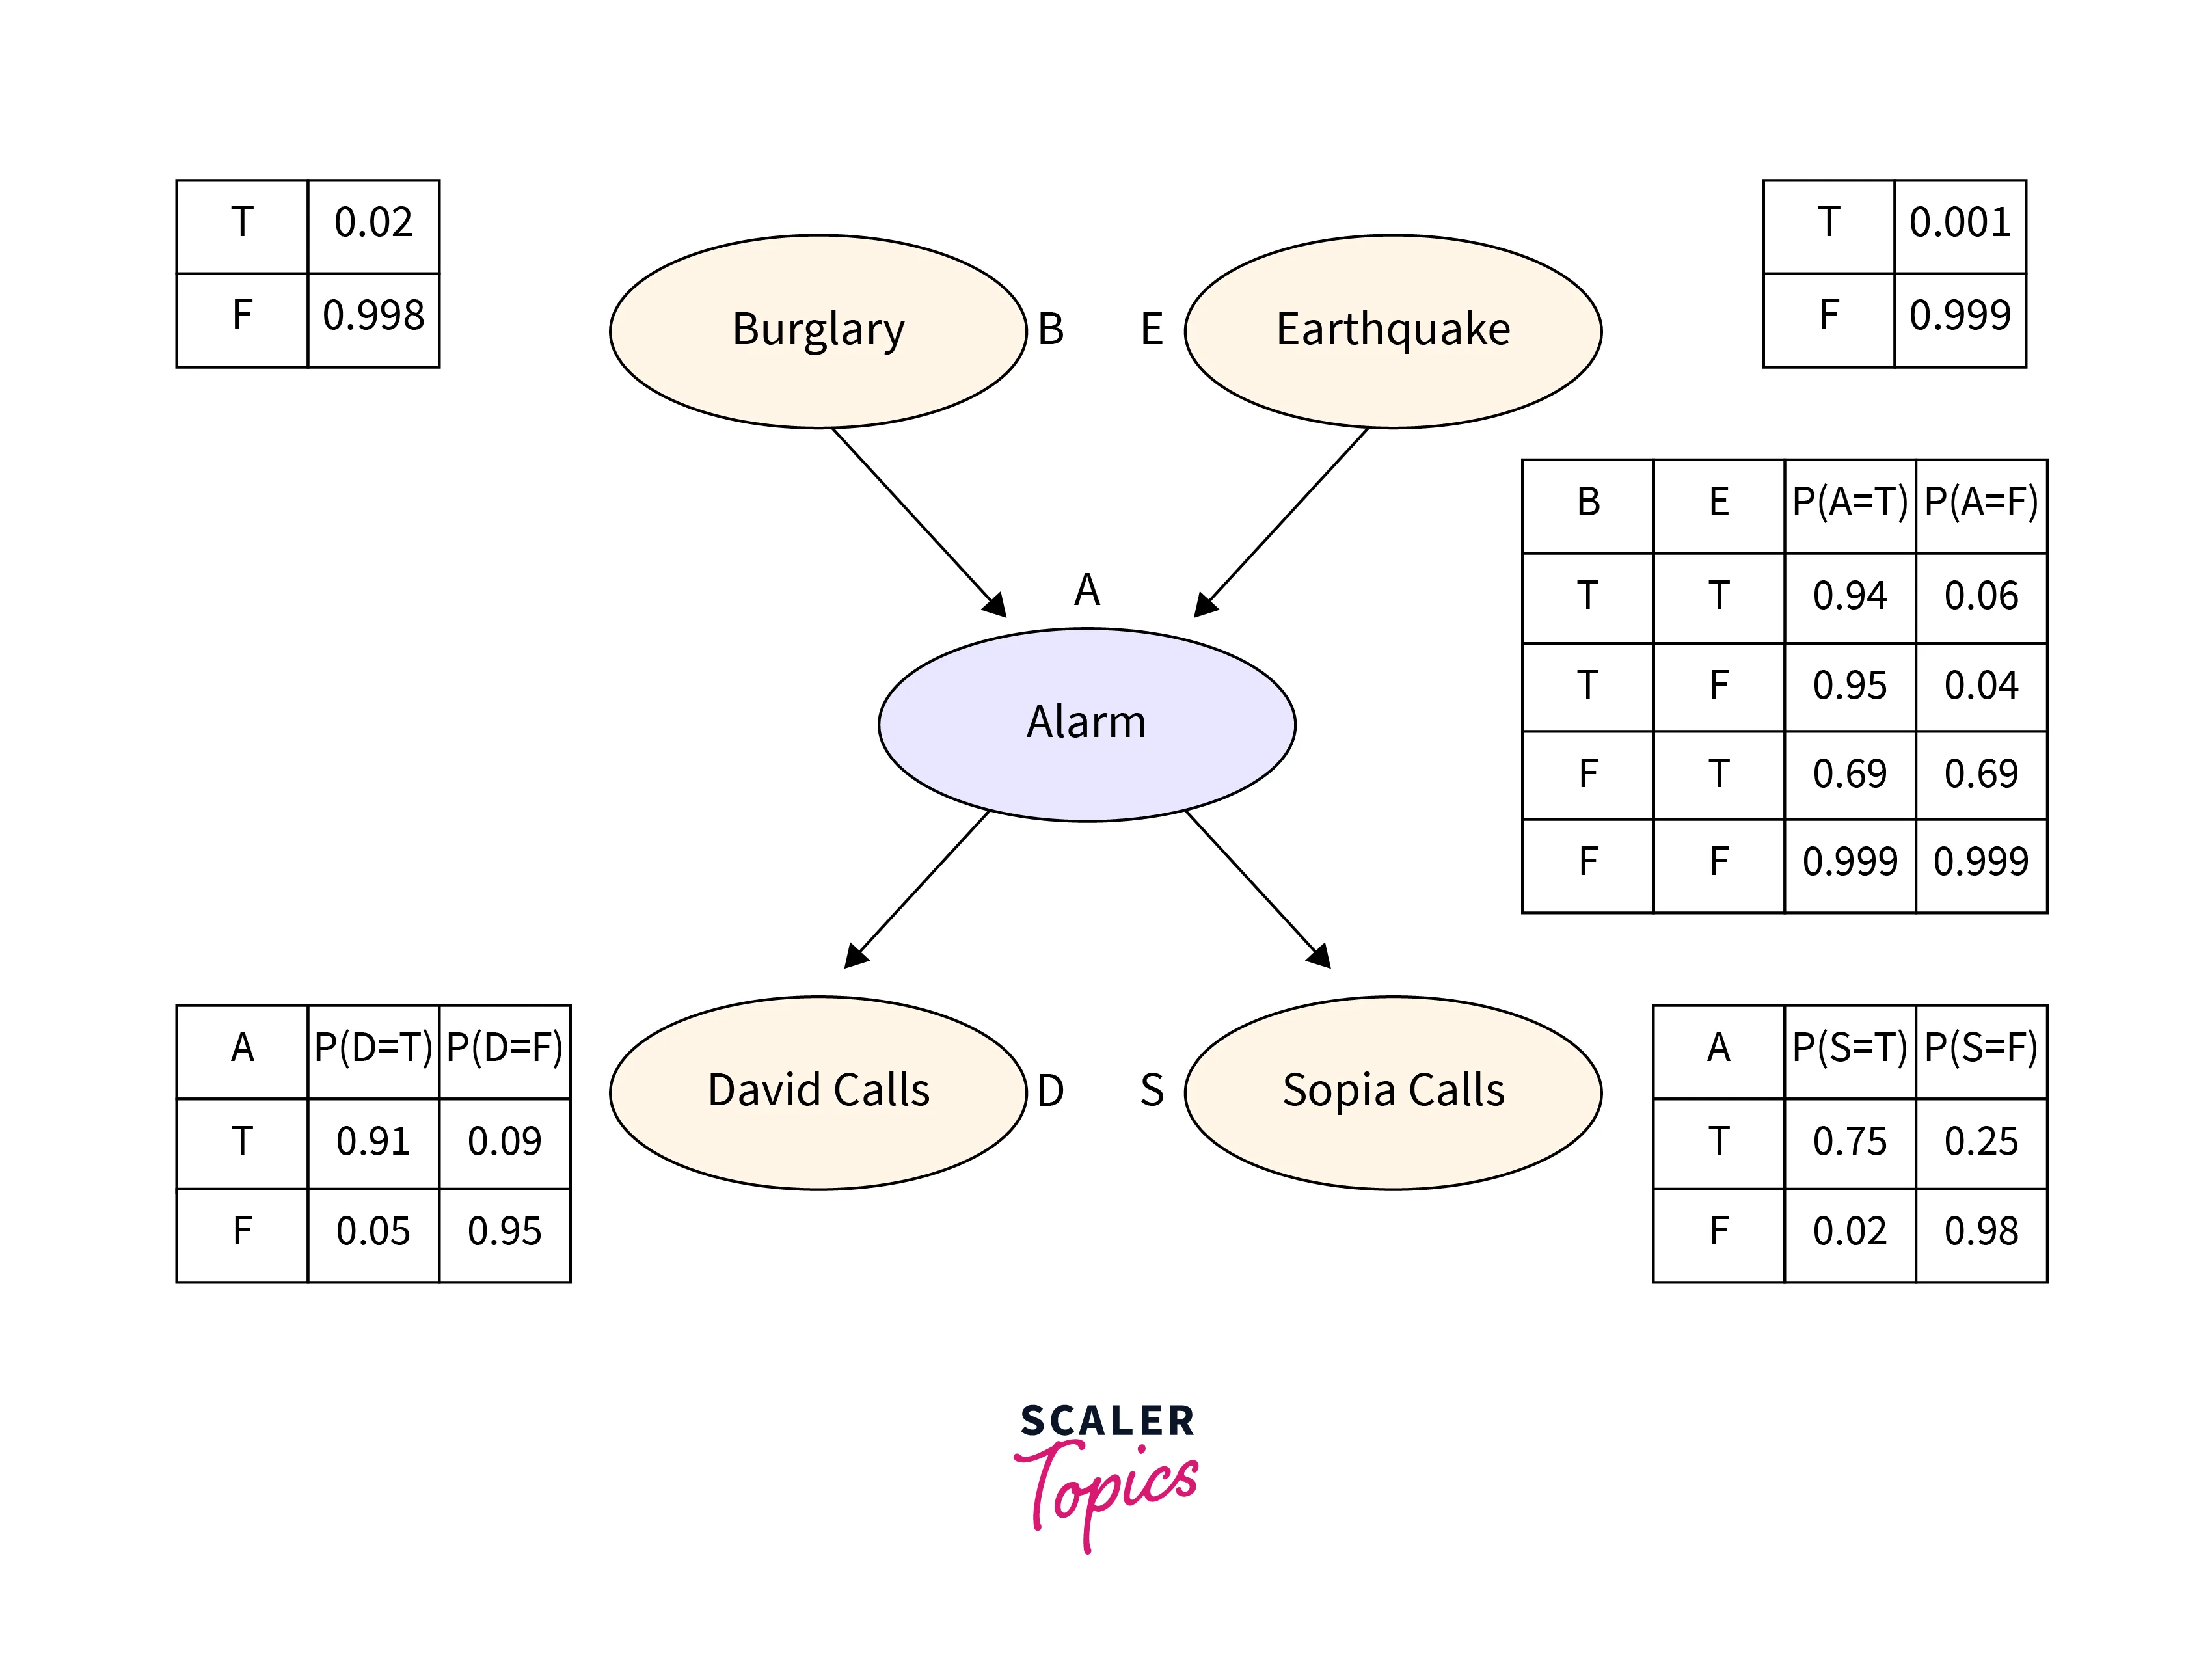
To prevent break-ins, Harry put a brand-new burglar alarm at his house. The alarm consistently reacts to a break-in, but it also reacts to little earthquakes. James and Safina, two of Harry's neighbours, have agreed to call Harry at work when they hear the alarm. James always calls Harry when the alarm goes off, but occasionally he gets distracted by the phone ringing and calls at other times. Safina, on the other hand, enjoys listening to loud music, so occasionally she doesn't hear the alarm. Here, we'd want to calculate the likelihood of a burglar alarm.
Problem
Determine the likelihood that the alarm went off but that neither a burglary nor an earthquake had taken place, and that both James and Safina had phoned Harry.
Solution
- Here is provided the Bayesian network for the aforementioned issue. The network topology demonstrates that earthquake and burglary are the parent nodes of the alarm and directly affect the likelihood that the alarm will sound, but James and Safina's calls depend on the likelihood that the alarm will sound.
- According to the network, our presumptions did not directly observe the break-in, did not see the tiny earthquake, and did not consult with one another before contacting.
- The conditional probabilities table, or CPT, contains the conditional distributions for each node.
- Because every entry in the table represents an exhaustive set of scenarios for the variable, each row in the CPT must add up to 1.
- A boolean variable in CPT has probability for each of its k boolean parents. Hence, CPT will contain 4 probability values if there are two parents.
Become the Ai engineer who can design, build, and iterate real AI products, not just demos with an IIT Roorkee CEC Certification
AI Engineering Course Advanced Certification by IIT-Roorkee CEC
A hands on AI engineering program covering Machine Learning, Generative AI, and LLMs - designed for working professionals & delivered by IIT Roorkee in collaboration with Scaler.
Enrol NowTurn Learning into Career Growth
List Of All Events Occurring in a Bayesian Network
- Burglary (B)
- Earthquake(E)
- Alarm(A)
- James Calls(D)
- Safina calls(S)
We can write the events of problem statement in the form of probability: P[D, S, A, B, E], can rewrite the above probability statement using joint probability distribution:
Let's take the observed probability for the Burglary and earthquake component:
, which is the probability of burglary.
, which is the probability of no burglary.
, which is the probability of a minor earthquake
, Which is the probability that an earthquake not occurred.
Conditional Probability Table for Alarm A
Alarm A's conditional probability is influenced by earthquake and burglary:
| B | E | P(A= True) | P(A= False) |
|---|---|---|---|
| True | True | 0.94 | 0.06 |
| True | False | 0.95 | 0.04 |
| False | True | 0.31 | 0.69 |
| False | False | 0.001 | 0.999 |
Conditional Probability Table for James Calls
James's conditional probability that he will call is based on the probability that an alarm will sound.
| A | P(D= True) | P(D= False) |
|---|---|---|
| True | 0.91 | 0.09 |
| False | 0.05 | 0.95 |
Conditional Probability Table for Safina Calls
The Conditional probability of Safina that she calls is depending on its Parent Node "Alarm."
| A | P(S= True) | P(S= False) |
|---|---|---|
| True | 0.75 | 0.25 |
| False | 0.02 | 0.98 |
From the formula of joint distribution, we can write the problem statement in the form of probability distribution:
¬ ¬ = ¬ ¬¬¬
The Semantics of Bayesian Network
The Bayesian network's semantics can be understood in one of two ways, as follows:
-
To understand the network as the representation of the Joint probability distribution: It is important because it allows us to model complex systems using a graph structure. By representing the joint distribution as a graph, we can easily identify the dependencies and independence relations between variables, which can be useful in making predictions or inferences about the system. Moreover, it can help us to identify the most probable causes or effects of an observed event.
-
To understand the network as an encoding of a collection of conditional independence statements: It is crucial for designing efficient inference procedures. By exploiting the conditional independence relations encoded in the network, we can significantly reduce the computational complexity of inference tasks. This is because we can often factorize the joint distribution into smaller, more manageable conditional probability distributions, which can be updated efficiently using the observed evidence. This approach is particularly useful in probabilistic reasoning, where we need to infer the probability distribution of some unobserved variables given some observed evidence.
Applications of Bayesian Networks in AI
Some of the most common applications of Bayesian networks in AI include:
- Prediction and classification: Bayesian belief networks can be used to predict the probability of an event or classify data into different categories based on a set of inputs. This is useful in areas such as fraud detection, medical diagnosis, and image recognition.
- Decision making: Bayesian networks can be used to make decisions based on uncertain or incomplete information. For example, they can be used to determine the optimal route for a delivery truck based on traffic conditions and delivery schedules.
- Risk analysis: Bayesian belief networks can be used to analyze the risks associated with different actions or events. This is useful in areas such as financial planning, insurance, and safety analysis.
- Anomaly detection: Bayesian networks can be used to detect anomalies in data, such as outliers or unusual patterns. This is useful in areas such as cybersecurity, where unusual network traffic may indicate a security breach.
- Natural language processing: Bayesian belief networks can be used to model the probabilistic relationships between words and phrases in natural language, which is useful in applications such as language translation and sentiment analysis.
FAQs
Q. Why are Bayesian Belief networks important in AI?
A. Bayesian networks are important in AI because they allow for probabilistic reasoning and decision-making under uncertainty. They provide a framework for representing and reasoning about uncertain knowledge in a structured and systematic way. Bayesian networks can be used in a wide range of applications such as diagnosis, prediction, decision making, and planning, making them a powerful tool in AI.
Q. What is the difference between Markov networks and Bayesian networks?
A.
- Markov networks and Bayesian networks are both ways of showing how different things are related to each other.
- Markov networks show how things are related to each other in a more general way, without showing which way the relationship goes. Bayesian networks show how things are related to each other in a more specific way, showing which thing affects which other thing.
- Markov networks can have loops or cycles, while Bayesian networks cannot.
- Markov networks are better for showing when things are related to each other in a more equal or balanced way. Bayesian networks are better for showing when one thing has a bigger effect on another thing.
Q. What do Bayesian networks predict?
A. Bayesian networks predict the probability distribution of a set of variables, given the probabilities of their relationships with other variables. In other words, they predict the probability of certain outcomes or events, based on the probability of related factors or conditions.
Q. Why are Bayesian networks acyclic?
A. The fundamental assumption underlying Bayesian networks is that each random variable in the network is conditionally independent of its non-descendants given its parents in the graph. This assumption is often referred to as the "Markov assumption" or the "local independence assumption."
If the Bayesian network were to have cycles, it would violate this assumption because a variable's non-descendants could also be its ancestors, which would make it impossible to determine a variable's true dependence structure based on its parents alone. In other words, cycles would introduce additional dependencies that could not be represented by the graph's existing edges, and this would make it impossible to perform inference or update probabilities in the network using Bayes' rule.
Conclusion
- Bayesian Belief Networks (BBNs) are probabilistic graphical models used to represent uncertain knowledge and make decisions based on that knowledge.
- BBNs have found wide-ranging applications in areas such as healthcare, finance, and environmental management.
- A BBN consists of two main components: the causal component and the numerical component.
- The causal component represents the causal relationships between the variables in the system, while the numerical component provides the actual probabilities used to make predictions and calculate probabilities.
- BBNs have two parts: Directed Acyclic Graph and Table of conditional probabilities.
- The Joint Probability Distribution describes the probability of all possible configurations of the network’s variables.
- BBNs have many applications in machine learning, artificial intelligence, and decision analysis.