Debugging a C Program

Overview
Any application will have issues. How do we understand and solve these issues? The process of finding and fixing issues is called debugging. Heart of debugging lies in understanding the bugs and deciding on the tools for debugging. Print statements or Logging in the code can be added to inspect the values of variables. They are also helpful in understanding the flow of the code. An interactive debugging is extremely helpful as it decreases the effort of adding print statements. Tools like GDB(GNU Debugger) can be used to debug a C code interactively.
Introduction
What is a bug? What is debugging? Let us say you got a requirement to calculate the factorial of a number. Do you see any issues with the below code?
At first glance, the code seems right. But, the function always returns 0 for any n. What do you do to understand why the function is not returning factorial? We can print the value of result and n inside while right. Following is the output after updating the code as below.
Output
After printing the value of result and n, we can find that result is reset to 0 at the last run of the while loop. To fix the while loop condition, we need to check if n > 0.
We can define a bug as an error or a fault in a program because which program does not work the usual way. Debugging can be defined as the process of finding a bug and fixing it.
![]()
This article discusses debugging types and how to debug a C program interactively.
Types of Debugging in C
There are many ways of debugging an issue. It depends on the problem. Majorly, debugging consists of 3 stages:
- Understand in what scenarios the bug in a program is happening
- Inspect the value of variables at different stages of a program
- Figure out if a part of the code is executed or not.
Following are the common ways of debugging a bug in C:
Transform Your Career
Choose from our industry-leading programs designed for career success
Modern Software and AI Engineering Program
Master full-stack development with AI integration

Modern Data Science and ML with specialisation in AI
Advanced data science techniques with AI specialization
Advanced AIML with Specialisation in Agentic AI
Deep dive into AIML with focus on Agentic systems
DevOps, Cloud & AI Platform Engineering
Build and manage AI-powered cloud infrastructure
AI Engineering Advanced Certification by IIT-Roorkee
Premier AI engineering certification from IIT-Roorkee
Print statements
We can use print statements like printf as discussed in the introduction section, to figure out the value of variables. But, this process can be risky as we may forget to remove the print statements after debugging an issue. Print statements in the code will be printed to an application's console.
Scaler Placement Report and Statistics
Scaler learners achieved 2.5x salary growth with average post-Scaler CTC reaching ₹23L.
Logging
The console of an application would not be accessible every time. For example, we can not access the console to view print statements in a production environment. Logging can be used in these cases. Using logging, we can configure whether print statements in the code are written to a file or printed to the console. This is the significant difference between logging and print statements.
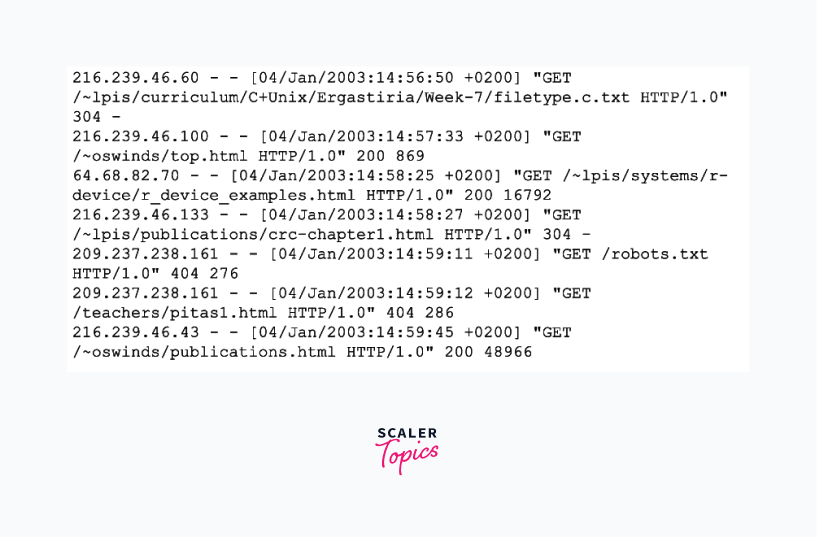
Logging is a common way of debugging any application. The following image shows a snippet of logs for reference.
Interactive debugger
Technologies like C, C++, and many high-level languages support an interactive way of debugging. The interactive way means we can pause program execution and spectate variables. Breakpoints are the lines where the program will pause during execution. This way, we need not add too many print statements to debug and remove them after debugging.
This method significantly reduces the effort of debugging as we need to start the debugger and place breakpoints to debug. The following image shows a snapshot of the Xcode interactive debugger. Xcode is an IDE(Integrated Development Environment) developed by Apple.

Let us see various steps that can be followed to debug a C program using GDB(GNU Debugger), which is an interactive debugger tool.
Steps for Interactively Debugging a C Program
This article assumes GCC(GNU Compiler Collection) and GDB(GNU Debugger) is already installed in the system. GCC is a compiler for C language that can be used to compile C code. It creates an executable after compiling that can be executed directly. GDB is a debugger that can debug code in many languages like C, C++, Objective-C, etc.
Tutorial for installing GDB can found here.
Do you see any issues with the below code where we compute a sum of integers to a number?
The above code gives Segmentation fault when run. Let us go through the reason for the same.
Turn Learning into Career Growth
Compile a C program with debugging option
C is a compiled language, meaning a C program should be first compiled, generating an executable that can be run for execution. The compiler takes care of checking the syntax errors in the code.
To debug the code via GDB, we need to tell the compiler to collect the debugging information in the executable. This is important to view code while debugging.
The below command can compile with debugging option. -g specifies debugging option. -o specifies the output executable file which will be created after compiling. gcc -g test.c -o test
Launch GDB
Once the above command is executed, an executable test will be created. GDB can be launched with the below command to debug test gdb test
Set up a breakpoint inside C
As defined earlier, a breakpoint is a point where the program pauses the execution. list can be used to print the code so we can associate the line number to the code. b can be used to set a breakpoint in GDB. For example, b 7 command sets a breakpoint at line 7.
For debugging the above program, I am setting breakpoints at lines no 9, 10, and 17. In line 9, I want to print sum and i to check if they are causing the issue. In line 10, I want to check if execution reached line 10 to rule out function sum_to_n from the list of suspects. In line 17, I want to check if line 16 was the reason for Segmentation fault.
Execute the C program in the GDB debugger
Once all breakpoints are set, it's time to run the program and debug. run can be used to trigger the execution.
Scaler Placement Report and Statistics
Scaler learners achieved 2.5x salary growth with average post-Scaler CTC reaching ₹23L.
Print the variable inside the GDB debugger
GDB pauses the execution when a breakpoint is hit. p <variable name> can be used to print the value of a variable.
To continue the execution after debugging at a breakpoint, we can do one of the following:
- Use s, which moves the execution to the immediate next step and pauses there.
- Use c, which moves the execution to the next breakpoint or the end of the program.
Demo
The following GIF image outlines the debugging process discussed till now. As the return sum breakpoint is hit, we can rule out function sum_to_n from the list of suspects. As segmentation fault occurred before line 17, we can figure out that line 16 is the issue. The only thing remaining in line 16 after invoking the sum_to_n function is to populate buf variable. This helped us understand that buf was not initialized and assigned. That is the reason for Segmentation fault.

A list of GDB commands can be found here.
Summary
- Following are common commands/ shortcuts of GDB: - l - list code - p - print a variable - c - continue - s - step
- Code should be compiled with debugging option enabled so it can be debugged interactively.
- The method of debugging depends on the bug. Following are some examples:
- logging would be the way to debug production bugs/ intermittent bugs.
- An interactive debugging tool can be helpful if the system is available for live debugging.
- This article is a starting point on how to use GDB(GNU debugger) to debug C code.