Inferential Statistics-2 with Excel
Overview
Dive into Excel's enchanting world of statistical analysis, where the Chi-Square and F Distributions rule supreme. Unleash the power of these magnificent tools by invoking the CHISQ.DIST and F.DIST functions. Together, they unveil insights into categorical data relationships and variance comparison, unraveling the mysteries behind hypothesis testing.
In this statistical odyssey, sail through the seas of independence tests and goodness-of-fit, guided by the CHISQ.DIST function's mystical charm. Simultaneously, harness the F.DIST's formidable prowess to compare variances, illuminating the path to sound decision-making.
Embrace Excel's statistical sorcery and unlock the secrets of Chi-Square and F Distributions to embark on a thrilling adventure in data analysis.
What is the F Distribution Function?
The F Distribution Function, also known as the F-distribution or Fisher-Snedecor distribution, is a continuous probability distribution that frequently arises in statistical hypothesis testing and analysis of variance (ANOVA). It plays a crucial role in comparing the variances of two independent samples to determine if they are significantly different.
The F Distribution Function is characterized by degrees of freedom for the numerator (df1) and degrees of freedom for the denominator (df2). The shape of the F-distribution depends on these parameters, and it is positively skewed, with the degree of skewness reducing as the degrees of freedom increase.
In Excel, you can use the F.DIST function to calculate the F-distribution's probability density function (PDF) or the cumulative distribution function (CDF). The syntax for the function is:
=F.DIST(x, df1, df2, cumulative)
Where:
- x: is the value at which the function is evaluated
- df1: is the degrees of freedom for the numerator
- df2: is the degrees of freedom for the denominator
- cumulative: is a logical value (TRUE or FALSE) indicating whether to return the CDF (TRUE) or the PDF (FALSE)
F Distribution Formula
The F-distribution, named after Ronald A. Fisher and George W. Snedecor, is a fundamental statistical distribution, particularly when analyzing the variances between two independent populations. The F-distribution is employed in various tests, including the Analysis of Variance (ANOVA), regression analysis, and the comparison of nested models.
The F-distribution is characterized by two non-negative integer parameters: degrees of freedom for the numerator (v1) and degrees of freedom for the denominator (v2). These parameters influence the shape and properties of the distribution. The F-distribution formula, which represents the probability density function (PDF), is given as:
Where:
- x: is a positive real value
- v1 and v2: are the degrees of freedom for the numerator and denominator, respectively
- Γ(z): represents the gamma function, which extends the concept of the factorial function to non-integer values.
The F-distribution is right-skewed and non-negative, with most of its mass concentrated near the value of 1. As the degrees of freedom increase, the distribution becomes less skewed and approaches a normal distribution. The F-distribution is applied in hypothesis testing to determine whether the variances of two populations are equal and in the construction of confidence intervals for the ratio of variances.
In addition to the PDF, the F-distribution has a cumulative distribution function (CDF), which represents the probability that a random variable from the F-distribution is less than or equal to a given value. The CDF can be used to determine critical values and p-values in hypothesis testing.
How to use the F Distribution Function in Excel?
In Excel, the F Distribution Function can calculate the probability density function (PDF) or the cumulative distribution function (CDF) of the F distribution. Excel provides two main functions for this purpose: F.DIST and F.DIST.RT.
F.DIST: This function calculates the PDF or CDF of the F-distribution. The syntax for the function is:
=F.DIST(x, df1, df2, cumulative)
Where:
- x: The value at which the function is evaluated
- df1: The degrees of freedom for the numerator
- df2: The degrees of freedom for the denominator
- cumulative: A logical value (TRUE or FALSE) indicating whether to return the CDF (TRUE) or the PDF (FALSE)
F.DIST.RT: This function calculates the right-tailed probability or the complement of the CDF (1 - CDF) of the F-distribution. The syntax for the function is:
=F.DIST.RT(x, df1, df2)
Where:
- x: The value at which the function is evaluated
- df1: The degrees of freedom for the numerator
- df2: The degrees of freedom for the denominator
Here's an example of using the F Distribution Function in Excel:
Suppose you want to calculate the right-tailed probability of an F-statistic of 3.5 with 5 degrees of freedom for the numerator and 10 degrees for the denominator. You would use the F.DIST.RT function like this:
=F.DIST.RT(3.5, 5, 10)
The resulting value would represent the F-distribution's right-tailed probability (p-value) with the given F-statistic and degrees of freedom.
What is Chi-square Distribution?
The Chi-square distribution, denoted as KaTeX parse error: Expected 'EOF', got '²' at position 2: χ²̲, is a continuous probability distribution widely used in statistical hypothesis testing and estimation. It arises naturally in scenarios involving the sum of independent squared standard normal random variables. The Chi-square distribution plays a significant role in various statistical tests, such as the chi-square test for independence, the chi-square goodness-of-fit test, and the estimation of confidence intervals for a population variance when the population is normally distributed.
The Chi-square distribution is characterized by a single parameter: degrees of freedom (k), a positive integer. The distribution's shape depends on the degrees of freedom, with the distribution becoming less skewed and more symmetric as the degrees of freedom increase.
The probability density function (PDF) of the Chi-square distribution is given by:
Where:
- x is a non-negative real value
- k is the degree of freedom
- Γ(z) represents the gamma function, which generalizes the factorial function to non-integer values
- e is the base of the natural logarithm, approximately equal to 2.71828
The Chi-square distribution is always non-negative and right-skewed. It is often used in hypothesis testing to assess the goodness-of-fit of observed data to expected frequencies or to test the independence between categorical variables in a contingency table.
The Characteristics of the Chi-Square Test
The Chi-square test is a widely-used non-parametric statistical test to analyze categorical data. For example, it helps to determine if there is a significant association or relationship between two categorical variables or to assess the goodness-of-fit of observed data to expected frequencies based on a null hypothesis. Some key characteristics of the Chi-square test include:
-
Categorical data: The Chi-square test is specifically designed for categorical data, i.e., data that can be organized into categories or groups. It cannot be used for continuous data.
-
Independence: The Chi-square test examines the independence or association between two categorical variables. It assesses if the observed frequencies in the contingency table are due to chance or if there is a genuine relationship between the variables.
-
Null hypothesis: The null hypothesis for the Chi-square test states no significant association exists between the categorical variables being tested. The alternative hypothesis, on the other hand, posits that there is a significant association.
-
Observed and expected frequencies: The test compares the observed frequencies in each contingency table cell with the expected frequencies that would occur if the null hypothesis were true (i.e., the variables are independent).
-
Right-skewed distribution: The Chi-square distribution is right-skewed and non-negative. The skewness decreases as the degrees of freedom increase, making the distribution more symmetric.
-
Degrees of freedom: The degrees of freedom for the Chi-square test depends on the dimensions of the contingency table. For an r x c table, the degrees of freedom are given by (r - 1) x (c - 1), where r and c are the numbers of rows and columns, respectively.
-
Large sample size: The Chi-square test relies on large sample sizes for accurate results. Small samples may yield inaccurate or unreliable results, and the test may need to be revised.
-
No assumptions about population parameters:, Unlike many other statistical tests, the Chi-square test does not require assumptions about population parameters, such as means or variances. It is a non-parametric test, making it suitable for various applications.
-
Limitations: The Chi-square test assumes that each observation is independent and that the categories are mutually exclusive. Moreover, it may not be suitable for very small sample sizes or cases where the expected frequencies in some cells are too low (usually less than 5). In such instances, alternative tests like Fisher's exact test may be more appropriate.
How to Perform the Chi-Square Test in Excel?
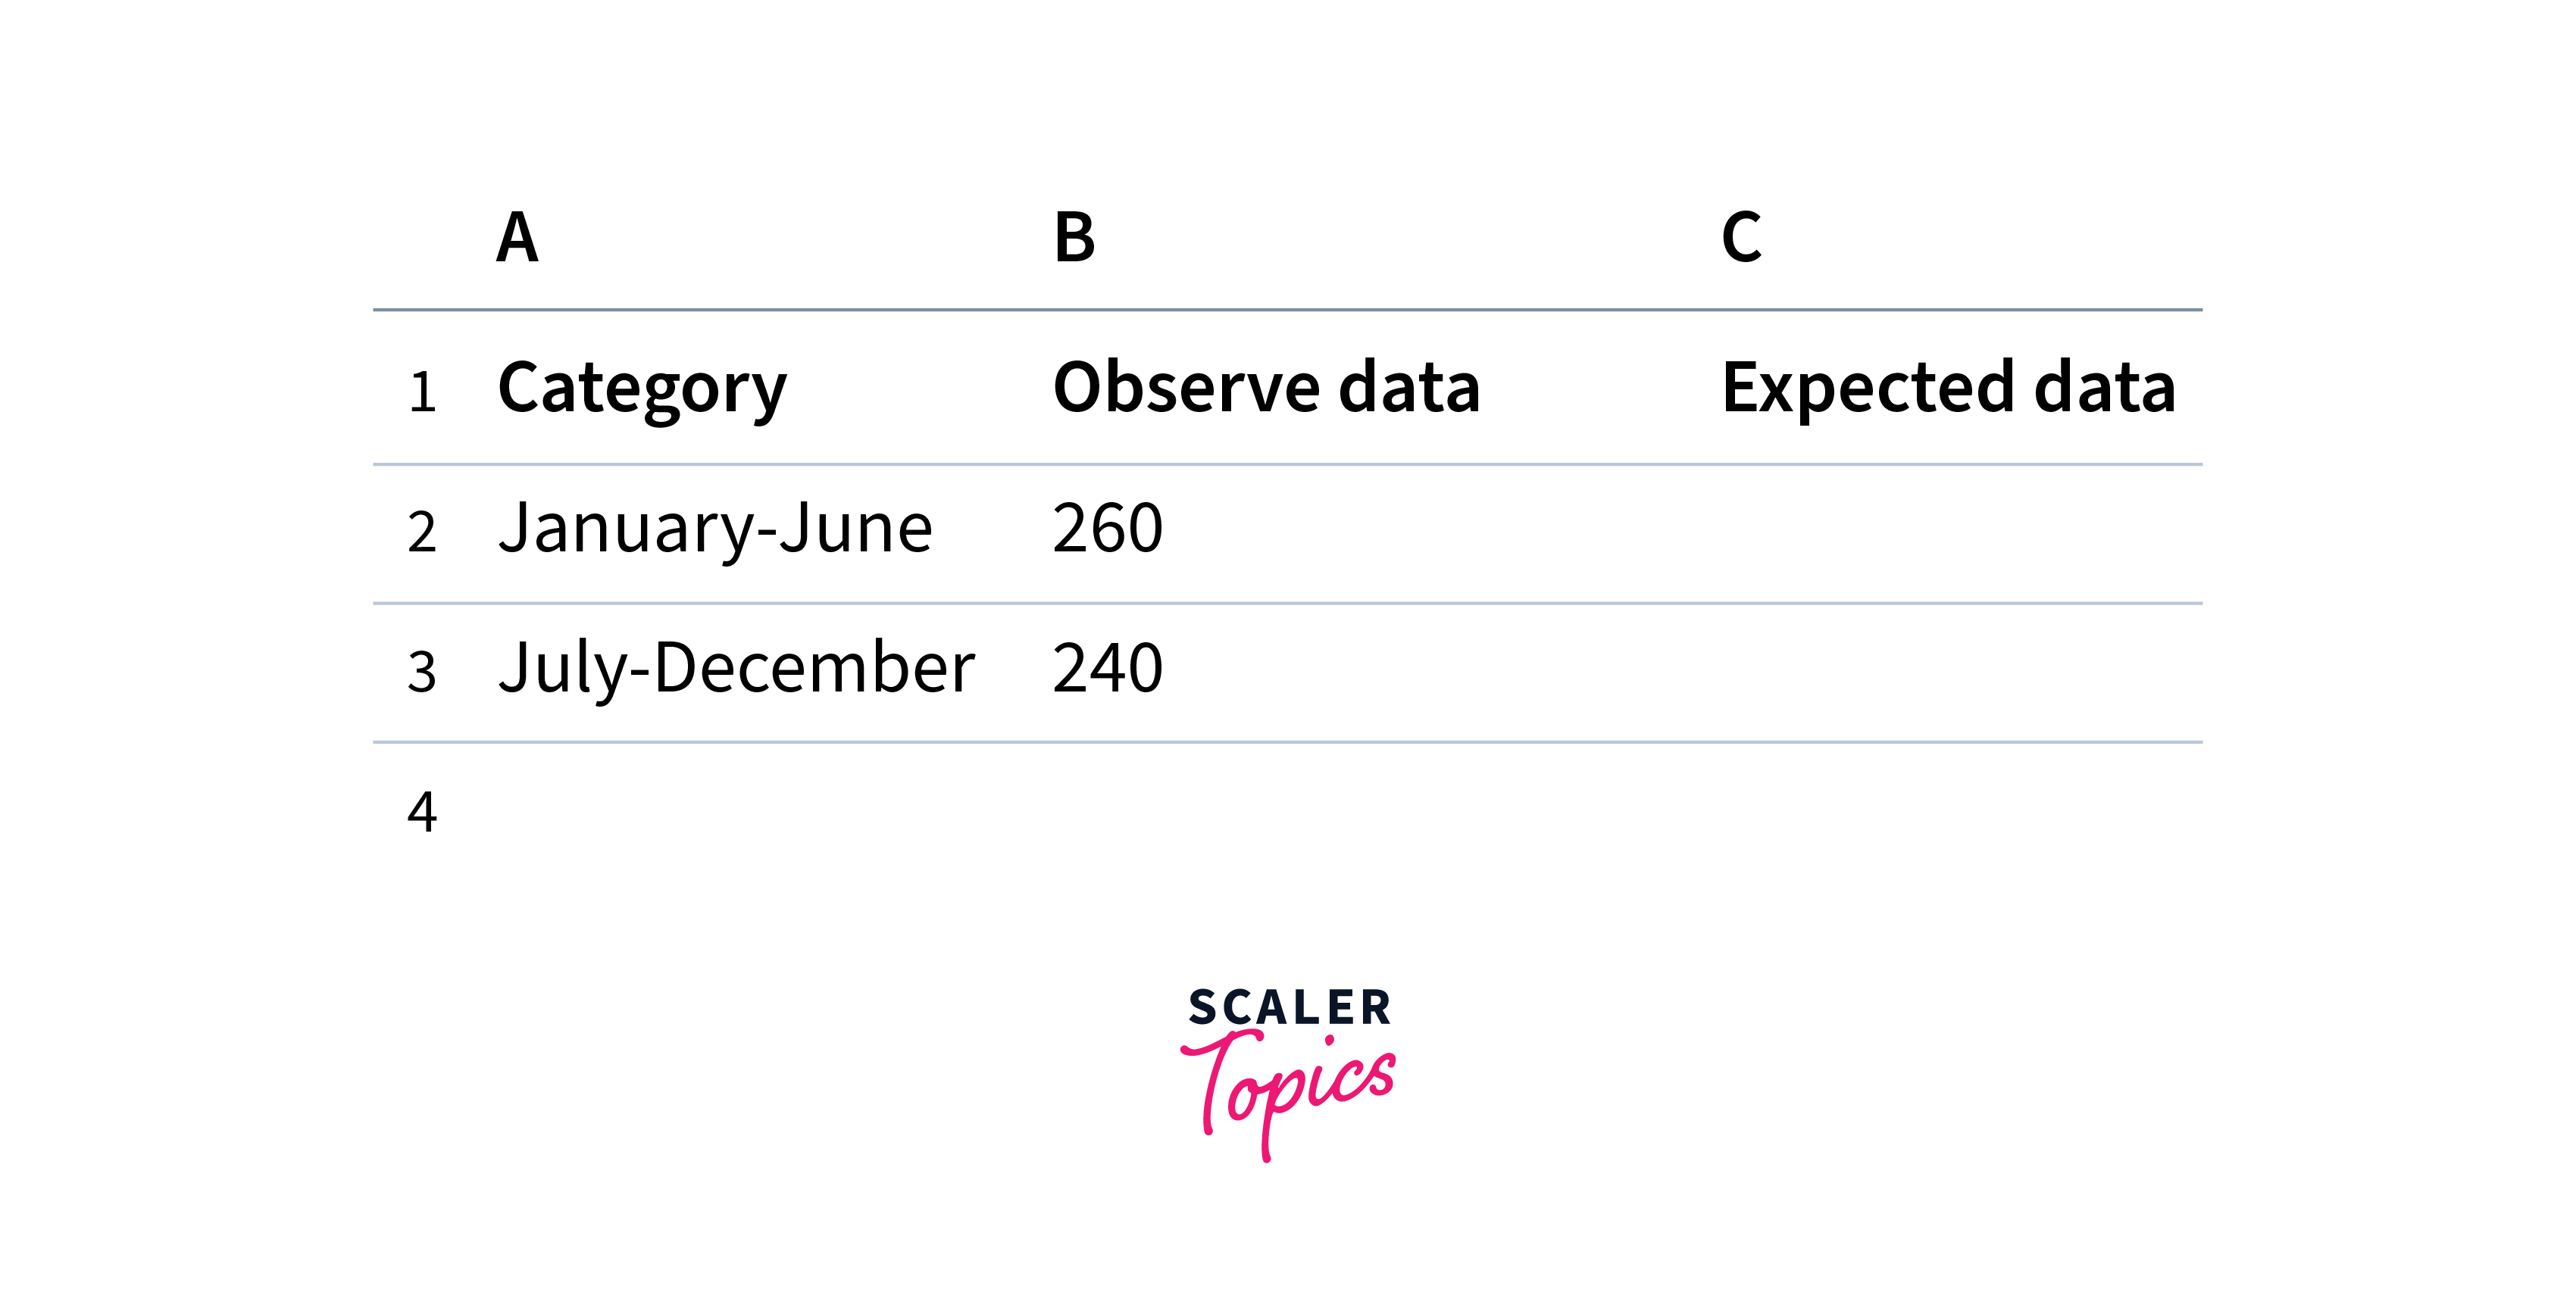
Set up four columns: Create a new Excel worksheet and set up four columns with the following headers: "Category," "Hypothesized Proportion," "Observed Data," and "Expected Data."
Input data:
Fill in the "Category" column with the different categories being compared. Next, enter the hypothesized proportions for each category in the "Hypothesized Proportion" column. Finally, input each category's observed data (frequencies) in the "Observed Data" column.
Calculate the Expected Data:
In the "Expected Data" column, multiply the hypothesized proportion by the total number of observations (sum of the "Observed Data" column) for each category. Use the formula =B2*SUM(2:[last_row]), where B2 is the cell containing the hypothesized proportion for the first category, and C2 to C[last_row] represents the range of cells containing the observed data. Copy this formula down for all categories.
Calculate the Chi-square Statistic
In a new cell, calculate the Chi-square statistic using the formula =SUM((C2
Determine the Degrees of Freedom
In another cell, calculate the degrees of freedom using the formula =COUNT(C2
Calculate the p-value
In a new cell, calculate the p-value using the CHISQ.DIST.RT function: =CHISQ.DIST.RT(chi_square_stat, degrees_of_freedom), where chi_square_stat is the cell containing the calculated Chi-square statistic, and degrees_of_freedom is the cell containing the degrees of freedom.
Compare the p-value to the Alpha
Determine the test's significance level (alpha), typically set at 0.05 or 0.01. Compare the calculated p-value to the chosen alpha value. If the p-value is less than or equal to alpha, reject the null hypothesis, concluding that there is a significant difference between the observed data and the hypothesized proportions. If the p-value is greater than alpha, fail to reject the null hypothesis, indicating no significant difference between the observed data and the hypothesized proportions.
Conclusion
-
The F-distribution and Chi-square distribution are essential statistical tools for hypothesis testing and data analysis. The F-distribution focuses on comparing variances between two independent samples. At the same time, the Chi-square distribution is primarily used for analyzing categorical data and testing the independence between two categorical variables.
-
Excel provides built-in functions like F.DIST and F.DIST.RT, and CHISQ.DIST.RT for working with the F-distribution and Chi-square distribution. These functions allow users to calculate the probability density function (PDF), cumulative distribution function (CDF), and right-tailed probabilities for hypothesis testing.
-
The Chi-square test is a non-parametric statistical test for categorical data analysis. It is used to assess the goodness-of-fit of observed data to expected frequencies and to test the independence between categorical variables in a contingency table.
-
Performing a Chi-square test in Excel involves setting up columns for categories, hypothesized proportions, observed data, and expected data, followed by calculating the Chi-square statistic, degrees of freedom, and p-value. Comparing the p-value to a chosen significance level (alpha) helps determine whether to reject or fail to reject the null hypothesis.
-
Both the F-distribution and Chi-square distribution play crucial roles in various statistical applications, such as analysis of variance (ANOVA), regression analysis, and testing of nested models. Understanding these distributions and their applications in Excel enables more robust data analysis, hypothesis testing, and decision-making in research and real-world scenarios.