JavaScript Sources Tab

Overview
The sources tab within the chrome dev tools can be referred to as a one-stop for things like javascript debugging in chrome, inspecting the resources of the website we are accessing, adding breakpoints, etc.
The Sources tab in chrome aids us to set breakpoints and evaluate expressions in Javascript whether that Javascript was loaded from a separate file or as part of the page.
Viewing Files
The Page section within the sources tab can be used to have a view of all the files and folders that have been loaded by the webpage we are browsing. This helps us in javascript debugging in chrome. These documents get loaded during the runtime.
Following is the pictorial representation of the page tab:

The organization of the Page pane is as follows:
- The topmost level i.e. top is used to represent the main document frame. It is present on the top of every webpage on the web representing the HTML frame. These frames are used to divide your browser window into multiple sections where each section can load a separate HTML document
- The second level is used to represent the origin of the webpage. Like in this case the origin of the webpage is www.scaler.com.
- The third level, fourth level, and fifth level and further are used to represent the resources or folders that have been loaded from the origin. For example, in the given figure we have been provided with the full path to the google analytics web source at this level.
The content of a file can be viewed by clicking on the file and the content will be displayed in the Editor Pane. The Editor pane is used to edit CSS and JavaScript. DevTools updates the page to run our new code. For example, if we want to edit the background-color of an element, we'll see that change take effect immediately once the files in this page are edited.

Editing CSS and JavaScript
The sources tab can be used to make changes in the CSS and Javascript of the website we are using. This can be done by editing the required files in the Editor Pane of the Sources tab. The changes done in CSS and Javascript within the sources tab will only reflect on our local window or tab i.e. the changes we do here do not affect the original code of the website. Upon refreshing the browser window, the original form of the website and the files and their contents will restore.
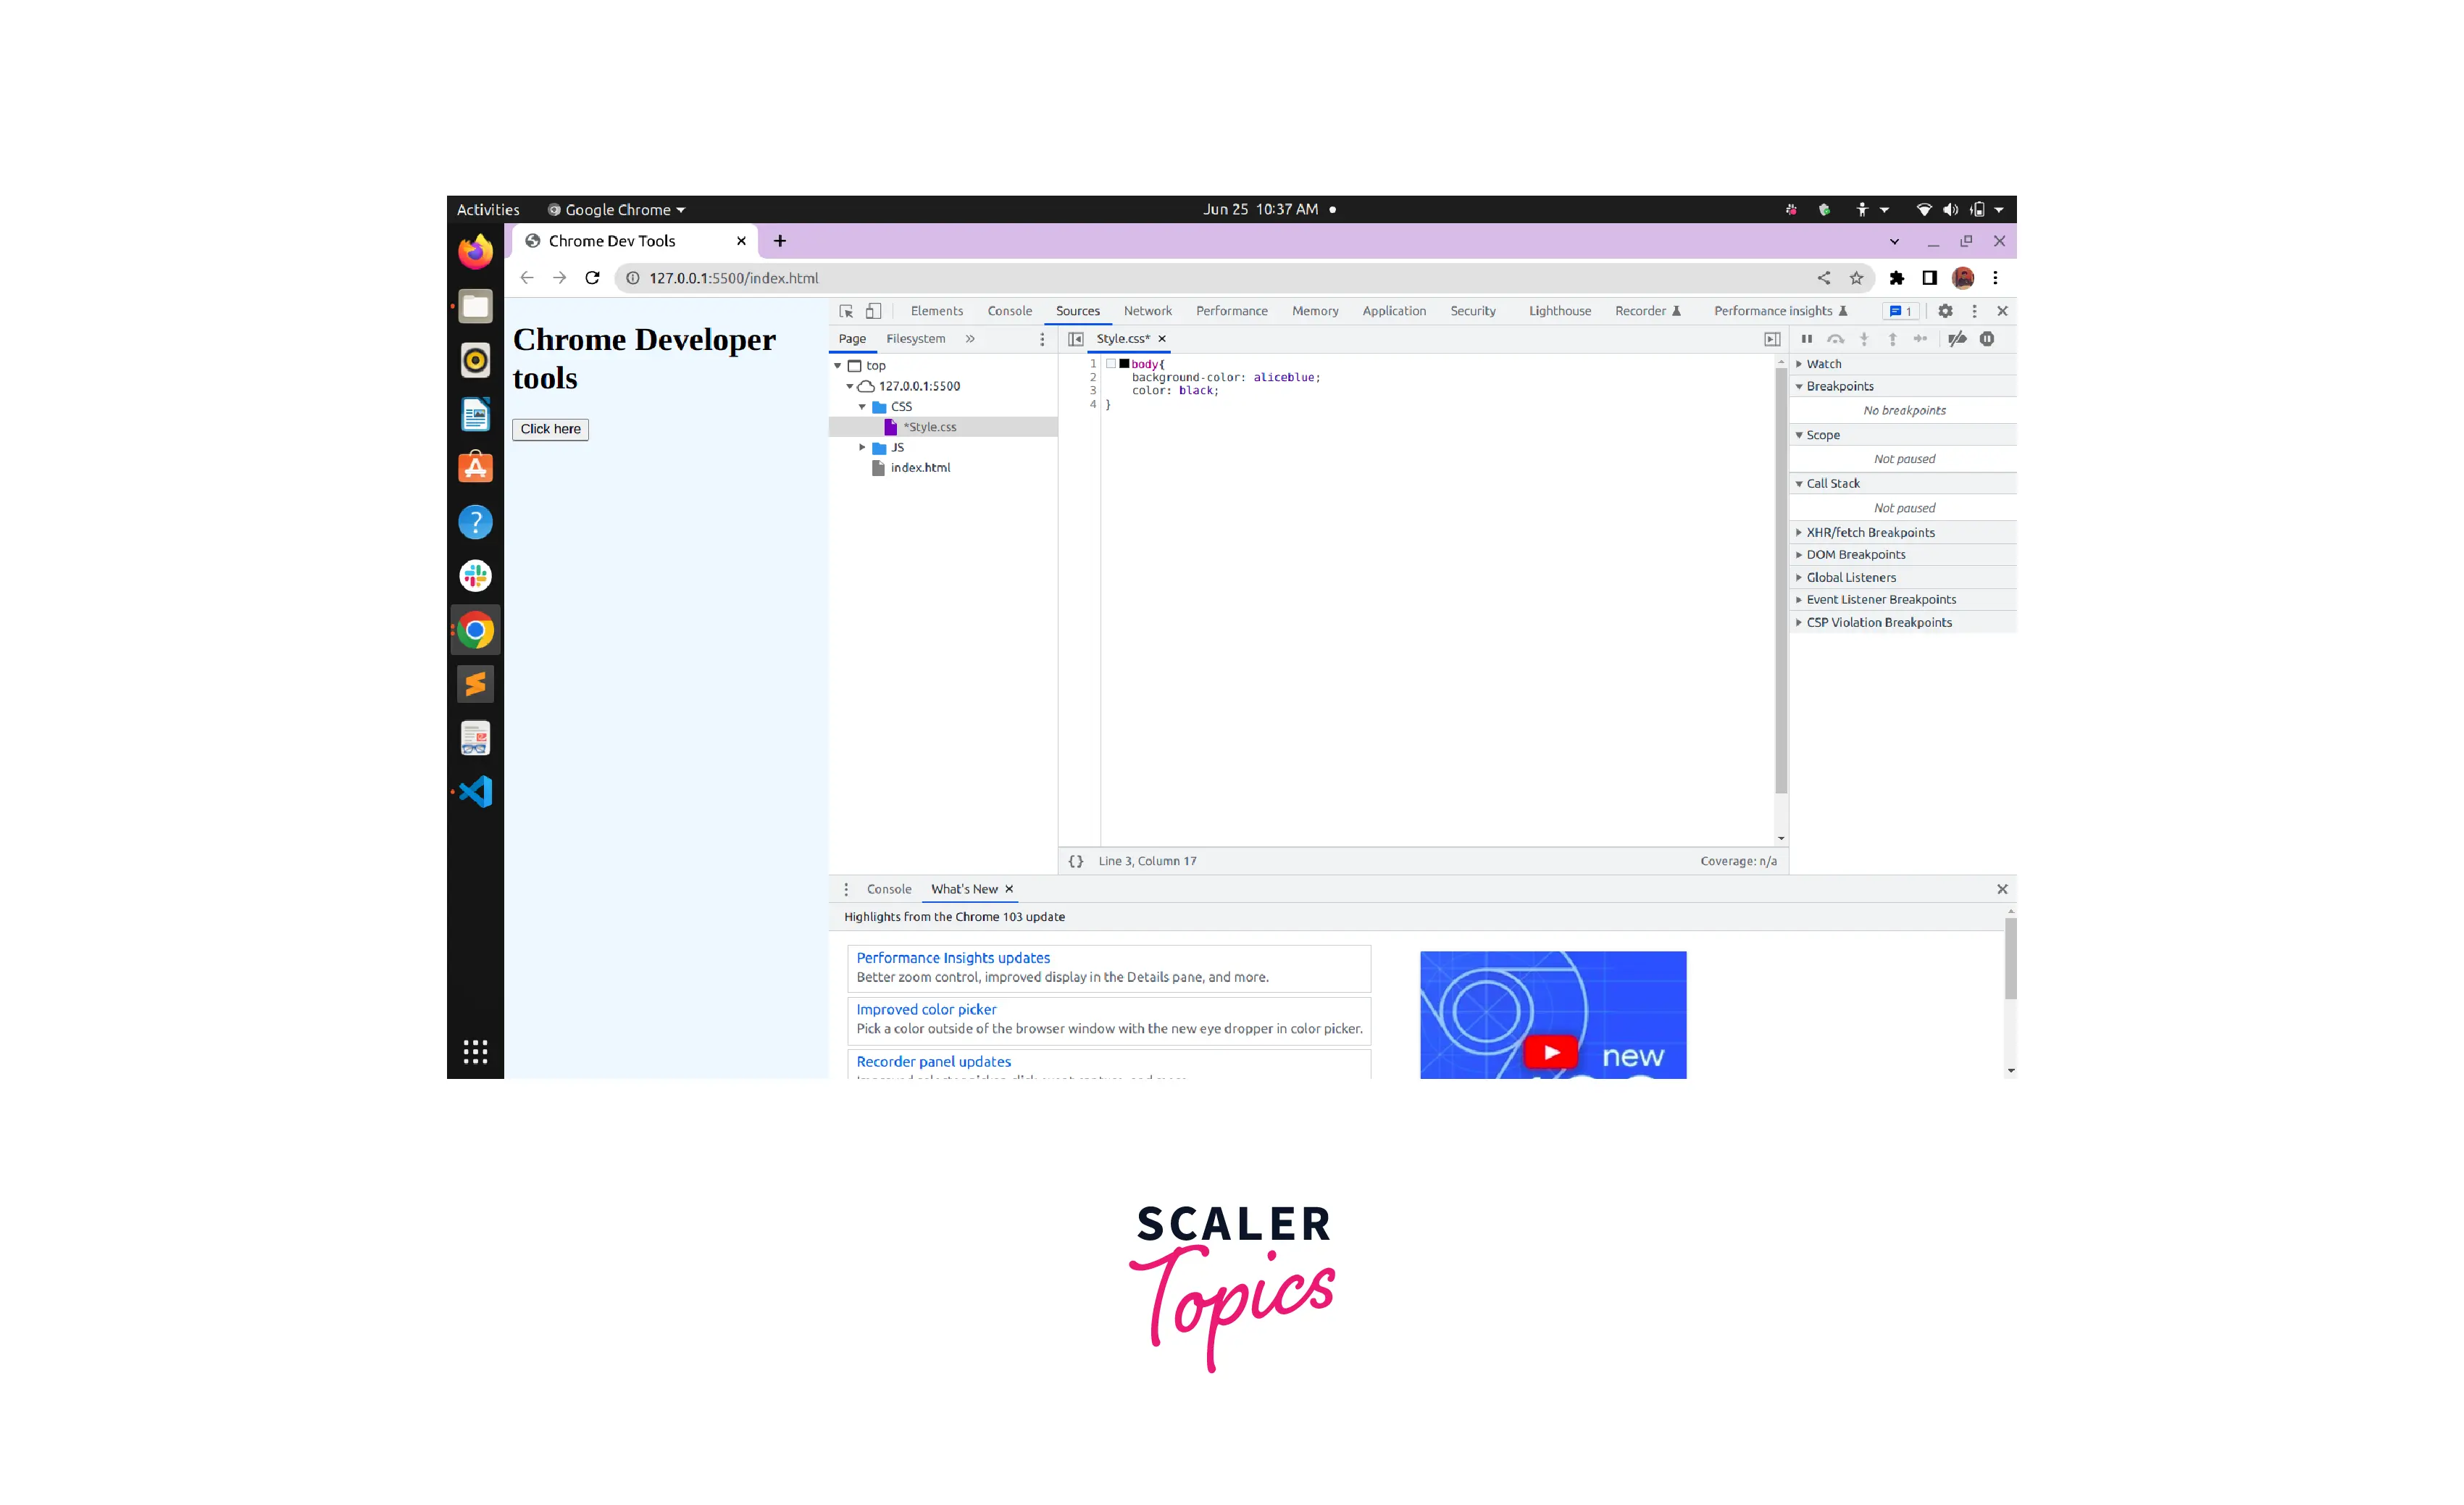
Editing CSS:
Suppose we are viewing the CSS of the following website in the Editor Pane and we want to change the color of the font.

To do this we will edit the color within the body and change it to black. Thus the font color of the website will change immediately.
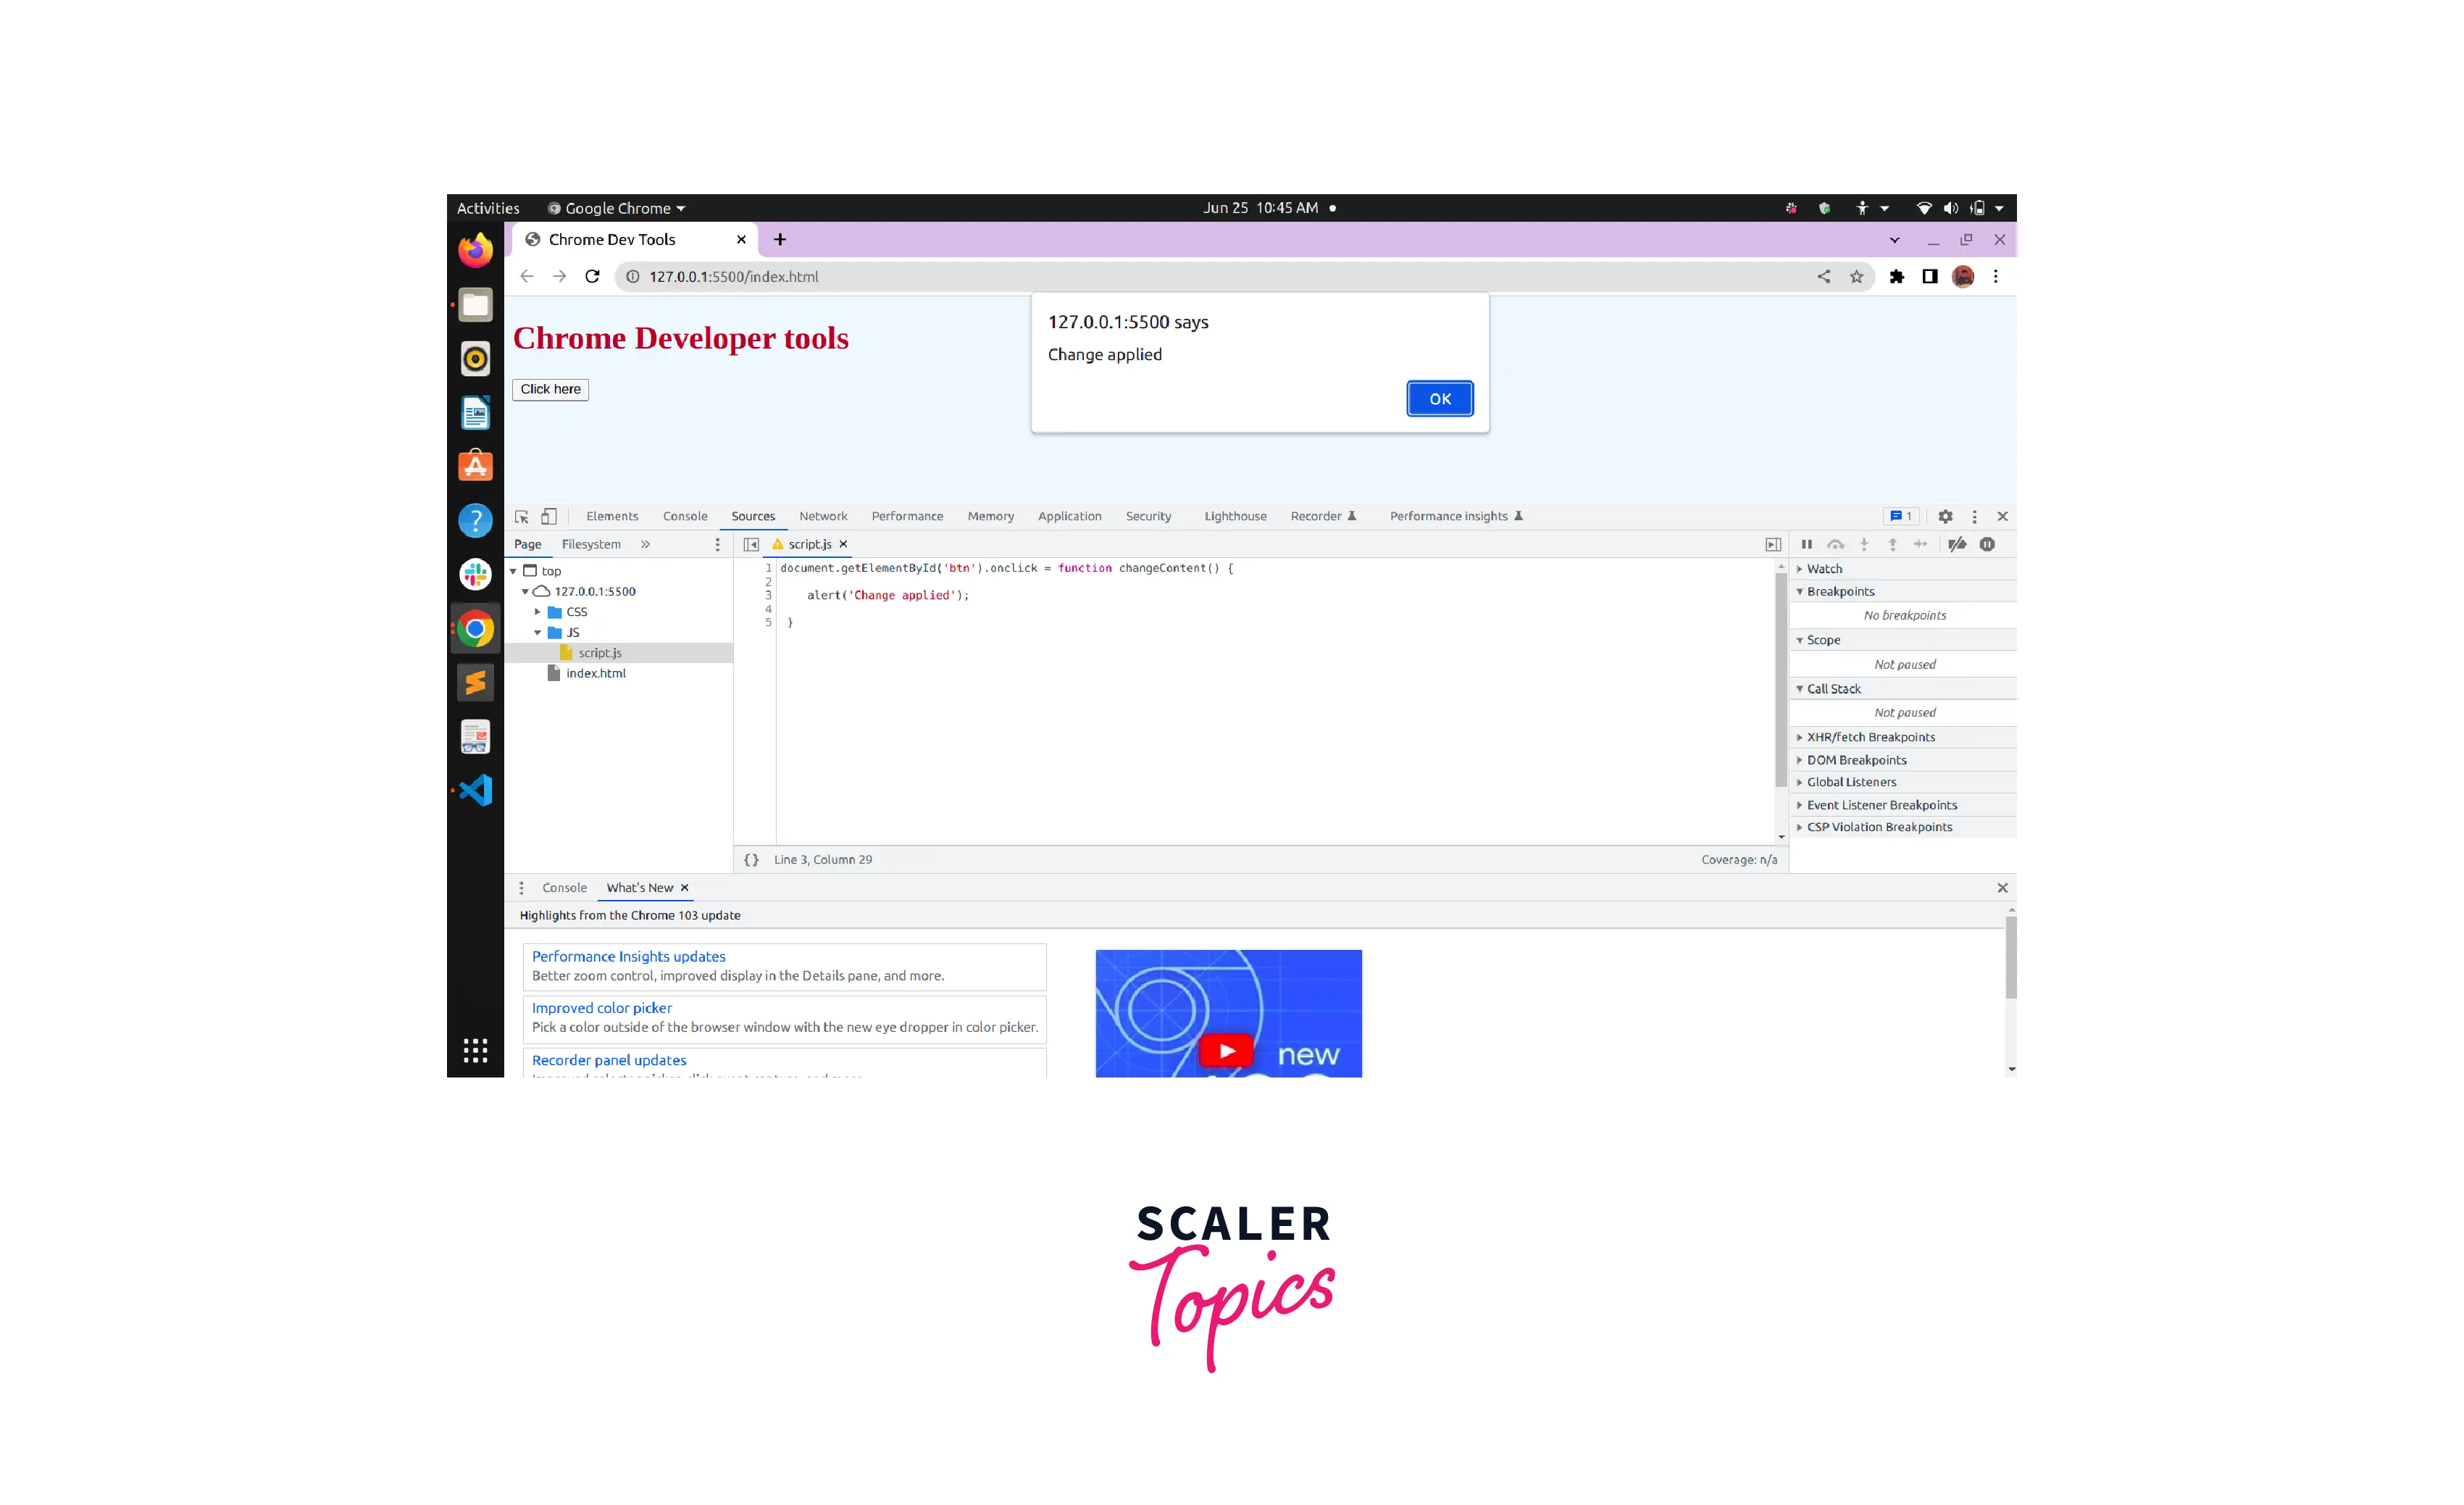
Editing Javascript:
One of the most important features of javascript debugging in chrome is editing javascript. Now, Suppose we are viewing the Javascript of the following website in the Editor Pane and we want to change the display statement upon the button click.

To do this we will edit the alert('Button has been clicked!') within the changeContent function and change it to alert('Change applied'). Then we will save the changes and the change will be applied.
Note: We can observe that we did not have to save the changes done in the CSS file but we have to save the changes done in the Javascript file. This is because the CSS changes take effect immediately without any need to save but in the case of JavaScript changes take effect only after the code has been saved. Thus for javascript one needs to press Command+S (Mac) or Control+S (Windows, Linux). DevTools doesn't re-run a script, so the only JavaScript changes that take effect are those that we make inside of functions.
Creating and Saving Snippets of JavaScript
A Code Snippet is a programming term that refers to a small portion of reusable source code, machine code, or text. Snippets help programmers reduce the time it takes to type in repetitive information while coding.
Creating snippets through command menu:
- We need to point our cursor somewhere within the DevTools.
- Then we need to press Control+Shift+P or Command+Shift+P (Mac) to access the command menu.
- Then by typing Snippets and selecting Create new snippet, and then pressing enter we can create snippets.
Creating snippets through mouse:
- First, we need to open the snippets pane.
- Then we need to click on the New snippet option.
- Then we need to enter the snippet's name that we want to provide to our snippet and then press enter to create and save our snippet.
Opening the snippets through the command menu:
- We need to point our cursor somewhere within the DevTools.
- Then we need to press Control+Shift+P or Command+Shift+P (Mac) to access the command menu.
- Then by typing Snippets and selecting Show Snippets, and then pressing enter we can access snippets.
Opening snippets in the Javascript sources tab with mouse:
- First, we need to click on the sources tab to open the Sources panel. The page pane usually is opened by default.
- Then we need to click the Snippets tab to open the Snippets pane. You might need to click More Tabs to access the Snippets option.
Debugging JavaScript
A very common way to debug Javascript is by using the console.log(). In this method of javascript debugging in chrome, log methods are set in code which monitors the execution of code at that point and prints the statement in the console. This is a good method for debugging small programs but is slightly inefficient.
Rather than using console.log() to infer where your JavaScript is going wrong, consider using the Chrome DevTools debugging tools, instead. The general idea is to set a breakpoint, which is an intentional stopping place in your code, and then step through your code's execution, one line at a time. As you step through the code, you can view and change the values of all currently-defined properties and variables, run JavaScript in the Console, and more.
In this article, we will go through processes on how to debug javascript using the sources tab.
Setting Up a Workspace
As discussed earlier, when a file is edited within the Source panel the changes are temporary and disappear once the webpage is reloaded. Although we can use workspaces to save the changes that have been made by us in the DevTools to our file system. Workspaces enable you to save a change that you make in Devtools to a local copy of the same file on your computer. Thus it aids us to use the DevTools are our code editor.
Steps to set the workspace:
- Step 1: Open the required webpage in the tab.
- Step 2: Go to the sources tab.
- Step 3: Open the filesystem tab.
- Step 4: click on the Add Folder To Workspace.
- Step 5: Select the desired folder.
Source Level Breakpoints
The Javascript source tab lets us set the breakpoints within the Javascript with which we can evaluate our javascript file expressions i.e. we can check if the javascript file has been loaded from some other section of the webpage or a separate file. A source-level debugger is a tool that is typically used for controlling execution, setting breakpoints, and manipulating a runtime state.

The Call Stack
The call stack is a list of all the active functions that have been called to get to the current point of execution. The call stack includes an entry for each function call, as well as which line of code will be returned to when the function returns. It is a mechanism for an interpreter to keep track of its place in a script that calls multiple functions — what function is currently being run and what functions are called from within that function, etc.
The call stack can be viewed in the rightmost panel:

Event Listener Breakpoints
In the above section, we have seen how to add and analyze the breakpoints in the Javascript code. But what if we want to pause code that runs after an event such as button click etc?
In such cases, the event listener breakpoints come in handy. Upon expanding the event listener breakpoint header present on the left bottom of the debugger we can find a list of actions categorized according to the Javascript client-side events.

Pause on Exceptions
The chrome dev tools provide us the feature to pause automatically upon any exception. To do that we need to enable the Pause on exceptions within the Sources Panel. This particularly helps in pausing for uncaught exceptions although we can pause on caught exceptions as well.
This means the debugger will pause before that red message appears in the Console and you get a chance to inspect what may have gone wrong.
Watch Expressions
A watch expression refers to an expression that can be defined such that it can be monitored within the watch window. The watch expressions that have been listed by us appear within the watch window from where their values can be observed. This happens when our application goes into break mode.
To use watch expression in chrome we need to do the following:
- First of all, we need to open our console.
- Then we need to click on the create live expression option to create a live expression.
- Then we can type down our expressions within the text box.
- After that, we need to click enter to save the expression.
Breakpoints
A breakpoint is a location in executable code at which the operating system stops execution and breaks into the debugger. This allows you to analyze the target and issue debugger commands. There are two main types of breakpoints available within the sources tab:
- DOM Breakpoints
- XHR Breakpoints
Breakpoints are useful especially while testing large and complex programs. By setting a breakpoint in a program, we allow the program to run up to the breakpoint, and then we can examine or modify the values of various registers and variables.
DOM Breakpoints
The DOM breakpoints are used to deal with events such as the removal of a node or the modification or changing of an attribute. We can use the DOM breakpoint tab in the sources tab to look at all the DOM mutation events.
XHR Breakpoints
The XHR breakpoints are used in instances when the provided server request URL consists of a certain value. To put an XHR breakpoint, we need to press the + button and specify the value for the breakpoints to break on within the sources tab.
Async Call Stack
The async call stack allows us to inspect the function calls by tracing them beyond the present event loop. This helps in examining the scope of previous frames that have been executed and no longer are present in the event loop. This helps us in dealing with function calls in the background or the ones bounded with async, await, etc.
Once you enable the async call stack feature in DevTools, you will be able to drill into the state of your web app at various points in time. Walk the full stack trace for some event listeners, setInterval, setTimeout, XMLHttpRequest, promises, requestAnimationFrame, MutationObservers, and more.
Minification and Source Maps
The feature of sources maps is provided in the source tab that aids us to debug the Javascript code that has been transpired, according to their source language such as ES6 or Typescript, etc.
The source map can be enabled in Google Chrome by going to the Chrome developer tools and then by pressing the small cog icon, and after that checking the Enable Javascript source maps.
Conclusion
- The sources tab in chrome can be used for javascript debugging in chrome.
- The sources tab can be found within chrome dev tools.
- The sources tab in chrome lets us add breakpoints in the code.
- The sources tab in chrome provides minification and source maps that aid us to debug the Javascript code that has been transpired, according to their source language such as ES6 or Typescript, etc.
- The sources tab in chrome provides an async call stack that allows us to inspect the function calls by tracing them beyond the present event loop.