Clustering in R Programming
Overview
Clustering, in the context of data analysis, refers to the process of grouping similar data points together based on their intrinsic properties. The primary goal of clustering is to uncover structures within the data that might not be apparent initially. These structures can provide valuable insights for decision-making, pattern recognition, and understanding complex datasets. R, known for its statistical prowess, offers a wide array of libraries and functions to facilitate various clustering techniques. In this article, we will delve into the world of clustering in R, exploring its types, applications, methods, and specific clustering algorithms like K-Means, Agglomerative Hierarchical Clustering, and Clustering by Similarity Aggregation.
Types of Clustering in R
In R programming, various types of clustering algorithms are available to group data points based on similarity or other criteria. Each type of clustering has its own approach and assumptions. Here is a list of some common types of clustering in R:
- K-Means Clustering: K-means clustering is a popular unsupervised machine learning algorithm used for partitioning a set of data points into distinct groups or clusters. The algorithm aims to assign each data point to the cluster whose center (centroid) is closest to that data point. It's a simple and effective method for grouping similar data points together based on their features.
- Agglomerative Hierarchical Clustering: This type of clustering builds a hierarchy of clusters by iteratively merging smaller clusters into larger ones. It begins with each data point as a separate cluster and then gradually combines clusters based on their similarity, forming a tree-like structure called a dendrogram.
- Divisive Hierarchical Clustering: In contrast to agglomerative clustering, divisive hierarchical clustering starts with all data points in one cluster and recursively divides them into smaller clusters based on similarity until each point forms its own cluster.
- Density-Based Spatial Clustering of Applications with Noise (DBSCAN): DBSCAN identifies clusters as regions of high data point density separated by areas of lower density. It can discover clusters of arbitrary shapes and is robust to noise.
- Model-Based Clustering: This approach assumes that the data is generated by a mixture of probability distributions. Model-based clustering algorithms estimate the parameters of these distributions to group data points into clusters.
- Fuzzy Clustering: Unlike hard clustering, where data points belong exclusively to one cluster, fuzzy clustering assigns membership values to data points, indicating their degree of belongingness to multiple clusters.
- Self-Organizing Maps (SOM): SOM is a neural network-based clustering method that reduces the dimensionality of data while preserving its topological properties. It creates a low-dimensional representation of data, often displayed as a grid of nodes.
- Affinity Propagation: Affinity propagation assigns data points to clusters by passing messages between pairs of data points. It doesn't require specifying the number of clusters beforehand and can find exemplars that represent each cluster.
Applications of Clustering in R
In R programming, various clustering algorithms can be employed to uncover patterns, relationships, and insights within datasets. Here are some notable applications of clustering in R:
- Customer Segmentation: Clustering is extensively used in marketing to segment customers based on their purchasing behavior, preferences, and demographics. This enables businesses to tailor their marketing strategies for different customer groups and improve customer satisfaction.
- Genomics and Bioinformatics: Clustering plays a crucial role in genomics and bioinformatics by grouping similar genes, proteins, or biological sequences. This aids researchers in understanding genetic relationships, identifying disease markers, and predicting protein structures.
- Image Segmentation: In image processing, clustering is applied to segment images into regions with similar characteristics. This assists in object recognition, image compression, and computer vision tasks.
- Anomaly Detection: Clustering can be used to detect anomalies or outliers in datasets. Unusual data points that do not fit within any cluster can be identified, making it useful for fraud detection, fault diagnosis, and quality control.
- Document Clustering: Clustering is employed in natural language processing to group similar documents or textual data. This aids in topic modeling, information retrieval, and text summarization.
- Social Network Analysis: Clustering helps uncover communities or groups within social networks. By identifying clusters of connected nodes, researchers gain insights into network dynamics, influence propagation, and user behavior.
- Medical Diagnostics: Clustering aids in medical diagnostics by grouping patients with similar clinical profiles or genetic markers. It can contribute to disease classification, treatment recommendation, and patient outcome prediction.
- Financial Analysis: Clustering is used in finance to segment stocks or financial instruments based on market behavior, risk factors, or performance. It assists in portfolio optimization and risk management.
- Machine Learning Preprocessing: Clustering can be used as a preprocessing step to reduce the dimensionality of data or to identify groups for subsequent machine learning tasks such as classification or regression.
Methods of Clustering in R
Clustering methods in R can be broadly categorized into two main types: hard clustering and soft clustering. These methods aim to group similar data points together based on certain criteria. Lets deep dive into both the methods-
Hard Clustering
Hard clustering is a type of clustering where each data point is assigned to exactly one cluster. The assignment is based on a specific criterion, such as minimizing the distance between data points and cluster centers.
Characteristics
- Each data point belongs to a single, exclusive cluster.
- Clusters are non-overlapping and distinct.
- Data points are assigned to the cluster with the closest similarity or proximity.
Examples of Hard Clustering Methods in R
- K-Means Clustering: Partitions data points into a predefined number of clusters by minimizing the sum of squared distances between data points and cluster centroids.
- Partitioning Around Medoids (PAM): Similar to K-Means, but uses medoids (data points) as cluster representatives instead of centroids.
Soft Clustering
Soft clustering is a type of clustering where each data point is assigned membership values to multiple clusters, indicating the degree of similarity or affinity to each cluster.
Characteristics
- Data points can belong to multiple clusters to varying degrees.
- Membership values represent the degree of association between data points and clusters.
- Clusters may overlap, and data points can have partial memberships.
Examples of Soft Clustering Methods in R
- Fuzzy C-Means Clustering: Assigns each data point membership values for multiple clusters, reflecting the degree of similarity.
- Gaussian Mixture Models (GMM): Assumes data points are generated from a mixture of Gaussian distributions, estimating probabilities of data point membership in each cluster.
K-Means Clustering in R Programming
K-Means Clustering is a widely used and effective method for partitioning a dataset into a predetermined number of clusters. It groups data points based on their similarity to the centroid of each cluster. In R programming, you can perform K-Means Clustering using the built-in functions and packages. Let's walk through the process of performing K-Means Clustering in R:
K-Means Clustering Algorithm
- Choose the number of clusters, K.
- Initialize K cluster centroids randomly (or using a specific initialization method).
- Assign each data point to the nearest centroid, forming K initial clusters. This is known as the Assignment Step.
- For each data point, calculate the distance to each centroid.
- Recalculate the centroids of each cluster as the mean of the data points assigned to that cluster. This is known as the Update Step
- Iterate between the Assignment Step and the Update Step until convergence is reached.
- Convergence can be determined by monitoring changes in cluster assignments or centroids.
- The algorithm terminates when the cluster assignments no longer change significantly or after a predefined number of iterations.
Output
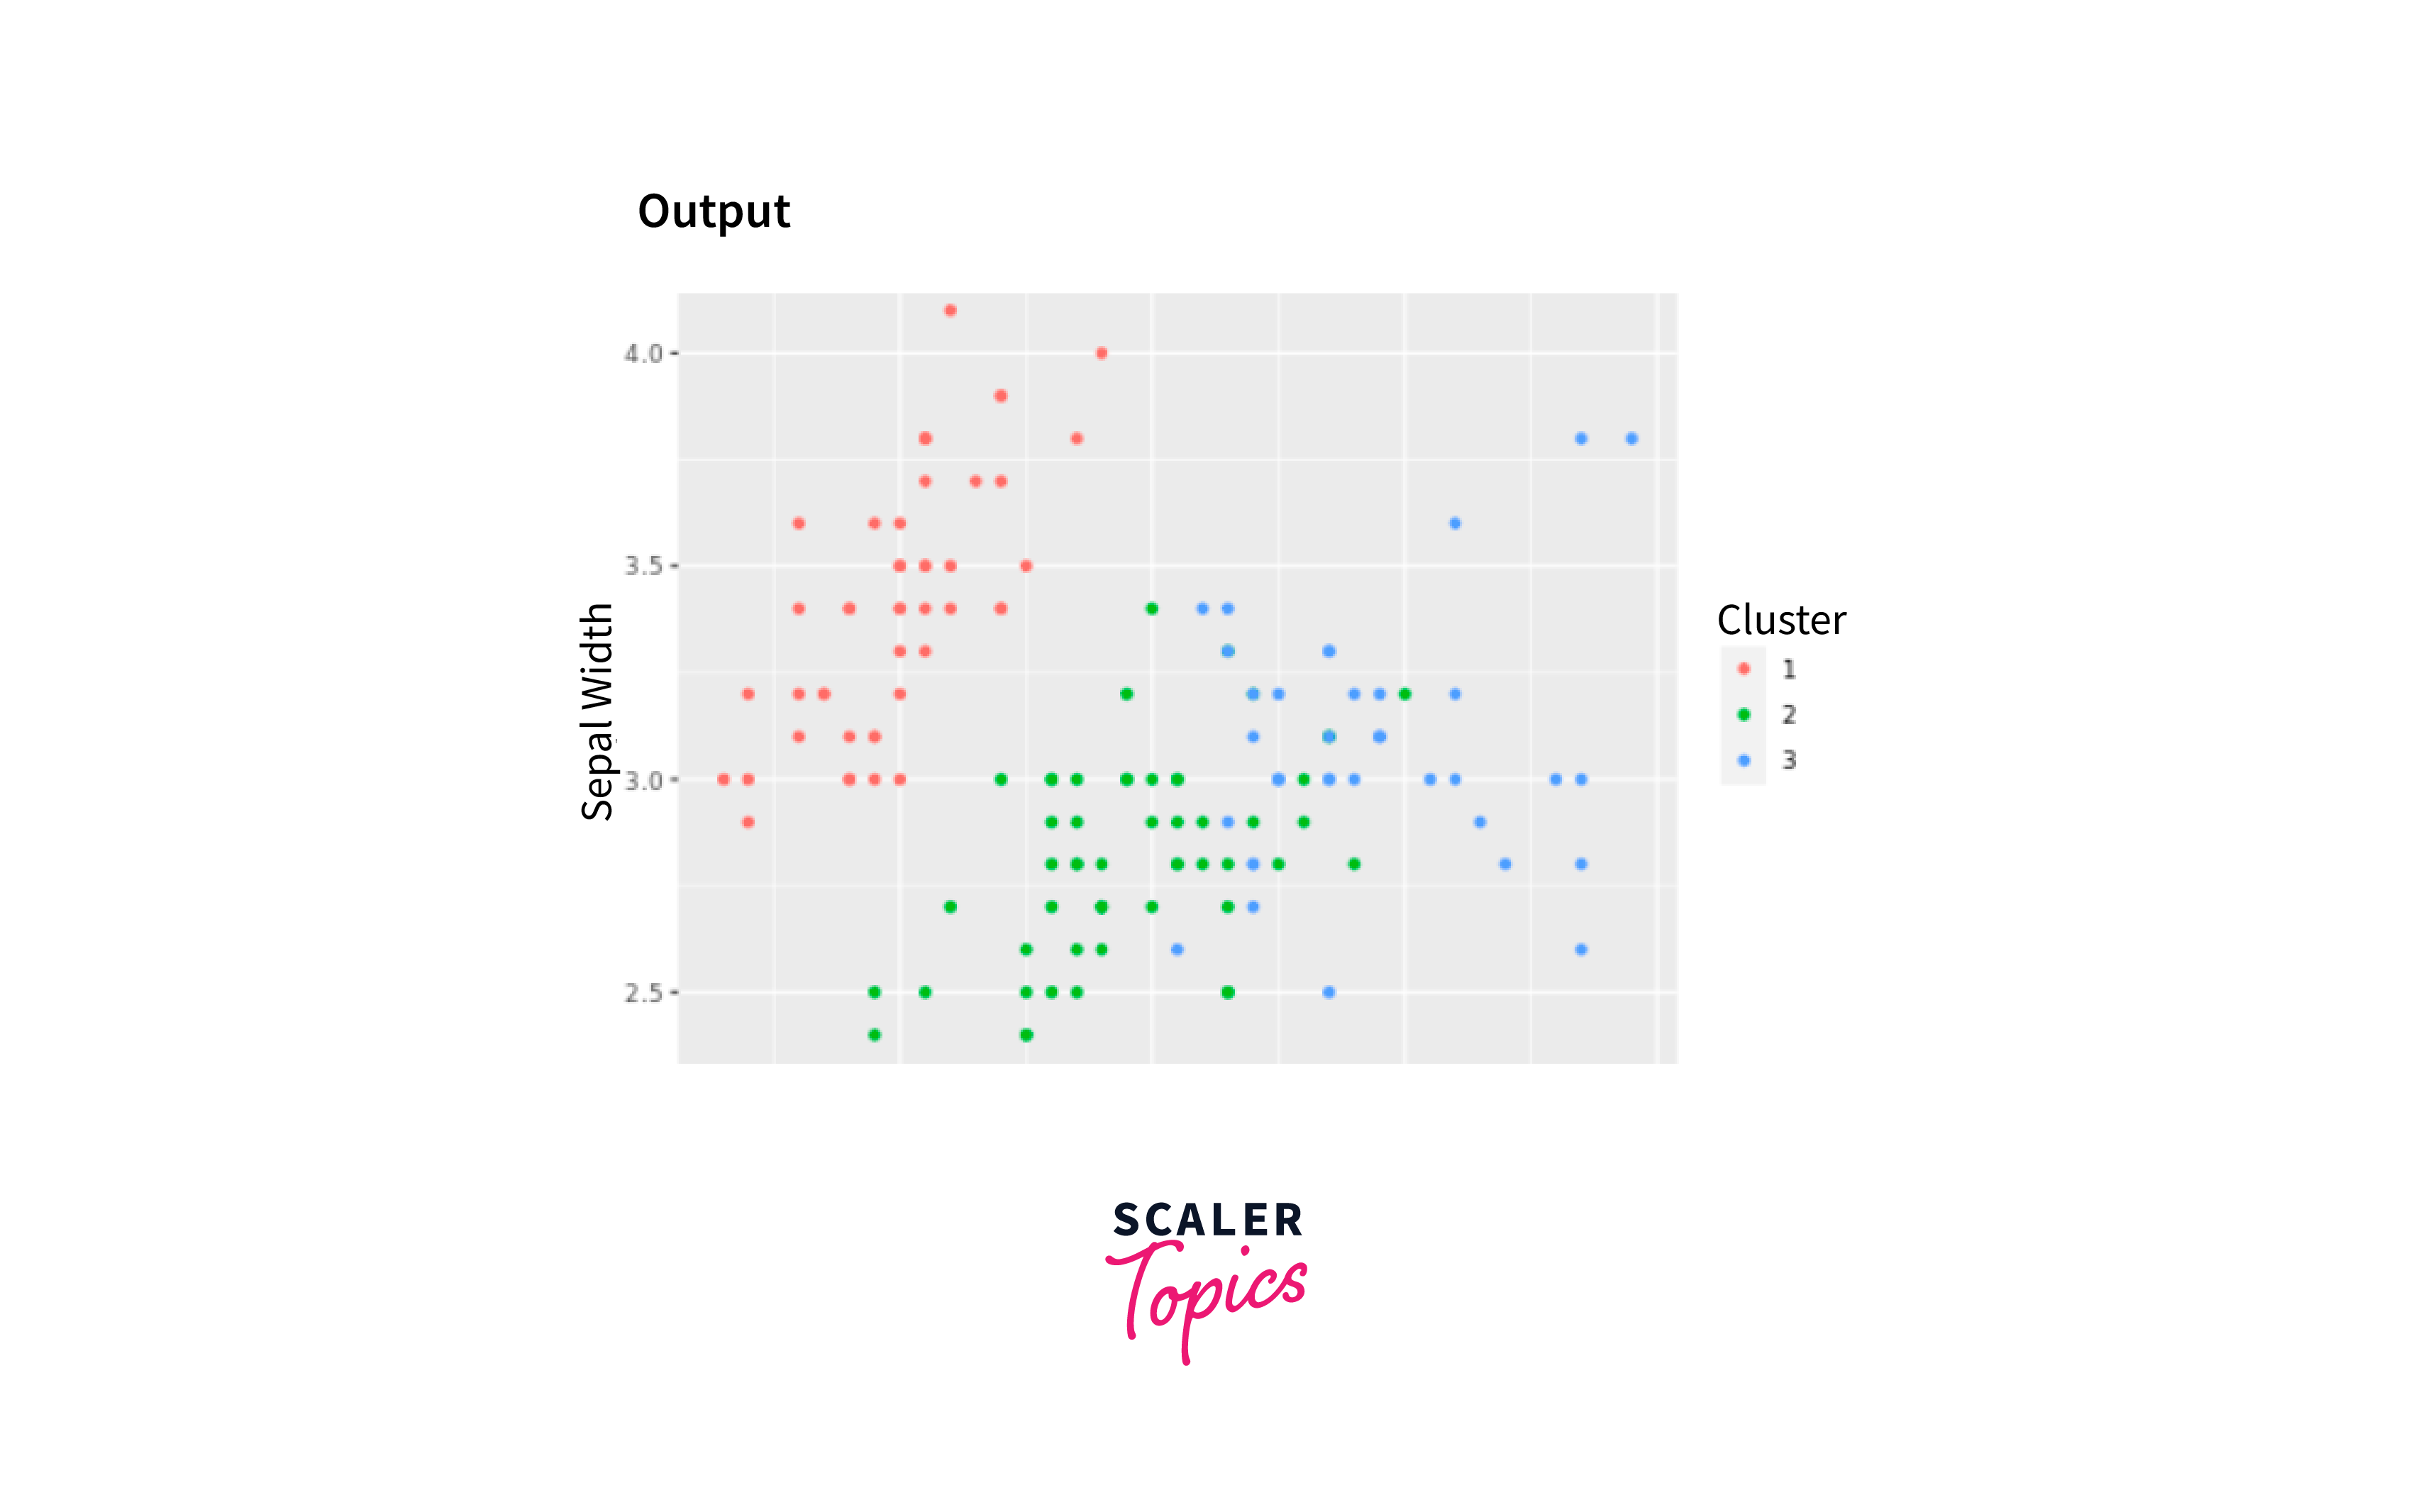
In this code, we load the "cluster" library, prepare the data using the iris dataset, choose the number of clusters (K), perform K-Means Clustering, analyze the results, and visualize the clusters using ggplot2.
Agglomerative Hierarchical Clustering
Agglomerative Hierarchical Clustering is a method of clustering that builds a hierarchy of clusters by iteratively merging smaller clusters into larger ones. This approach starts with each data point as a separate cluster and gradually combines clusters based on their similarity. The result is often represented as a dendrogram, which visually displays the clustering process and the relationships between clusters. Agglomerative Hierarchical Clustering is widely used for exploratory data analysis and visualization.
Algorithm Steps
- Initialization: Treat each data point as an individual cluster.
- Compute Pairwise Distances/Similarities: Calculate the distance or similarity between all pairs of data points (e.g., Euclidean distance, cosine similarity).
- Merge Closest Clusters: Identify the two closest clusters based on the computed distances/similarities and merge them into a single cluster. Update the distance/similarity matrix accordingly.
- Update Distance Matrix: Recalculate the distances/similarities between the merged cluster and the remaining clusters.
- Repeat Merging: Iteratively repeat steps 3 and 4 until all data points belong to a single cluster or until a stopping criterion is met.
- Dendrogram Creation: The clustering process can be visualized as a dendrogram, which represents the hierarchy of cluster mergers. The height at which clusters merge indicates the similarity between them.
Output
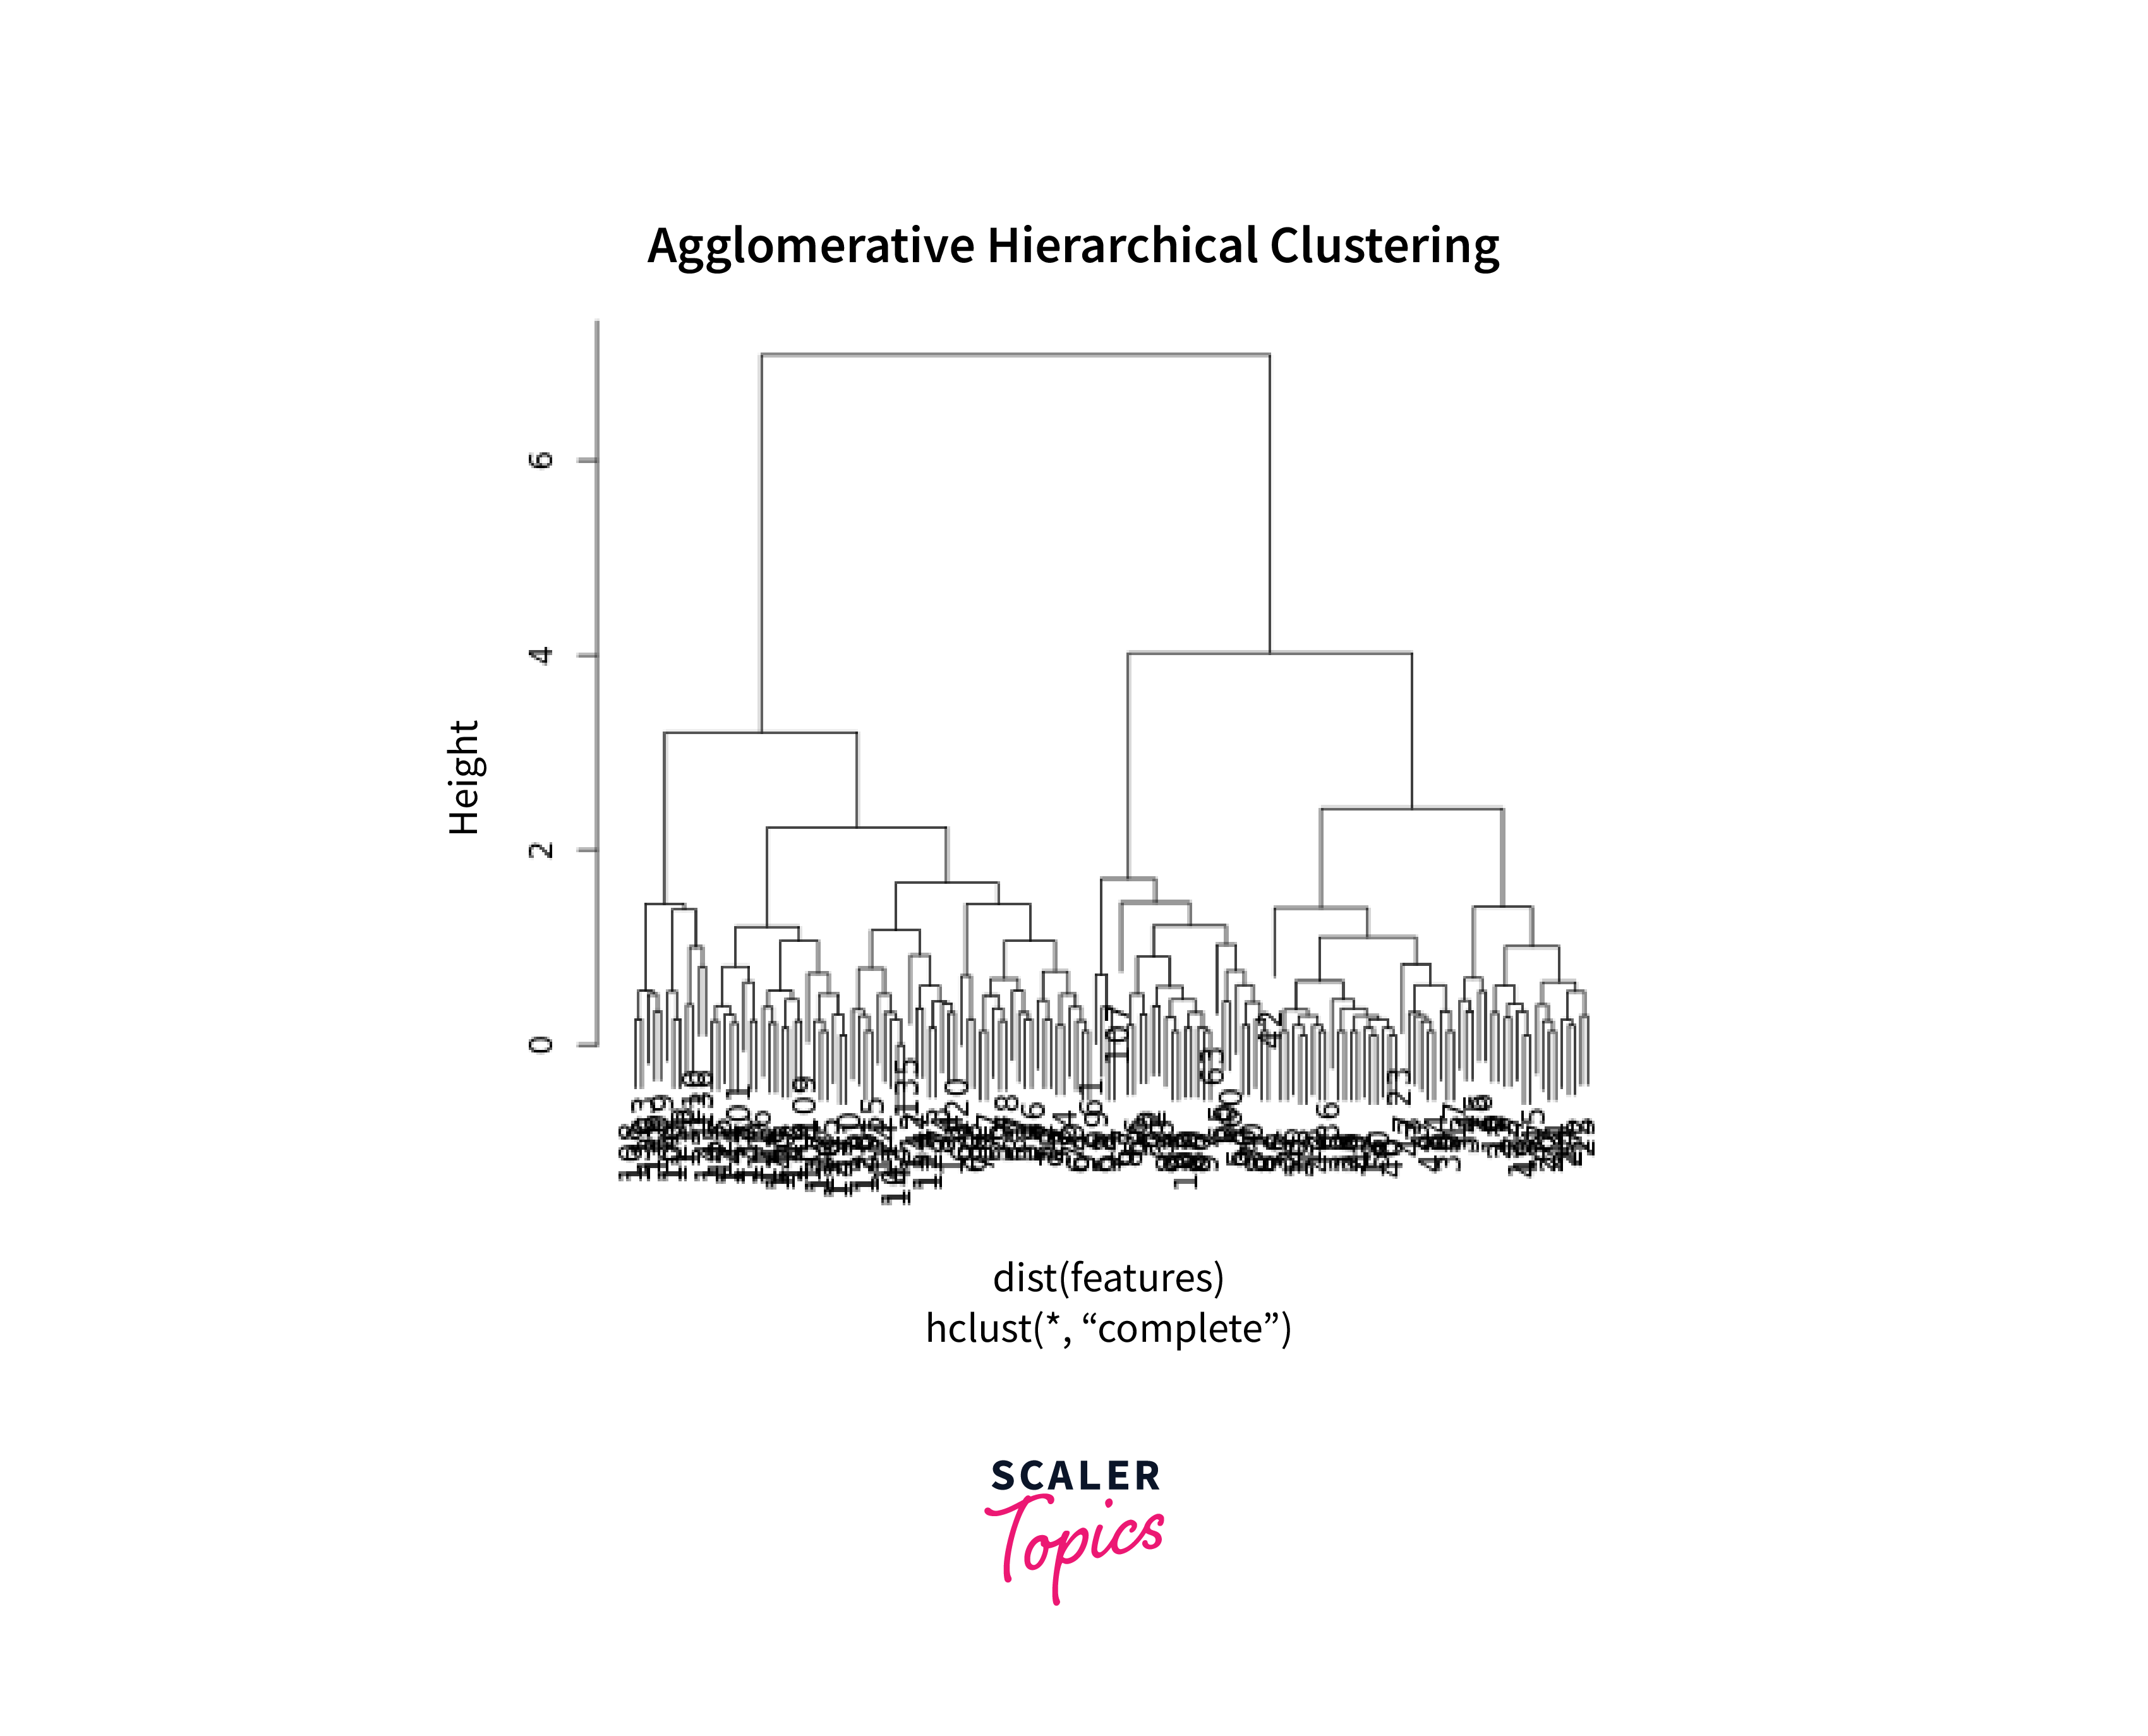
In this code, we use the hclust() function from the cluster library to perform Agglomerative Hierarchical Clustering. The dist() function calculates pairwise Euclidean distances between data points. The resulting dendrogram provides insights into the hierarchy of clusters and helps in determining the number of clusters to extract.
Clustering by Similarity Aggregation
This method involves clustering data points based on a combination of similarity and dissimilarity information. The process includes the following steps:
- Pairwise Comparison: For each pair of data points (A, B), a comparison is made to determine their similarity and dissimilarity. These comparisons are stored in two vectors: m(A, B) for similarity and d(A, B) for dissimilarity.
- Aggregation: The similarity and dissimilarity vectors for all pairs of data points are aggregated in a way that captures both shared similarity and distinct dissimilarity information.
- Clustering: The aggregated similarity and dissimilarity information is used to perform a clustering algorithm, which groups data points based on their combined similarity and dissimilarity relationships.
Conclusion
- Clustering is the process of grouping similar data points to discover patterns and structures.
- Types of clustering in R include partitioning, hierarchical, density-based, model-based, and fuzzy clustering.
- Clustering finds applications in customer segmentation, genomics, image segmentation, anomaly detection, document clustering, and social network analysis.
- K-Means clustering divides data into clusters by iteratively updating cluster centers.
- Agglomerative Hierarchical Clustering merges clusters into a hierarchy, depicted as a dendrogram.
- Clustering by Similarity Aggregation (CLARA) efficiently handles large datasets using sub-sampling.