Association and Correlation in Data Mining
In data mining, association and correlation are key techniques for extracting patterns and relationships from large datasets. Association uncovers relationships between items, while correlation measures the strength of the link between two variables. This exploration will delve into these techniques, their types, and methods, pivotal for informed decision-making in various domains.
What is Association?
Association is a technique used in data mining to identify the relationships or co-occurrences between items in a dataset. It involves analyzing large datasets to discover patterns or associations between items, such as products purchased together in a supermarket or web pages frequently visited together on a website. Association analysis is based on the idea of finding the most frequent patterns or itemsets in a dataset, where an itemset is a collection of one or more items.
Association analysis can provide valuable insights into consumer behaviour and preferences. It can help retailers identify the items that are frequently purchased together, which can be used to optimize product placement and promotions. Similarly, it can help e-commerce websites recommend related products to customers based on their purchase history.
Types of Associations
Here are the most common types of associations used in data mining:
- Itemset Associations: Itemset association is the most common type of association analysis, which is used to discover relationships between items in a dataset. In this type of association, a collection of one or more items that frequently co-occur together is called an itemset. For example, in a supermarket dataset, itemset association can be used to identify items that are frequently purchased together, such as bread and butter.
- Sequential Associations: Sequential association is used to identify patterns that occur in a specific sequence or order. This type of association analysis is commonly used in applications such as analyzing customer behaviour on e-commerce websites or studying weblogs. For example, in the weblogs dataset, a sequential association can be used to identify the sequence of pages that users visit before making a purchase.
- Graph-based Associations Graph-based association is a type of association analysis that involves representing the relationships between items in a dataset as a graph. In this type of association, each item is represented as a node in the graph, and the edges between nodes represent the co-occurrence or relationship between items. The graph-based association is used in various applications, such as social network analysis, recommendation systems, and fraud detection. For example, in a social network dataset, identifying groups of users with similar interests or behaviours.
Transform Your Career
Choose from our industry-leading programs designed for career success
Modern Software and AI Engineering Program
Master full-stack development with AI integration

Modern Data Science and ML with specialisation in AI
Advanced data science techniques with AI specialization
Advanced AIML with Specialisation in Agentic AI
Deep dive into AIML with focus on Agentic systems
DevOps, Cloud & AI Platform Engineering
Build and manage AI-powered cloud infrastructure
AI Engineering Advanced Certification by IIT-Roorkee
Premier AI engineering certification from IIT-Roorkee
Association Rule Mining
Here are the most commonly used algorithms to implement association rule mining in data mining:
- Apriori Algorithm - Apriori is one of the most widely used algorithms for association rule mining. It generates frequent item sets from a given dataset by pruning infrequent item sets iteratively. The Apriori algorithm is based on the concept that if an item set is frequent, then all of its subsets must also be frequent. The algorithm first identifies the frequent items in the dataset, then generates candidate itemsets of length two from the frequent items, and so on until no more frequent itemsets can be generated. The Apriori algorithm is computationally expensive, especially for large datasets with many items.
- FP-Growth Algorithm - FP-Growth is another popular algorithm for association rule mining that is based on the concept of frequent pattern growth. It is faster than the Apriori algorithm, especially for large datasets. The FP-Growth algorithm builds a compact representation of the dataset called a frequent pattern tree (FP-tree), which is used to mine frequent item sets. The algorithm scans the dataset only twice, first to build the FP-tree and then to mine the frequent itemsets. The FP-Growth algorithm can handle datasets with both discrete and continuous attributes.
- Eclat Algorithm - Eclat (Equivalence Class Clustering and Bottom-up Lattice Traversal) is a frequent itemset mining algorithm based on the vertical data format. The algorithm first converts the dataset into a vertical data format, where each item and the transaction ID in which it appears are stored. Eclat then performs a depth-first search on a tree-like structure, representing the dataset's frequent itemsets. The algorithm is efficient regarding both memory usage and runtime, especially for sparse datasets.
Delve Deeper: Our Data Science Certification Course is Your Next Step. Enroll Now and Transform Your Understanding into Practical Expertise.
Correlation Analysis in Data Mining
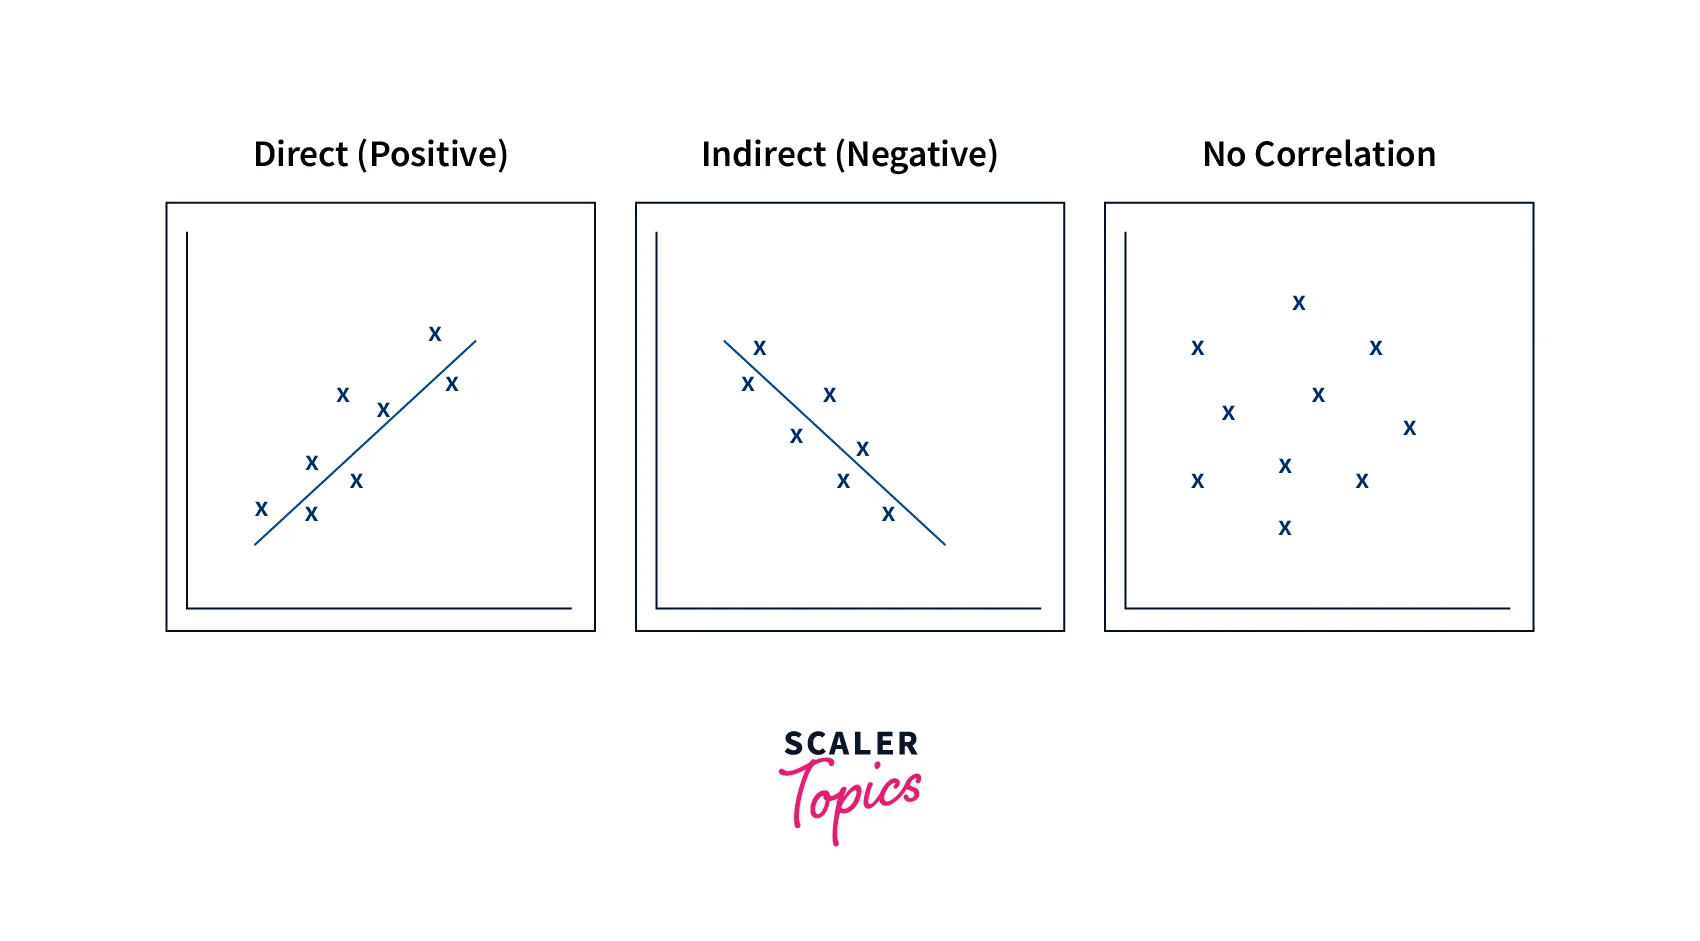
Correlation Analysis is a data mining technique used to identify the degree to which two or more variables are related or associated with each other. Correlation refers to the statistical relationship between two or more variables, where the variation in one variable is associated with the variation in another variable. In other words, it measures how changes in one variable are related to changes in another variable. Correlation can be positive, negative, or zero, depending on the direction and strength of the relationship between the variables.
, For example,, we are studying the relationship between the hours of study and the grades obtained by students. If we find that as the number of hours of study increases, the grades obtained also increase, then there is a positive correlation between the two variables. On the other hand, if we find that as the number of hours of study increases, the grades obtained decrease, then there is a negative correlation between the two variables. If there is no relationship between the two variables, we would say that there is zero correlation.
Why is Correlation Analysis Important?
Correlation analysis is important because it allows us to measure the strength and direction of the relationship between two or more variables. This information can help identify patterns and trends in the data, make predictions, and select relevant variables for analysis. By understanding the relationships between different variables, we can gain valuable insights into complex systems and make informed decisions based on data-driven analysis.
Turn Learning into Career Growth
Types of Correlation Analysis in Data Mining
There are three main types of correlation analysis used in data mining, as mentioned below:
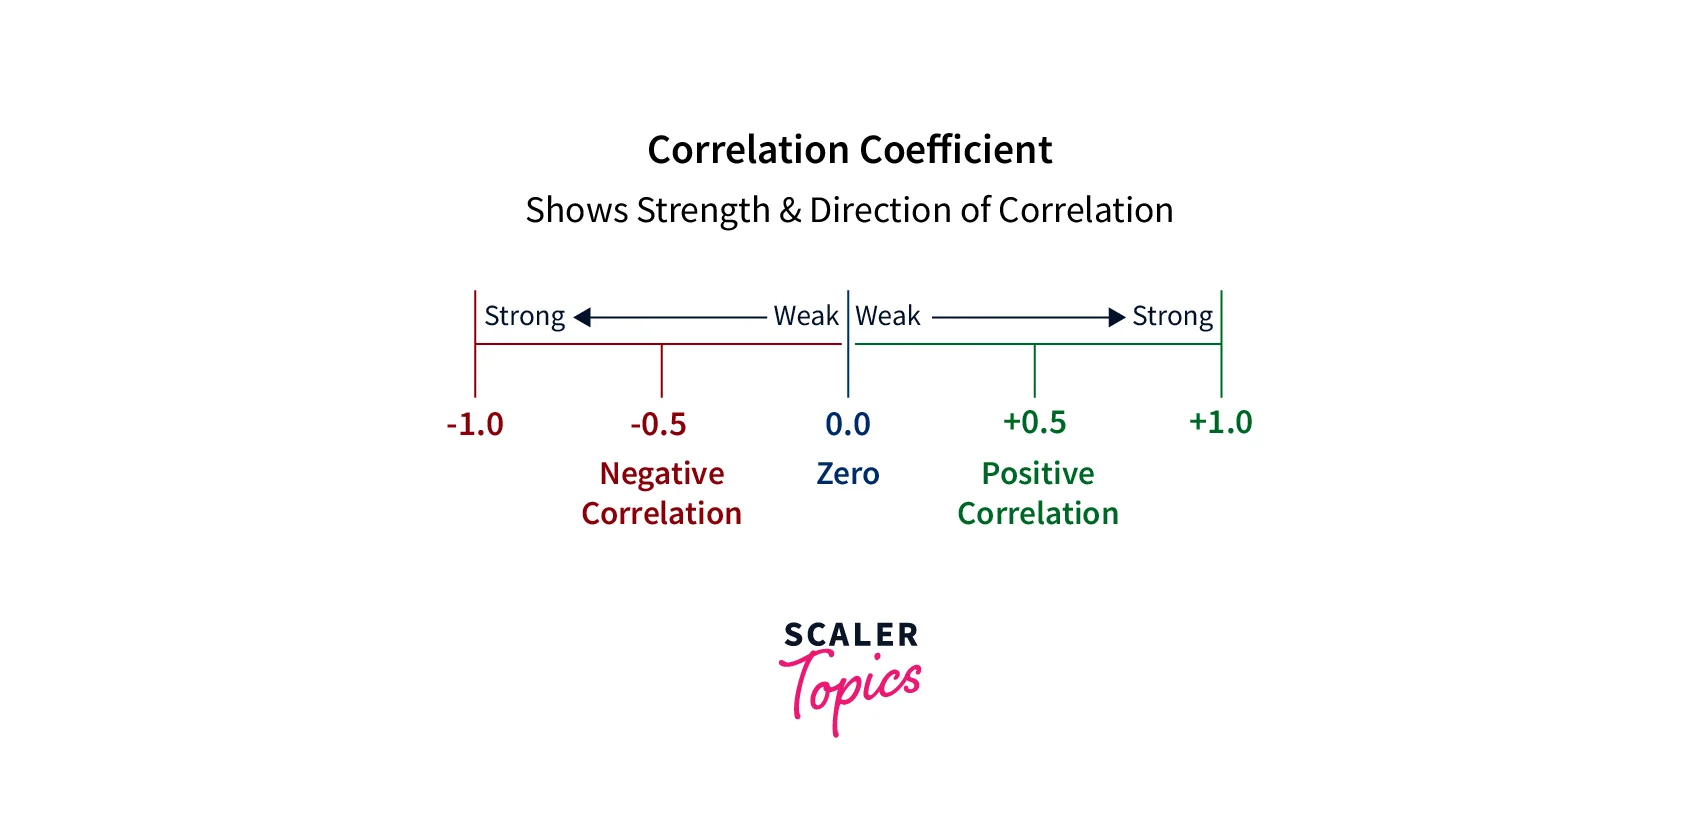
- Pearson Correlation Coefficient - Pearson correlation measures the linear relationship between two continuous variables. It ranges from -1 to +1, where -1 indicates a perfect negative correlation, 0 indicates no correlation, and +1 indicates a perfect positive correlation. The Pearson correlation coefficient between two variables, X and Y, is calculated as follows -
where is the covariance between variables and , and and are the standard deviations of variables and , respectively.
- Kendall Rank Correlation - Kendall correlation is a non-parametric measure of the association between two ordinal variables. It measures the degree of correspondence between the ranking of observations on two variables. It calculates the difference between the number of concordant pairs (pairs of observations that have the same rank order in both variables) and discordant pairs (pairs of observations that have an opposite rank order in the two variables) and normalizes the result by dividing by the total number of pairs. The formula for the Kendall correlation is -
where is the number of concordant pairs, is the number of discordant pairs, is the total number of pairs, and represents the sample size.
-
Spearman Rank Correlation - Spearman correlation is another non-parametric measure of the relationship between two variables. It measures the degree of association between the ranks of two variables. Spearman correlation is similar to the Kendall correlation in that it measures the strength of the relationship between two variables measured on a ranked scale. However, Spearman correlation uses the actual numerical ranks of the data instead of counting the number of concordant and discordant pairs. The formula for Spearman correlation is -
where is the difference between the ranks of the paired observations and is the number of observations.
Interpreting Results Of Correlation Analysis
After performing a correlation analysis, it is important to interpret the results to draw meaningful conclusions about the relationship between the analyzed variables. One common way to interpret correlation coefficients is by using the following general guidelines -
- Any score from +0.5 to +1 indicates a very strong positive correlation, meaning that the variables are strongly related in a positive direction, increasing together or simultaneously.
- Any score from -0.5 to -1 indicates a strong negative correlation, meaning that the variables are strongly related in a negative direction. It also means that as one variable decreases, the other variable increases and vice-versa.
- A score of 0 indicates no correlation, meaning there is no relationship between the analyzed variables.
Benefits of Correlation Analysis
Correlation analysis is a powerful tool in data mining and statistical analysis that offers several benefits.
Some of the main benefits of correlation analysis are:
- Identifying Relationships - Correlation analysis helps identify the relationships between different variables in a dataset. By quantifying the degree and direction of the relationship, we can gain insights into how changes in one variable are likely to affect the other.
- Prediction - Correlation analysis can help predict one variable's values based on another variable's values. Building models based on correlations can predict future outcomes and make informed decisions.
- Feature Selection - Correlation analysis can also help select the most relevant features for a particular analysis or model. By identifying the features that are highly correlated with the outcome features, we can focus on those features and exclude the irrelevant ones, improving the accuracy and efficiency of the analysis or model.
- Quality Control - Correlation analysis is useful in quality control applications, where it can be used to identify correlations between different process variables and identify potential sources of quality problems.
Use Cases for Correlation Analysis and Association Mining
Here are some examples of the most common use cases for association and correlation in data mining -
- Market Basket Analysis - Association mining is commonly used in retail and e-commerce industries to identify patterns in customer purchase behaviour. By analyzing transaction data, businesses can uncover product associations and make informed decisions about product placement, pricing, and marketing strategies.
- Medical Research - Correlation analysis is often used in medical research to explore relationships between different variables, such as the correlation between smoking and lung cancer risk or the correlation between blood pressure and heart disease.
- Financial Analysis - Correlation analysis is frequently used in financial analysis to measure the strength of relationships between different financial variables, such as the correlation between stock prices and interest rates.
- Fraud Detection - Association mining can be used to identify behaviour patterns associated with fraudulent activity, such as multiple failed login attempts or unusual purchase patterns.
Conclusion
- Association and correlation in data mining are two important techniques that can help uncover relationships and patterns in large datasets.
- Association mining is used to find frequent itemsets, sequential patterns, and graph-based patterns, while correlation analysis measures the strength and direction of linear relationships between variables.
- Association and correlation in data mining have a wide range of applications, including market basket analysis, medical research, fraud detection, recommender systems, climate research, and financial analysis.