Data Mining in Excel
Overview
Data mining is the process of extracting useful insights and patterns from large datasets. Microsoft Excel, the popular spreadsheet software, has powerful data mining capabilities that allow users to analyze and manipulate large datasets quickly and easily. In this article, we'll explore the various data mining techniques that can be applied in Excel and how they can be used to extract valuable insights from your data.
Introduction
In today's data-driven world, businesses and organizations generate vast amounts of data, which, if analyzed correctly, can provide valuable insights and help make informed decisions. Data mining, the process of discovering patterns and trends in large datasets, is a powerful tool for extracting such insights. While several specialized tools are available for data mining, Microsoft Excel, with its numerous data analysis tools, can also be used to perform several data mining techniques. Let’s explore various techniques for data mining in Excel in the subsequent sections.
What is Data Mining?
- Data mining is the process of discovering patterns, trends, and insights from large datasets using statistical and computational methods. It involves extracting and analyzing data from various sources, identifying patterns and relationships within the data, and transforming the data into useful and actionable information.
- Data mining aims to uncover hidden patterns and knowledge in large datasets that can be used to make informed decisions, improve business operations, and gain a competitive advantage.
Importance of Data Mining
Data mining plays a crucial role in business decision-making by providing valuable insights into customer behavior, market trends, and other critical business information. Here are some ways in which data mining can be beneficial for businesses -
- Customer insights - Data mining can help businesses analyze customer data to identify buying patterns, preferences, and behavior. By understanding customer needs and preferences, businesses can improve their products and services, personalize marketing strategies, and enhance customer satisfaction.
- Competitive advantage - Data mining can help businesses gain a competitive advantage by providing insights into market trends, consumer behavior, and other critical business information.
- Improved decision-making - Data mining can help businesses make informed decisions based on accurate and relevant information. By analyzing data, businesses can identify trends, patterns, and relationships within the data that can be used to make strategic decisions.
- Cost savings - Data mining can help businesses identify inefficiencies in their operations, reduce waste, and optimize resources. By analyzing data, businesses can identify areas where they can save costs, streamline processes, and increase efficiency.
Transform Your Career
Choose from our industry-leading programs designed for career success
Modern Software and AI Engineering Program
Master full-stack development with AI integration

Modern Data Science and ML with specialisation in AI
Advanced data science techniques with AI specialization
Advanced AIML with Specialisation in Agentic AI
Deep dive into AIML with focus on Agentic systems
DevOps, Cloud & AI Platform Engineering
Build and manage AI-powered cloud infrastructure
AI Engineering Advanced Certification by IIT-Roorkee
Premier AI engineering certification from IIT-Roorkee
How Can Excel be Used as a Data Mining Tool?
Microsoft Excel, the popular spreadsheet software, is widely used in business for various tasks, including data mining. Excel has many built-in tools that can be used for data mining, making data mining in Excel a useful way for businesses to extract valuable insights from their data. Excel's data analysis tools can help businesses perform various data mining techniques, such as regression analysis, clustering, and classification.
Additionally, Excel can connect to external data sources, such as databases and web services, making it easier to import and analyze large datasets. Excel also supports data visualization tools like charts and graphs, which can help businesses present their data more understandably and insightfully.
In further sections, let’s explore various ways to perform various techniques for data mining in Excel.
Scaler Placement Report and Statistics
Scaler learners achieved 2.5x salary growth with average post-Scaler CTC reaching ₹23L.
Data Preparation
Importance Of Data Preparation In Data Mining
Data preparation is a critical step in the data mining process that involves cleaning, transforming, and organizing data before analysis. It is essential because data is often incomplete, inconsistent, or contains errors, leading to inaccurate analysis and unreliable insights. Proper data preparation ensures that the data used for analysis is accurate, consistent, and reliable, which can improve the quality of insights gained from data mining.
Data preparation involves several tasks, such as removing duplicate data, handling missing data, transforming data into the required format, and normalizing data. These tasks can be time-consuming, but they are necessary to ensure the data is ready for analysis.
Steps for Data Preparation in Excel
Here are a few of the most common steps used for data preparation -
Data Cleaning
The first step in data preparation is to clean the data by removing inconsistent entries, missing values, and duplicate records. Excel provides several built-in tools to perform data cleaning, such as -
- Remove duplicates - Excel's Remove Duplicates tool can be used to remove duplicate records from a dataset. To access this tool, select the range of data and click on the "Remove Duplicates" button in the "Data" tab.
- Filter - Excel's Filter tool can remove or hide rows containing inconsistent entries or missing values. To access this tool, select the range of data and click on the "Filter" button in the "Data" tab.
Data Transformation
After cleaning the data, the next step is to transform the data into the required format. Excel provides several built-in tools to perform data transformation, such as -
- PivotTable - Excel's PivotTable tool can be used to summarize and aggregate large datasets. To access this tool, select the range of data and click on the "PivotTable" button in the "Insert" tab.
- Date and time functions - Excel provides several built-in functions to manipulate date and time values, such as YEAR, MONTH, DAY, HOUR, and MINUTE.
- Mathematical transformations - Excel provides several built-in mathematical functions, such as SUM, AVERAGE, MIN, and MAX, which can be used to transform numerical data.
Data Integration
Data integration is to integrate data from multiple sources. Excel provides several built-in tools to perform data integration, such as -
- Power Query - Excel's Power Query tool can combine and transform data from multiple sources, such as databases and web services.
- Data connections - Excel's Data Connections tool can be used to connect to external data sources, such as databases and web services, and import data into Excel.
Data Reduction
- Data reduction involves reducing the amount of data to be analyzed. Excel has several built-in tools that can be used for data reduction, such as the "Filter" feature, which can be used to display only the data that meets specific criteria.
- Aggregation functions, such as the "SUM" and "AVERAGE" functions, can also be used to reduce data by summarizing it.
Additionally, several third-party add-on tools are available, including XLSTAT and XLMiner, that allow data preparation in Excel. These tools offer various data preparation techniques, such as missing value imputation, data cleaning, and data transformation.
Eager to Explore Further? Enroll in Our Industry-Expert-Led Data Science Online Courses and Bridge the Gap Between Theory and Application.
Data Mining Techniques in Excel
Here are a few of the most common techniques for data mining -
Turn Learning into Career Growth
Regression Analysis
Regression analysis is a statistical technique used to identify the relationship between two or more variables. Excel has built-in tools that can be used for regression analysis, such as the "Data Analysis" tool. Regression analysis can be used to predict the values of one variable based on the values of other variables. Here are the steps to perform a regression analysis in Excel -
- First, ensure that the "Data Analysis" tool is enabled in your version of Excel.
- Select the data range you want to analyze.
- Go to "Data" -> "Data Analysis" -> "Regression" -> "OK".
- In the "Regression" dialog box, enter the input and output variables, select the regression type, and choose the output range where the results will be displayed.
- Click "OK" to perform the regression analysis.
The output of the regression analysis will include information such as the regression equation, coefficients, standard error, R-squared value, and other statistical measures that can be used to interpret the results.

Clustering
Clustering is a technique used to group similar data points based on their characteristics. Clustering can be used to identify patterns or groups within the data. You can use third-party tools like XLSTAT to perform K-Means clustering in Excel. Here are the steps to perform clustering in Excel -
- Open your Excel file and go to the "XLSTAT" tab.
- Click on the "Analyzing Data" tab and select "K-Means Clustering" from the dropdown menu.
- In the "K-Means Clustering" dialog box, select the "Input Range" option and specify the range of data that you want to use for the clustering analysis.
- Choose the dissimilarity index to use when calculating the distance between observations. You can choose from various options such as Euclidean distance, Manhattan distance, etc.
- Select the clustering criteria to use when evaluating the quality of the clustering solution.
- Choose the number of clusters you want to create in the analysis.
- Click "OK" to perform the K-Means clustering analysis.

Classification
Classification is a data mining technique that involves predicting the value of a categorical target variable based on one or more predictor variables. XLMiner is a data mining add-in for Excel that provides a range of classification techniques, including logistic regression, decision trees, neural networks, and support vector machines. It can also be used to perform K-Means clustering. XLMiner is currently known as Analytic Solver.
To perform classification in XLMiner, users can import their data into Excel and select the appropriate classification technique. They can then specify the target and predictor variables and use XLMiner's tools to divide the data into training and testing sets. The model can then be trained using the training data and evaluated on the testing data.
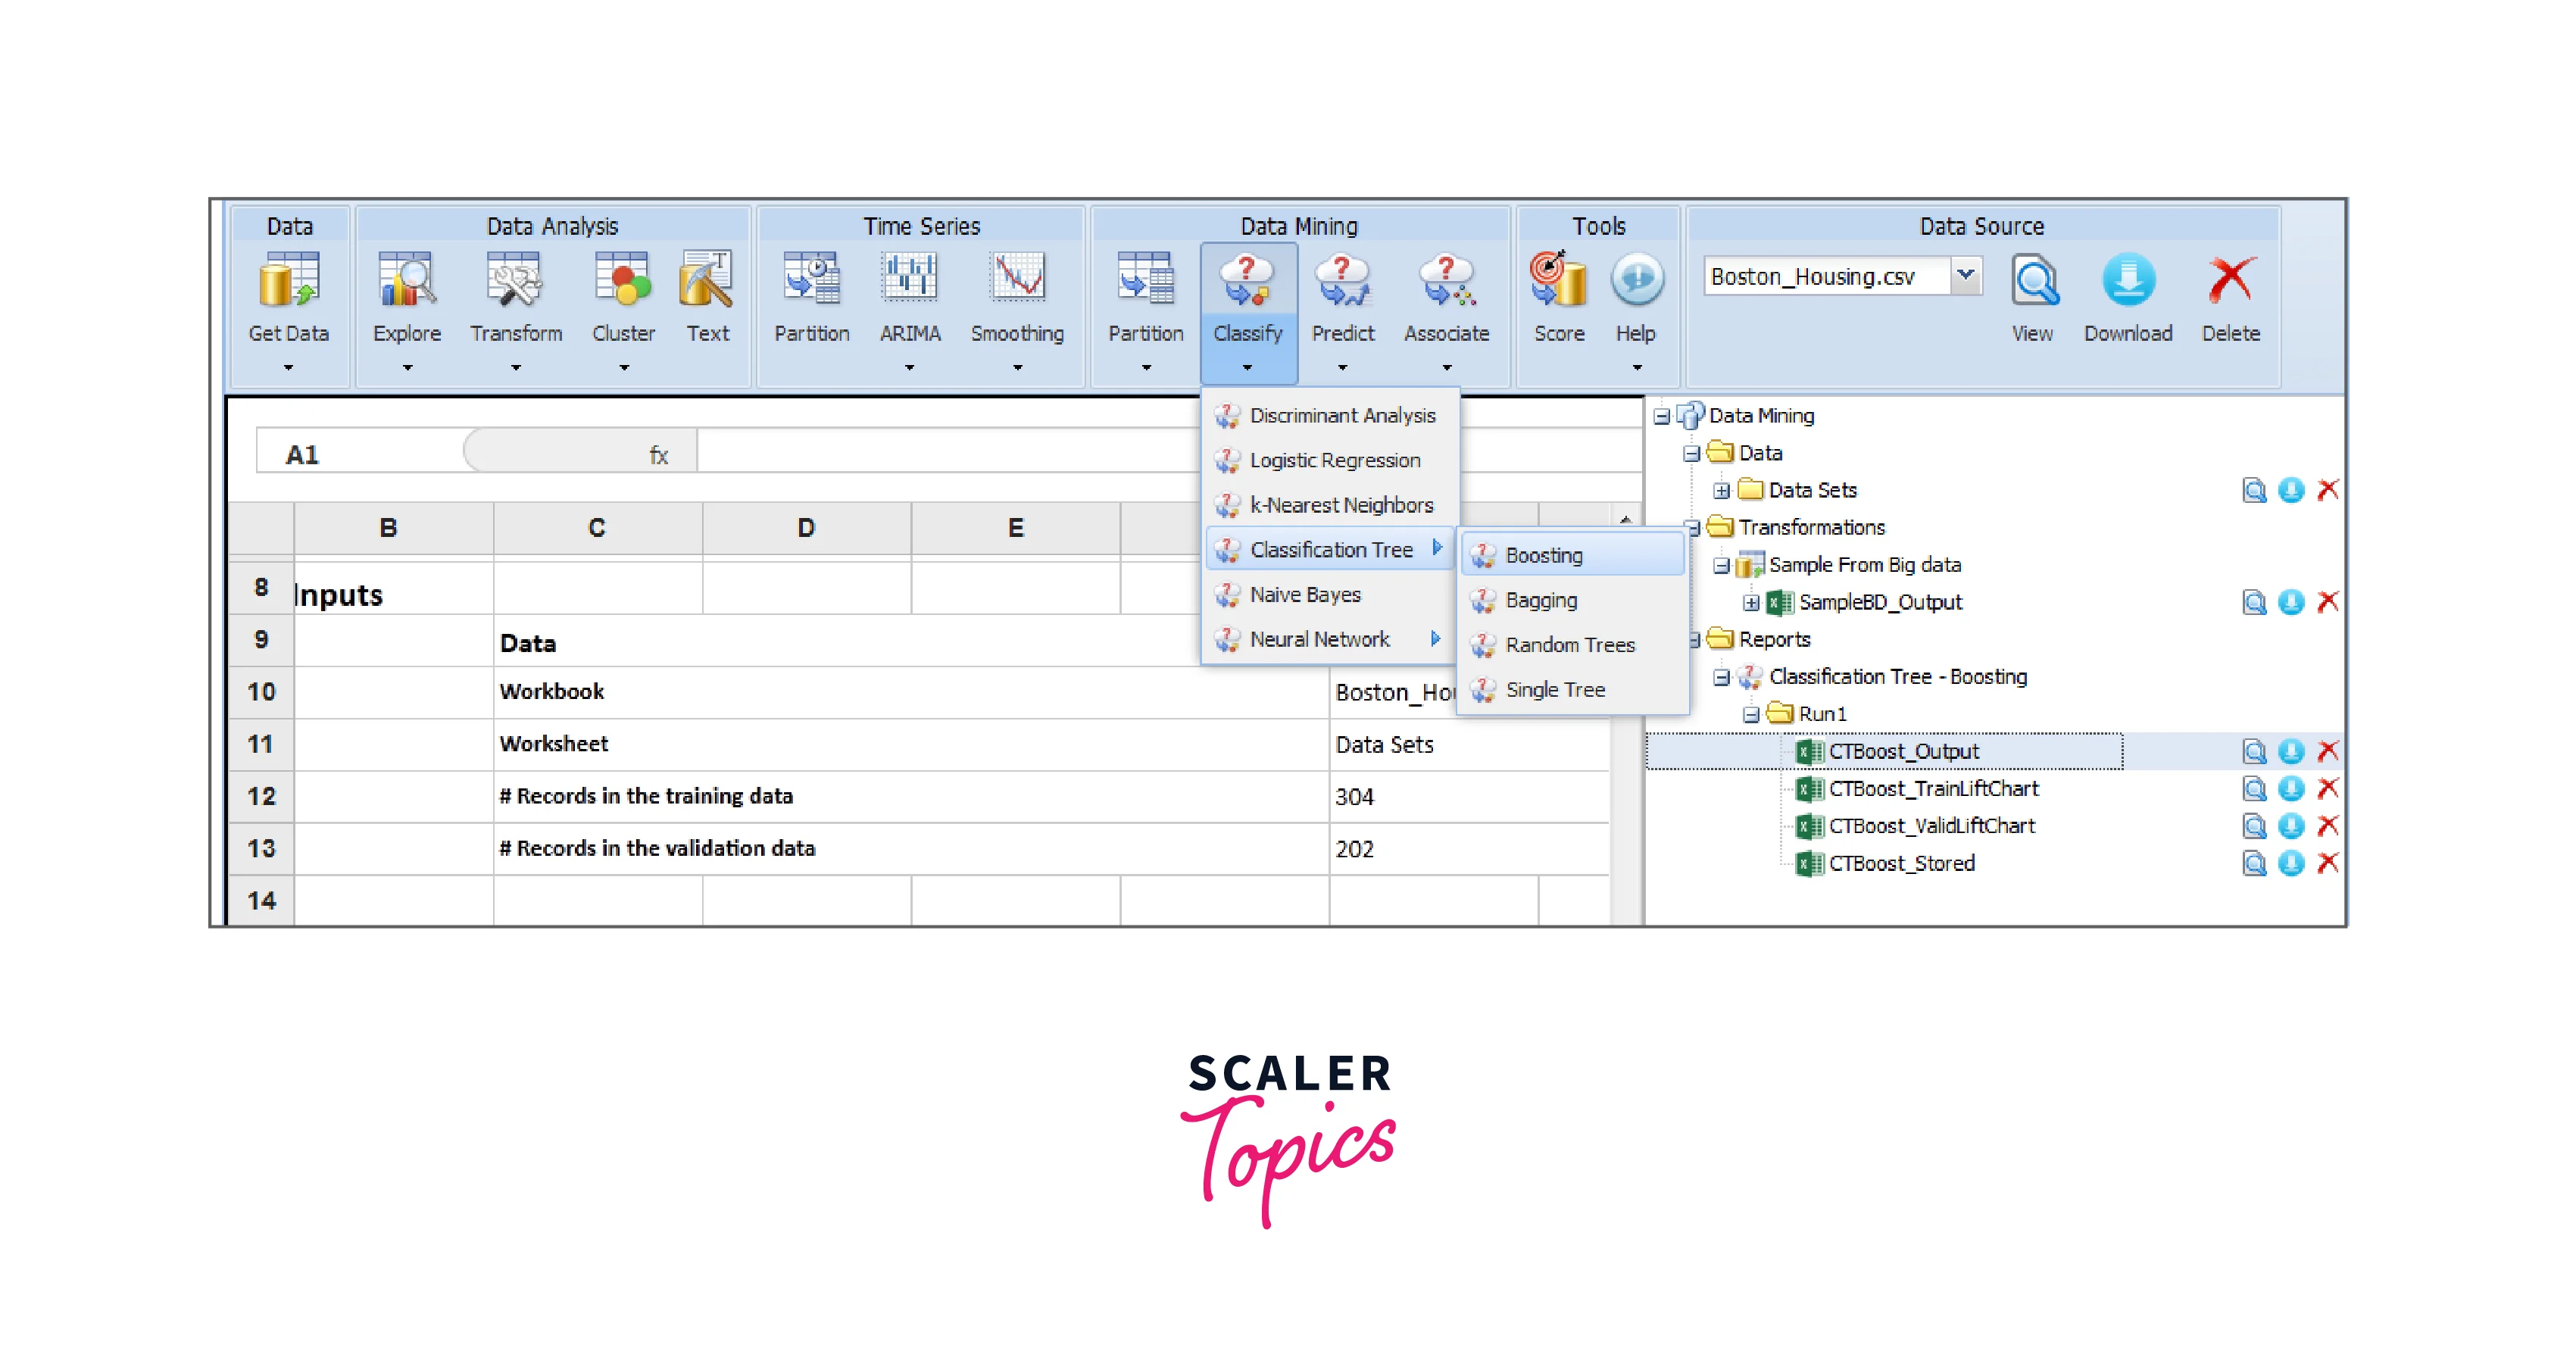
XLMiner's interface is user-friendly, and users can customize their analysis settings to suit their specific needs. Additionally, XLMiner includes various tools for data preparation, exploration, and visualization, making it a comprehensive data mining solution for Excel users.
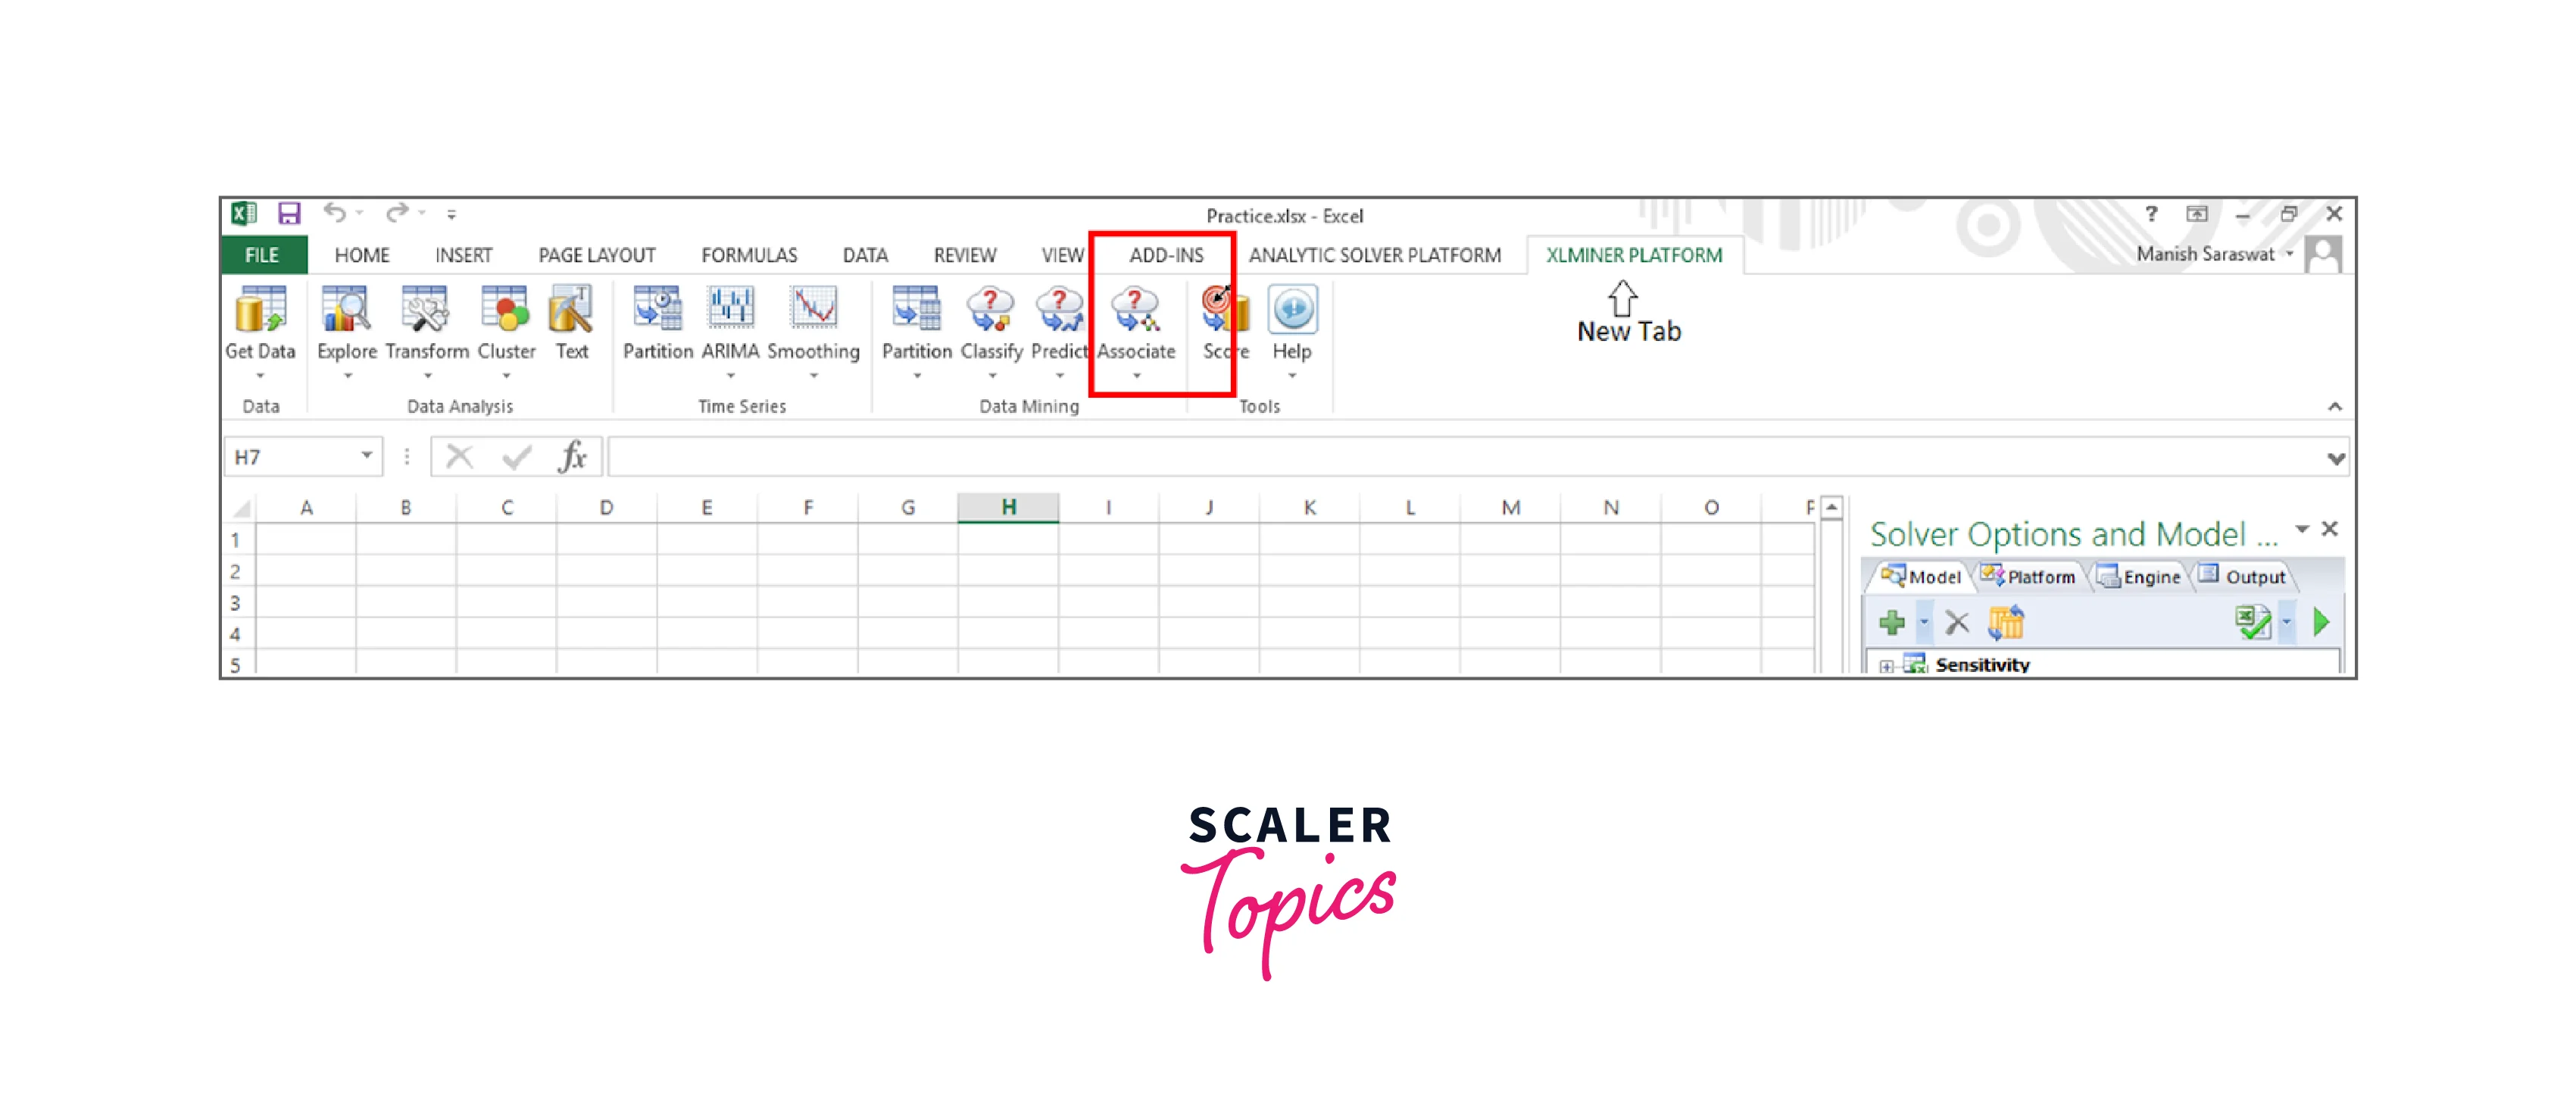
Association Analysis
Association analysis in Excel is a data mining technique that allows you to identify interesting relationships between different items in a dataset. It is often used in market basket analysis to understand customers' buying patterns and make informed decisions about product placement, marketing campaigns, and other business strategies.
There are several third-party tools available for performing association analysis in Excel, including XLMiner, XLSTAT, etc. These tools allow you to generate association rules and explore patterns in your data easily, even if you don't have a data mining or statistics background.
Time Series Analysis
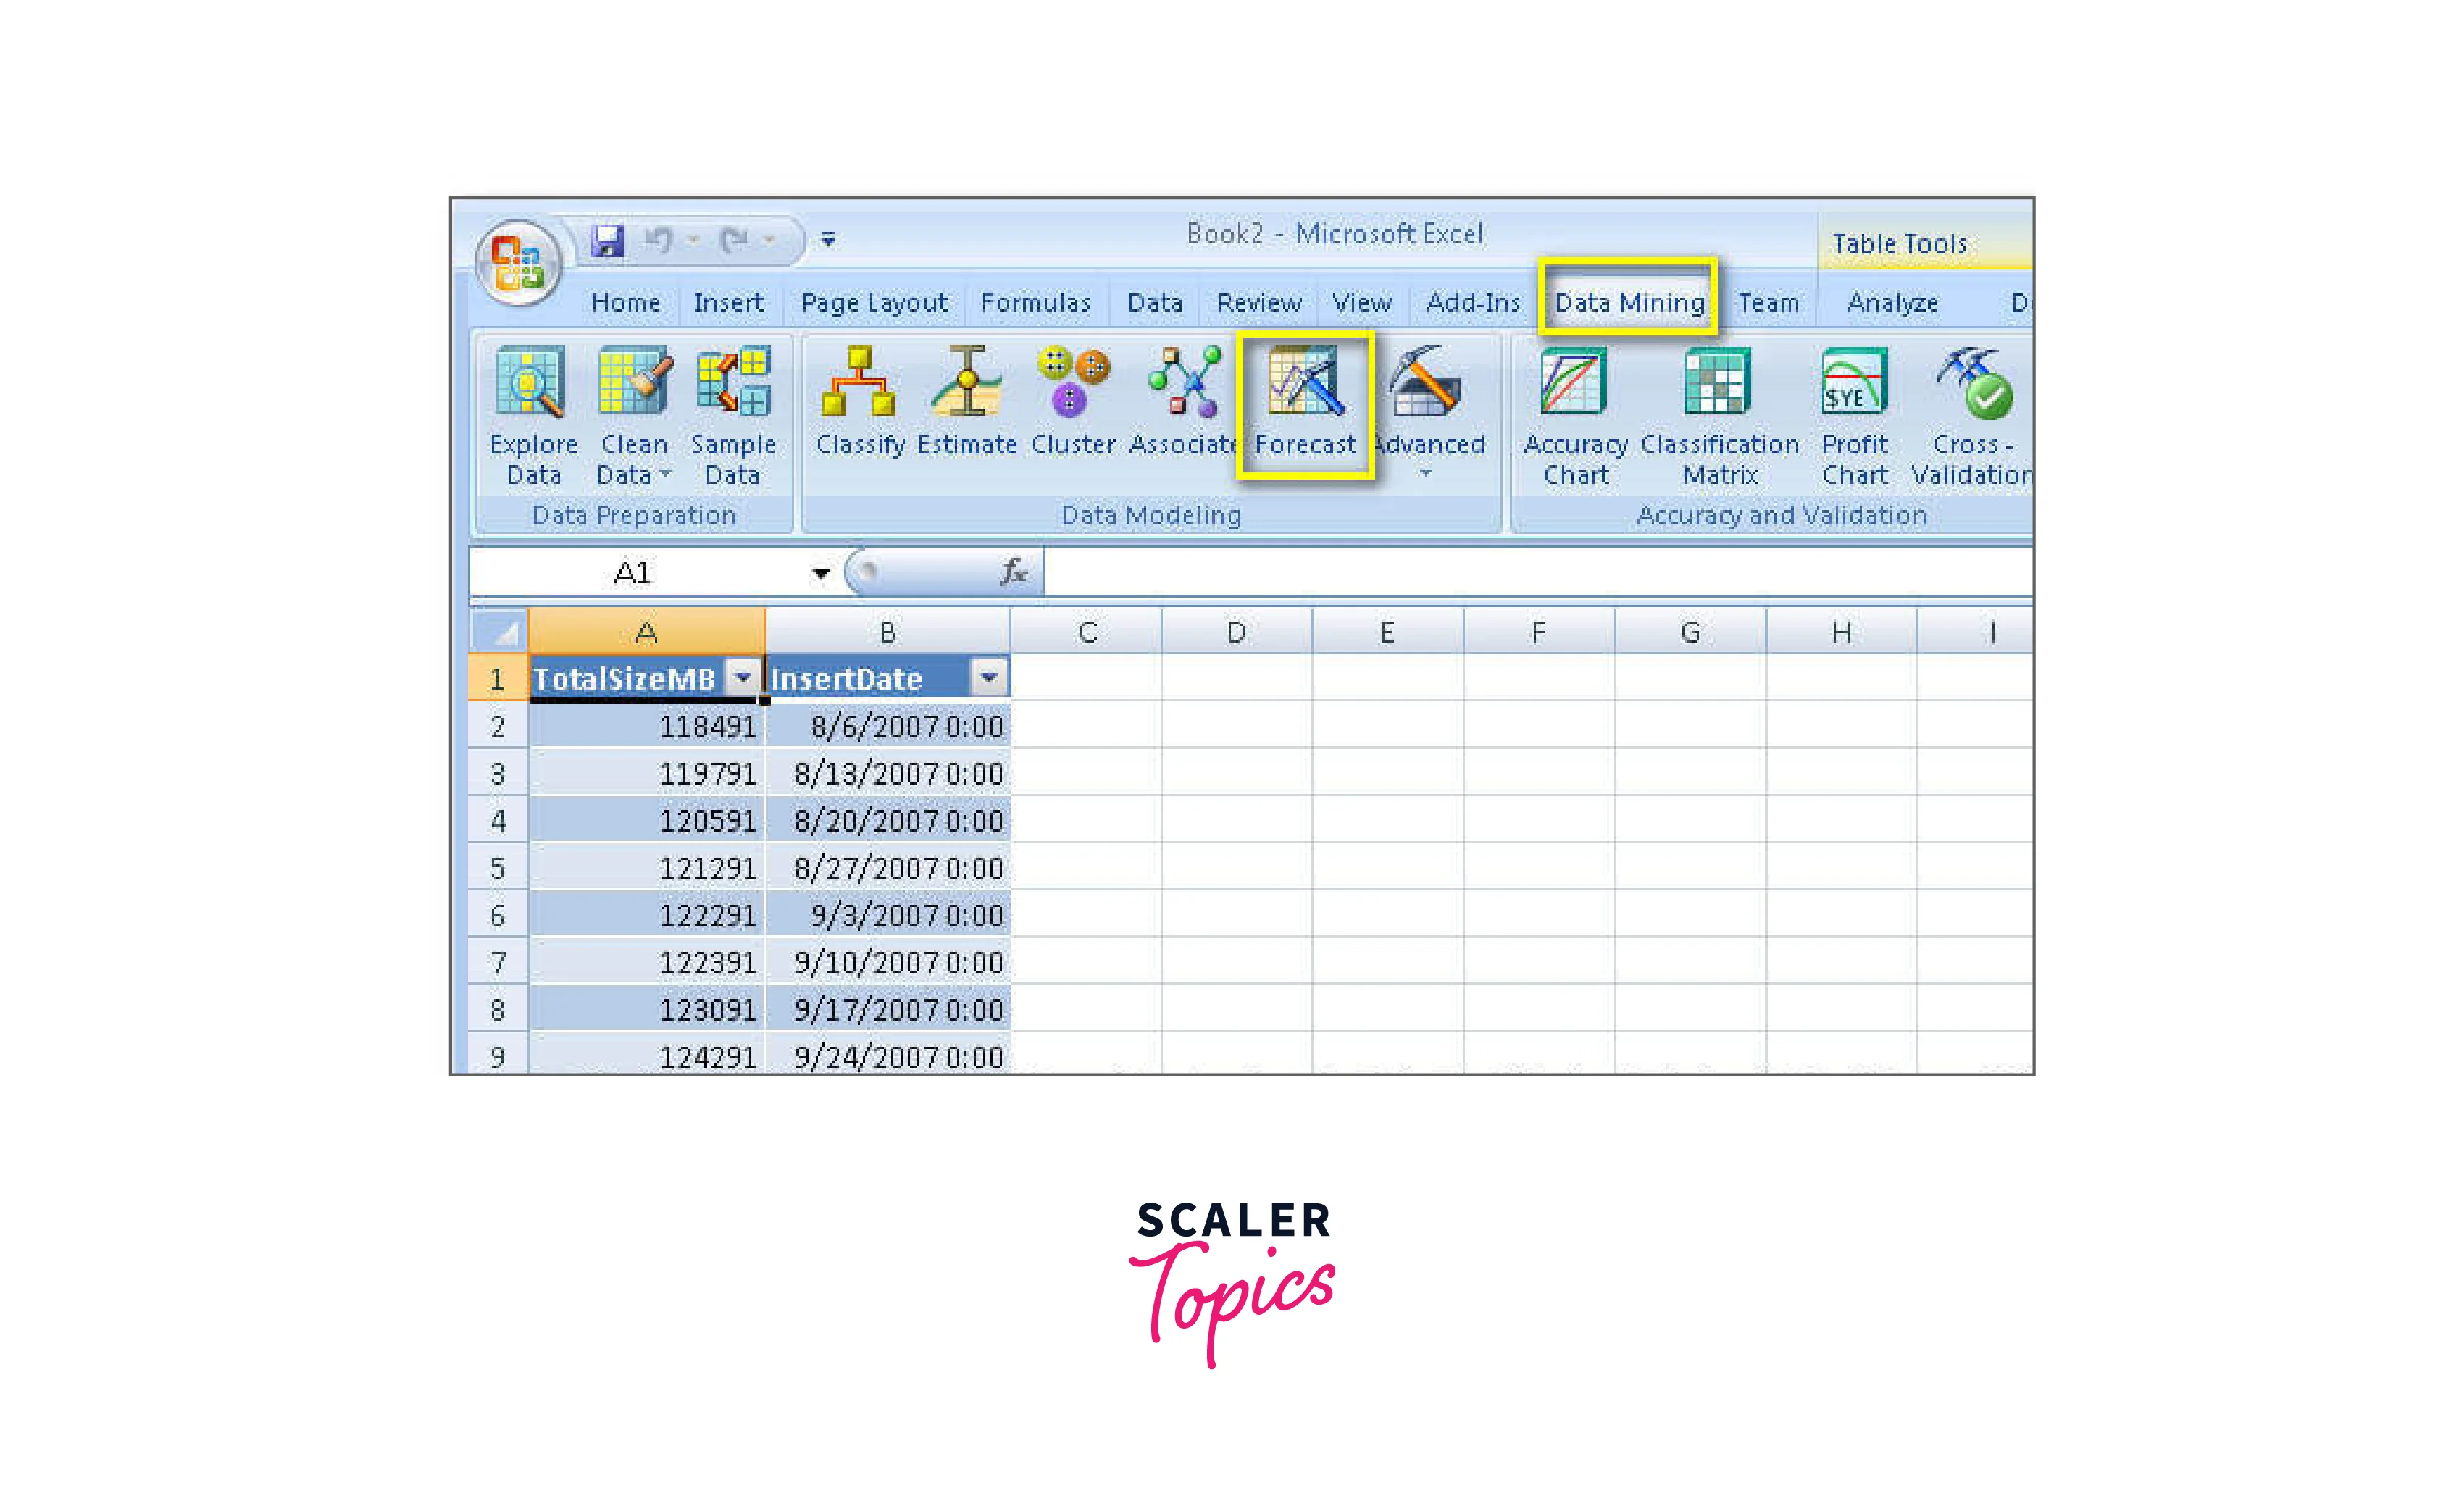
Time series analysis in Excel involves analyzing and forecasting trends in data collected over time. Time series analysis aims to identify patterns in the data, such as seasonality or trends, and use this information to make predictions about future values.
Several Excel tools can be used for time series analysis, including moving averages, exponential smoothing, trend analysis, and ARIMA modeling. These tools can be used to identify trends and patterns in the data, estimate future values, and forecast potential scenarios. There are several third-party tools available for performing time series analysis in Excel, including XLMiner, XLSTAT, etc.
Advantages and Disadvantages of Data Mining in Excel
Advantages of Data Mining in Excel include -
- User-friendly interface - Excel is a widely used spreadsheet software and has a familiar and user-friendly interface. Users can easily navigate through the menus and options to perform data mining tasks without the need for extensive programming skills.
- Accessibility - Excel is a widely available tool, and most organizations already have it installed on their computers. This means that users can easily access and analyze data without the need for additional software or resources.
- Flexibility - Excel allows users to perform a wide range of data mining techniques, such as clustering, regression, and association analysis. Users can also customize their analysis by creating their formulas and functions.
- Cost-effective - Excel is a cost-effective solution for data mining as it is included in the Microsoft Office Suite and does not require additional licensing fees.
Disadvantages of Data Mining in Excel include -
- Limited processing power - Excel has limited processing power and may not be able to handle large datasets or complex algorithms. This can result in slower analysis times and less accurate results.
- Lack of scalability - Excel may not be the best option for organizations that require a scalable solution. As the amount of data increases, Excel may become slow and cumbersome to use.
- Limited visualization options - While Excel has basic charting and visualization tools, it may not provide the level of detail and customization needed for more complex data visualization tasks.
Conclusion
- Data mining is a powerful tool for uncovering insights and patterns in data that can be used to inform business decisions.
- Excel offers several built-in data mining tools, such as regression analysis, clustering, and classification, as well as add-on tools like XLSTAT and XLMiner.
- While Excel can be a convenient and accessible platform for data mining, it also has limitations, such as scalability and the need for manual data preparation.