Data Preprocessing in Excel: What should you use?
Overview
Microsoft Excel is a fantastic tool for preparing and handling structured data for non-programmers. Excel includes tools and methods that make cleaning structured data simpler. We'll review a few of the numerous functions and provide some examples. Before moving on, let's discuss a few fundamental operations that will be included in more `complex formulas later in this tutorial.
What are we Building?
Exploratory data analysis is conducting preliminary research on data to find patterns, spot deviations, and select the best statistical models and methods.
Data preparation, data visualization, and statistical modeling are the phases of exploratory data analysis that are most frequently used. The act of cleaning and structuring data is called data preparation. To explore the data visually, graphs and charts are created. In statistical modeling, patterns in the data are discovered using statistical methods.
When a data set is too big to examine manually, exploratory data analysis may be used. In this situation, exploratory data analysis can be utilized to highlight a dataset's key features.
For instance, you could be interested in learning which years and locations experienced the fastest or slowest population growth. You can also see how fast-growing and slow-growing regions are distributed.
You can use various statistical functions provided by Excel for the exploratory data analysis procedure. For instance, the QUARTILE functions can determine the lower and upper quartiles. These numbers can help us understand how the data are distributed across each field in our dataset.
Pre-requisites
Before getting into this, ensure you know common terminologies like data preprocessing and data analysis in Excel.
How are we going to build this?
Exploratory data analysis is one of the first steps in every data analysis project.
This involves three types of dataset exploration:
- Using descriptive statistics to summarise a dataset.
- Using charts to visualize a dataset.
- Finding values that need to be included.
Before doing a hypothesis test`, fitting a regression model, or performing statistical modeling, you can use these three steps to understand how the values in a dataset are distributed and identify any problematic values.
Final Output
Requirements
Click the File tab, Options, and the Add-Ins category. If you're using Excel 2007, click the Microsoft Office Button image and then Excel Options. In the Manage box, select Excel Add-ins and then click Go. If you're using Excel for Mac, in the file, menu go to Tools > Excel Add-ins. In the Add-Ins box, check the Analysis ToolPak check box and click OK. If Analysis ToolPak is not listed in the Add-Ins available box, click Browse to locate it. If you are prompted that the Analysis ToolPak is not currently installed on your computer, click Yes to install it.
How to Preprocess a Data in Excel
Sample Data Sets for Reference
Here are a few datasets. You can choose any one among these for learning.
Hotel Booking Demand The hotel booking demand dataset includes reservation data for city and resort hotels. It contains details on the reservation period, the length of the stay, the number of adults, kids, and babies, and the number of available parking places. For those who want to practice exploratory data analysis (EDA) or begin developing predictive models, this dataset is perfect. Get the info right here.
Trending YouTube Video Statistics
The Trending YouTube Video Statistics is a record that is updated daily with statistics on the most popular YouTube videos gathered using the YouTube API. It has data on daily YouTube trends going back several months (and counting), with up to 200 trending videos highlighted daily. The data for each region is in a different file. The video's title, channel name, publish date, tags, number of views, likes and dislikes, description, and number of comments are among the data. Get the info right here.
Taxi Trajectory Data
The Taxi Trajectory dataset offers a year's worth of trajectories for all 442 cabs operating in Porto (from 01/07/2013 to 30/06/2014). Three sub-categories—taxi central-based, stand base, and non-taxi central-based—have been created for each ride. There are a total of nine features in each data sample, which represents a single completed trip. Get the info right here.
Hourly Weather Surface – Brazil (Southeast region)
The Hourly Weather Surface for Brazil's Southeast region includes hourly weather information from 122 weather stations. (Brazil). The dataset has 17 climate parameters (continuous values) from 122 weather stations and is 2 GB in size. The dataset's components include instant air temperature, instant dew point, instant relative humidity of the air, and solar radiation, among others. Get the info right here.
Iris Species
The Iris Species is the Iris Plant Database, which has three classes with 50 instances, each referring to a different kind of iris plant. Two classes cannot be linearly separated, although one class can be linearly separated from the other. This dataset's columns contain Id, Sepallength, PetalLength, and others. Get the info right here.
Slogan Dataset
You may analyze the slogans of various companies using the Slogan dataset. It contains a list of catchphrases organized as company_name and company_slogan. The information was obtained from slogan-list.com, which offers over 1000 pairs of "company slogans" spanning more than ten categories. Get the info right here.
Importing the Data
Import the data set by downloading any one data set given above. After downloading the data set, open it in Excel.
Note: you can also import CSV files directly in Excel.
Data Cleaning and Formatting
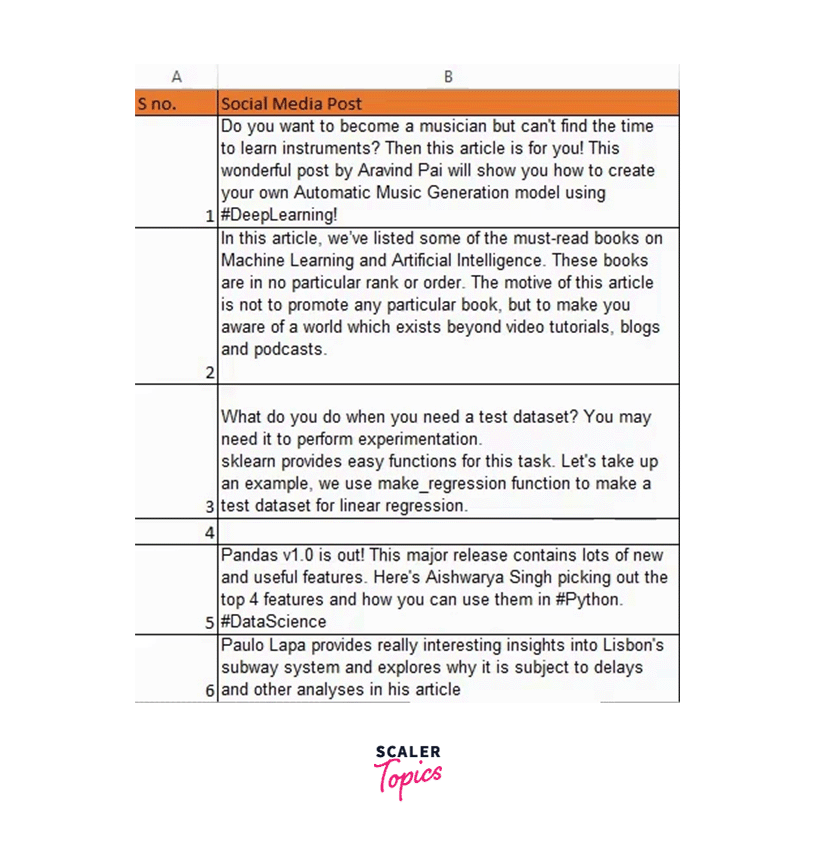
Data we acquire from external sources is undoubtedly not in its most presentable state because it can include some undesirable characteristics. The reason is typical that the text was imported from an application that used characters that our operating system cannot print:
To get rid of line breaks and other unprintable characters, we use the CLEAN() method. To this function, we pass the text that has to be cleaned. Refer to the steps to help you better understand this function:
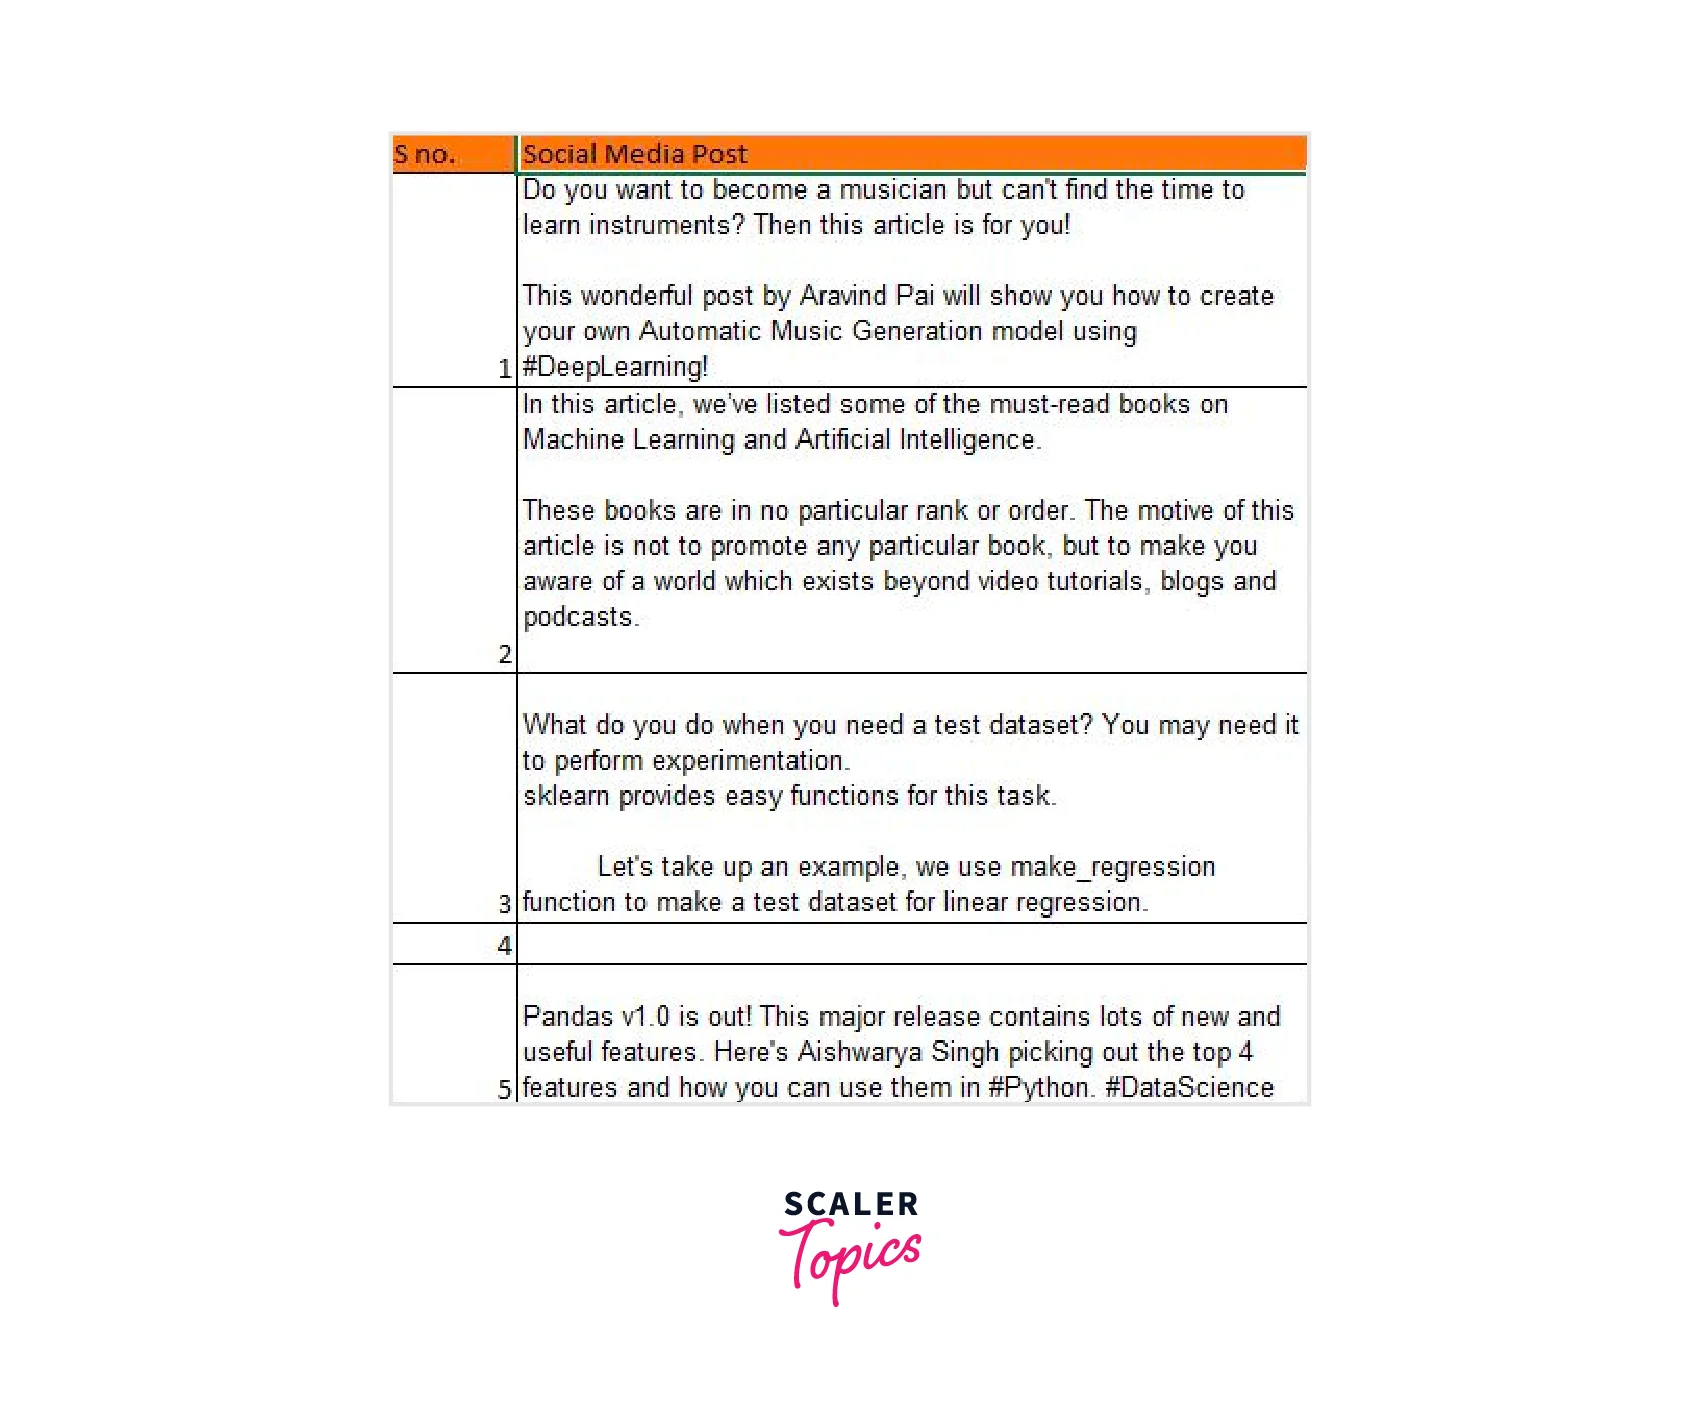
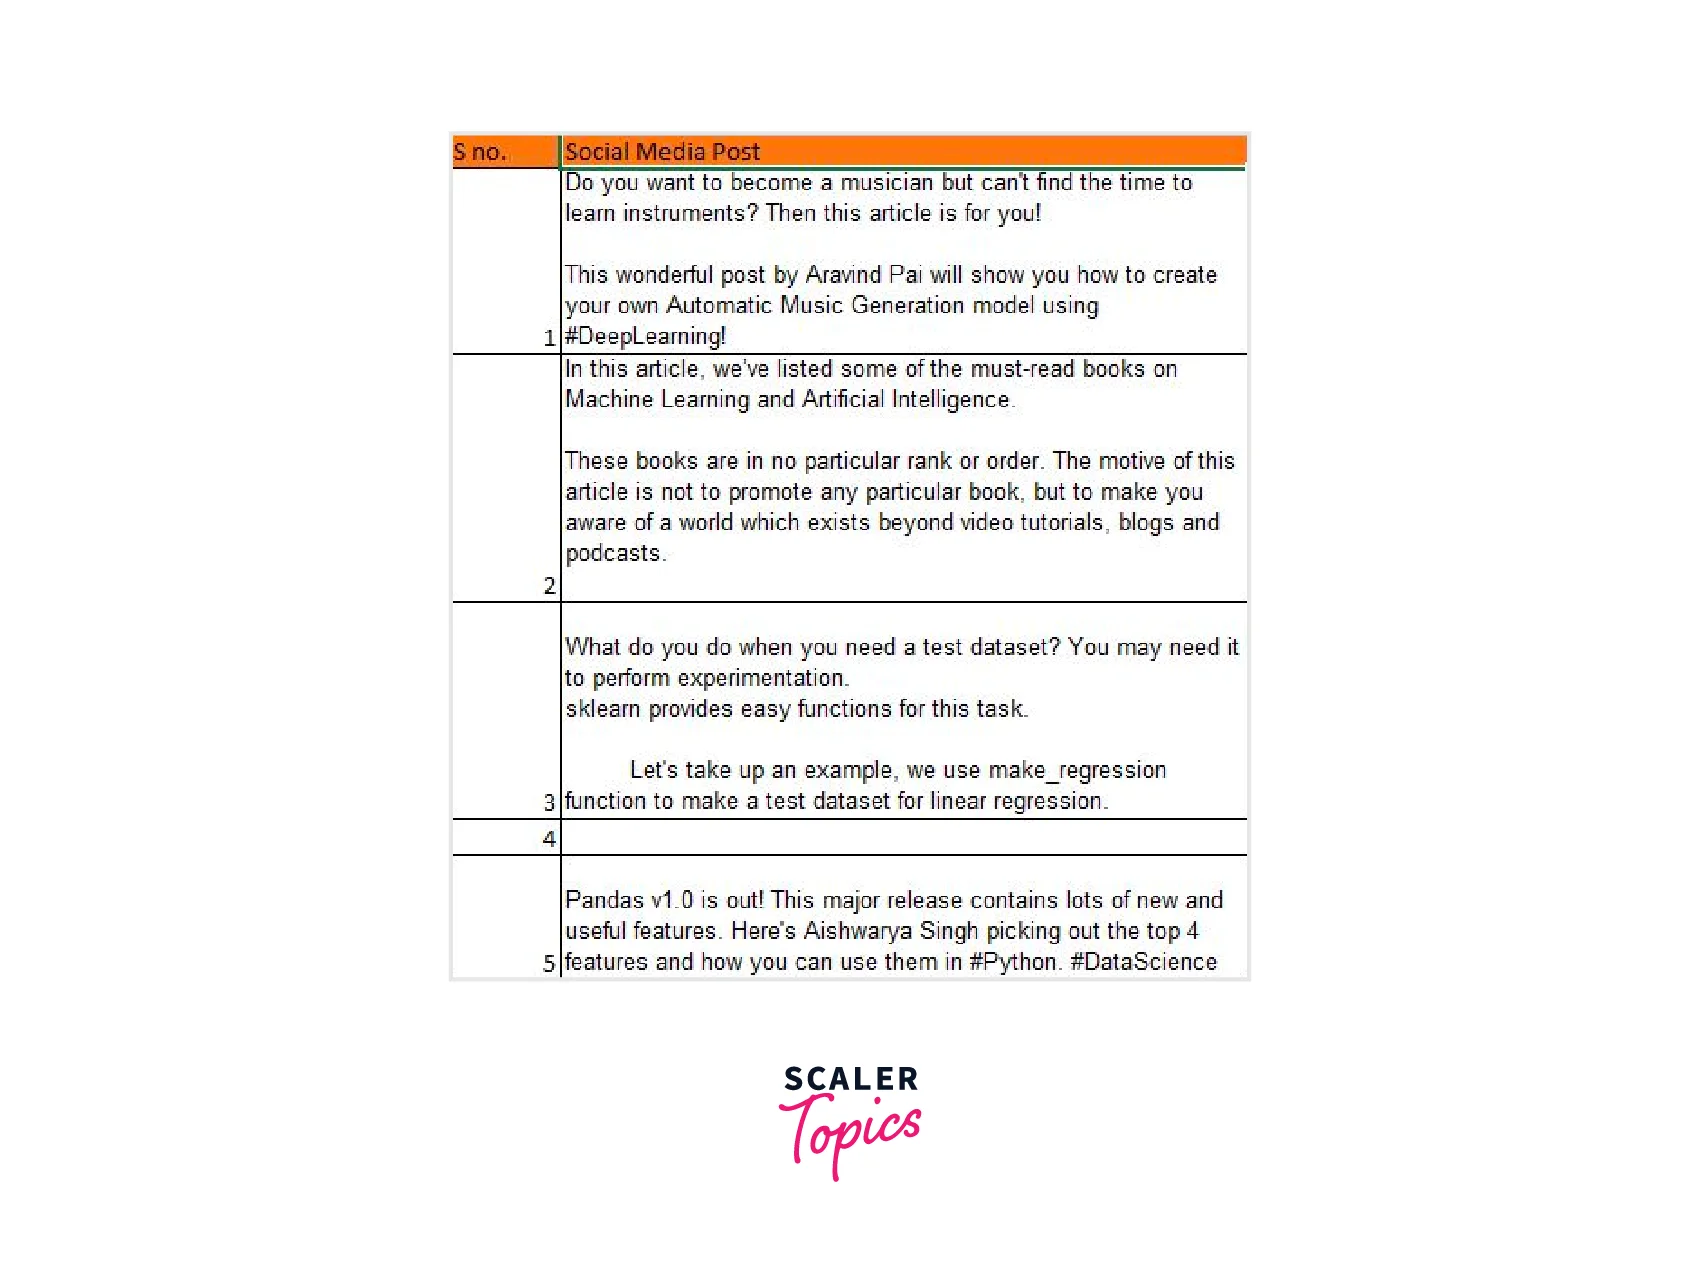
Let's test this out using the social media dataset example where we want to eliminate line breaks. We apply the equation as =CLEAN(C4)
Awesome! We have made progress toward obtaining a clean dataset. But wait, look at how many unnecessary trailing and leading spaces we have. Excel also has a pretty straightforward solution for this.
Checking For Outliers
The occurrence of duplicate values is one of our dataset's most frequent anomalies. These could result from a data-gathering error or just be repeated transactions.
To better grasp this, let's use an example. Suppose you place a Domino's pizza order, which is canceled due to a technological error. You reorder the same pizza. A duplicate transaction has likely been recorded in the system.
One of the easiest tasks, duplicate value handling in Excel, is both straightforward and elegant. So let's investigate.
We will first determine whether or not our table contains duplicate values.
Go to Conditional Formatting -> Highlight cell rules -> Duplicate values:
Here, you can choose any format you want, then click "OK":
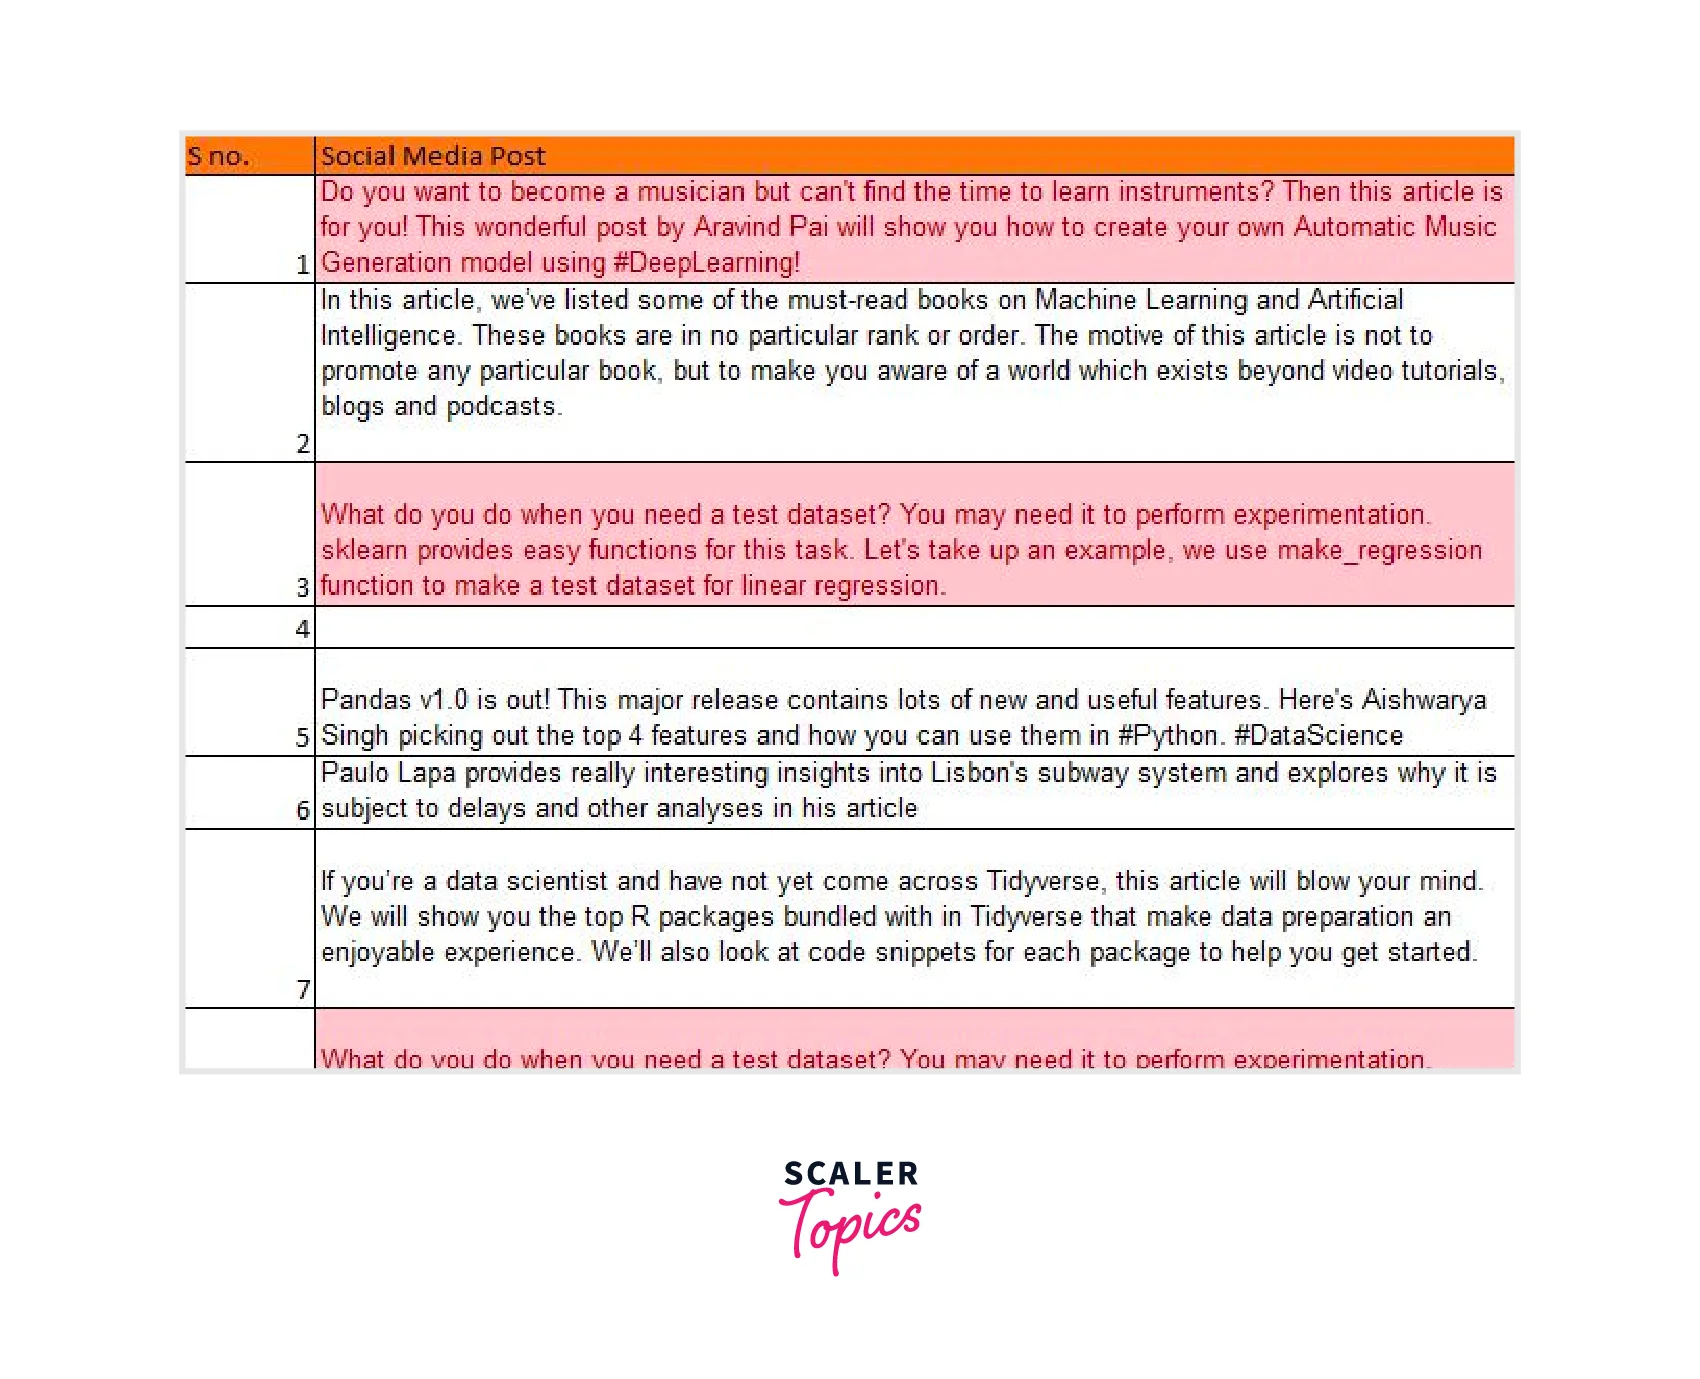
There are two duplicate entries in this field, which indicates that the two posts in question were reposted on the platform. Due to their immense popularity or an ongoing campaign, there is a strong likelihood that these posts will be made again after some time.
It is now time to eliminate the duplicate values you have found. Once again, Excel makes this process extremely straightforward.
Go to Data in the Ribbon -> Select Delete Duplicates:
Which specific column do you wish to use for this task? Excel will ask. Choosing the column, then clicking OK.
 Our tasks are made incredibly simple with Excel! Let's move on to a different crucial data cleansing method.
Handling Missing Data
Although empty cells are frequently seen in datasets, they can cause major problems when statistical modeling is done. Therefore, dealing with them at the start of your analytics project, at the data cleaning step, is best.
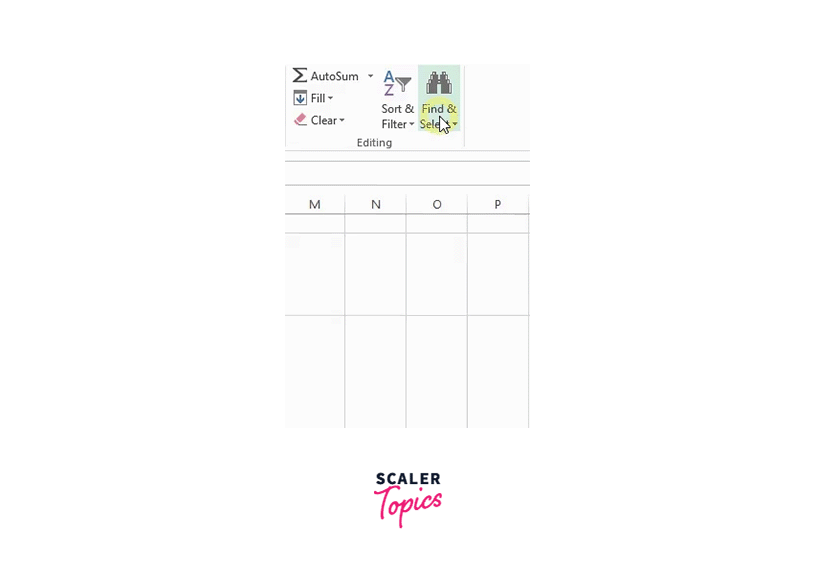
Step 1: Find the empty rows Finding the vacant rows will be the first step. (if there are any).
Go to Find & Select in the Ribbon -> Select Go To Special:
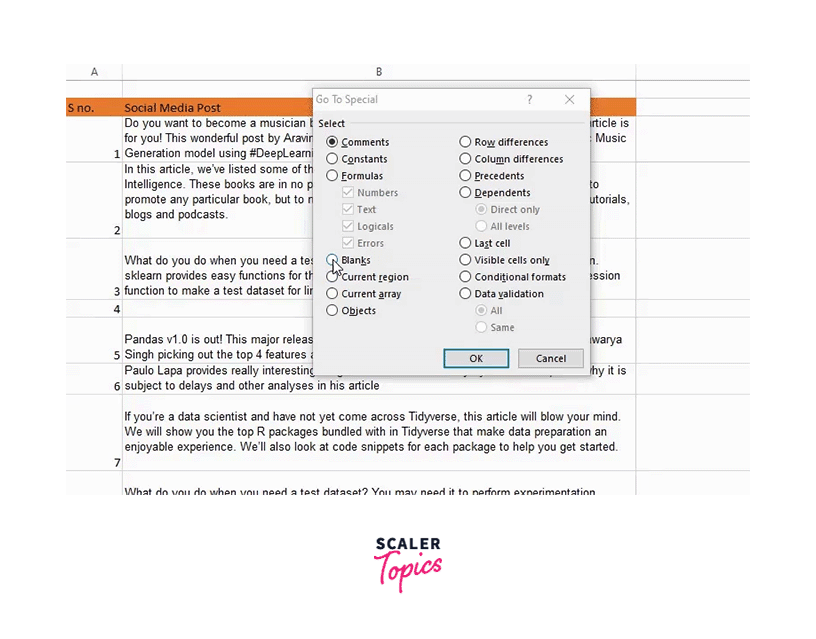
In this instance, we'll choose the option labeled "Blanks:
We will enter "N/A" as the value for our use case.
To fill all the cells at once, type the text and hit CTRL + ENTER. Otherwise, you may press ENTER to enter each value separately (not ideal, of course):
Great! We have already dealt with the empty columns and deleted duplicate values.
The exported data may have extra spaces in addition to any unwanted characters, as we observed in the Excel method above. (as you can see in the below image). It is time to eliminate these many spaces because even though they may not be visible to the human eye, they could cause havoc during analysis:
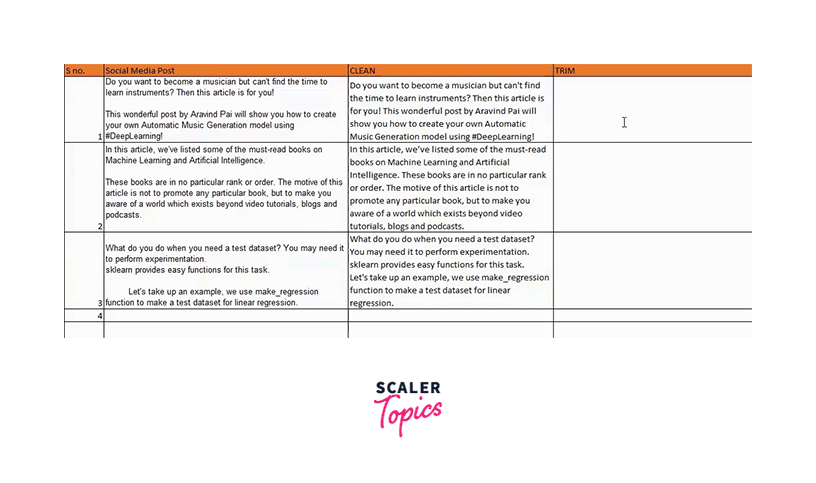
Except for the single spaces between words, all unnecessary spaces in the text are eliminated using Excel's TRIM() function. You can watch the video or follow the instructions below to understand better:
We will enter the text from which we wish to remove the unnecessary spaces. Check out this example by eliminating the extra spaces:
TRIM(C4)
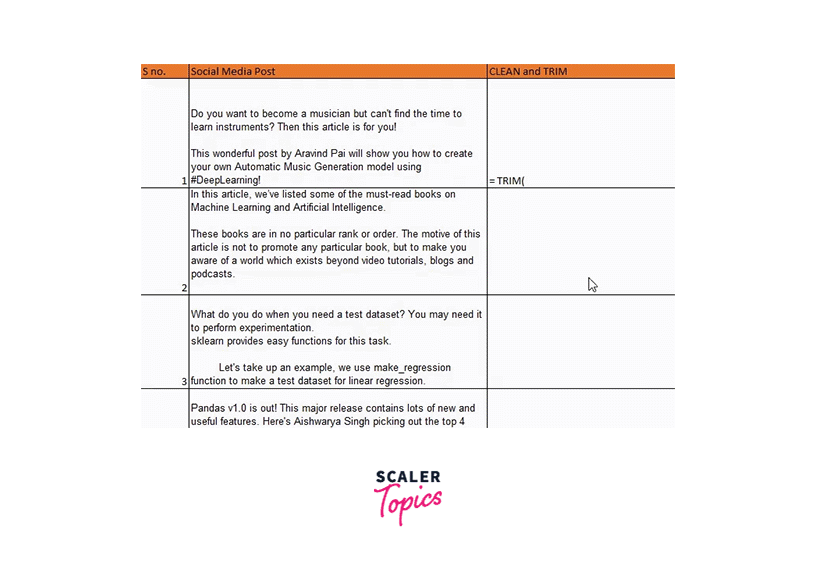
Pro Tip: You can nest the function in the following way rather than applying the CLEAN and TRIM functions separately:
TRIM(CLEAN(C4))
Good job, guys! We have reached the final technique to examine another useful yet simple data cleansing feature in Excel.
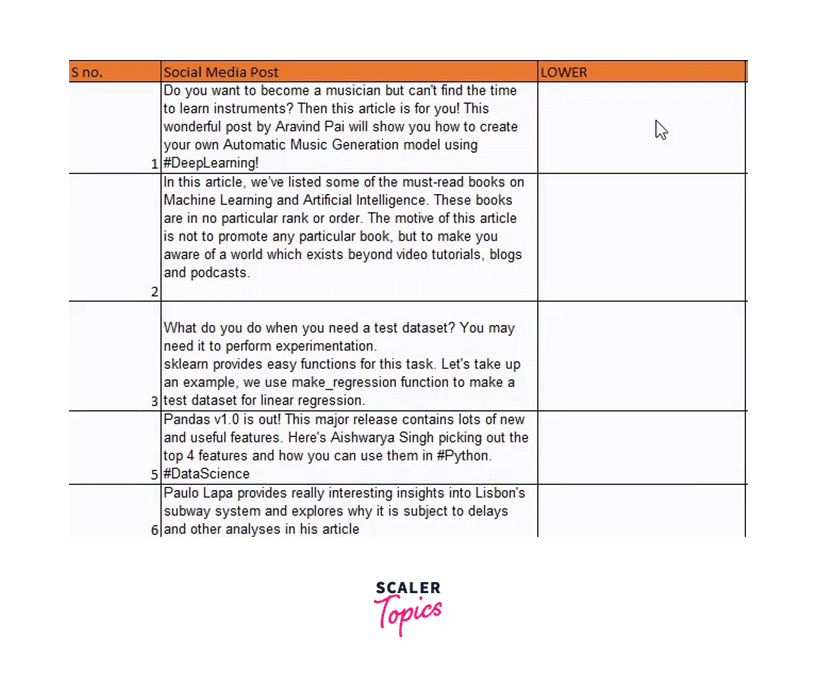
The social media posts in the dataset could be more consistent, as you will see if you pay great attention. Some of them are entirely capitalized, while others are all lowercase. Let's make all of this lowercase to maintain consistency and uniformity.
Use the method LOWER() to do that, then enter the string you want to lowercase:
You can use functions like UPPER() and PROPER(), depending on your use case. Feel free to give these a shot.
Data Transformation and Normalization
Typically, data represented in a table is summarized, sorted, reorganized, grouped, counted, totaled, or averaged using a pivot table.
It enables the conversion of rows into columns and columns into rows. It permits complex calculations and grouping by any field (column).
Although we don't need to normalize any data in this data set, I'll still take an example to understand how it is done.
Standardization can be calculated. Let's assume the list starts with the number X and contains values from y to z.
The first value in the list is denoted by X.
The standardization formula for the value X is;
The Excel formula for this calculation is:
Therefore, we also need to be familiar with the formulas for calculating the mean and standard deviation to formulate this formula.
Data Visualization
We may also make charts to see the values in the dataset visually.
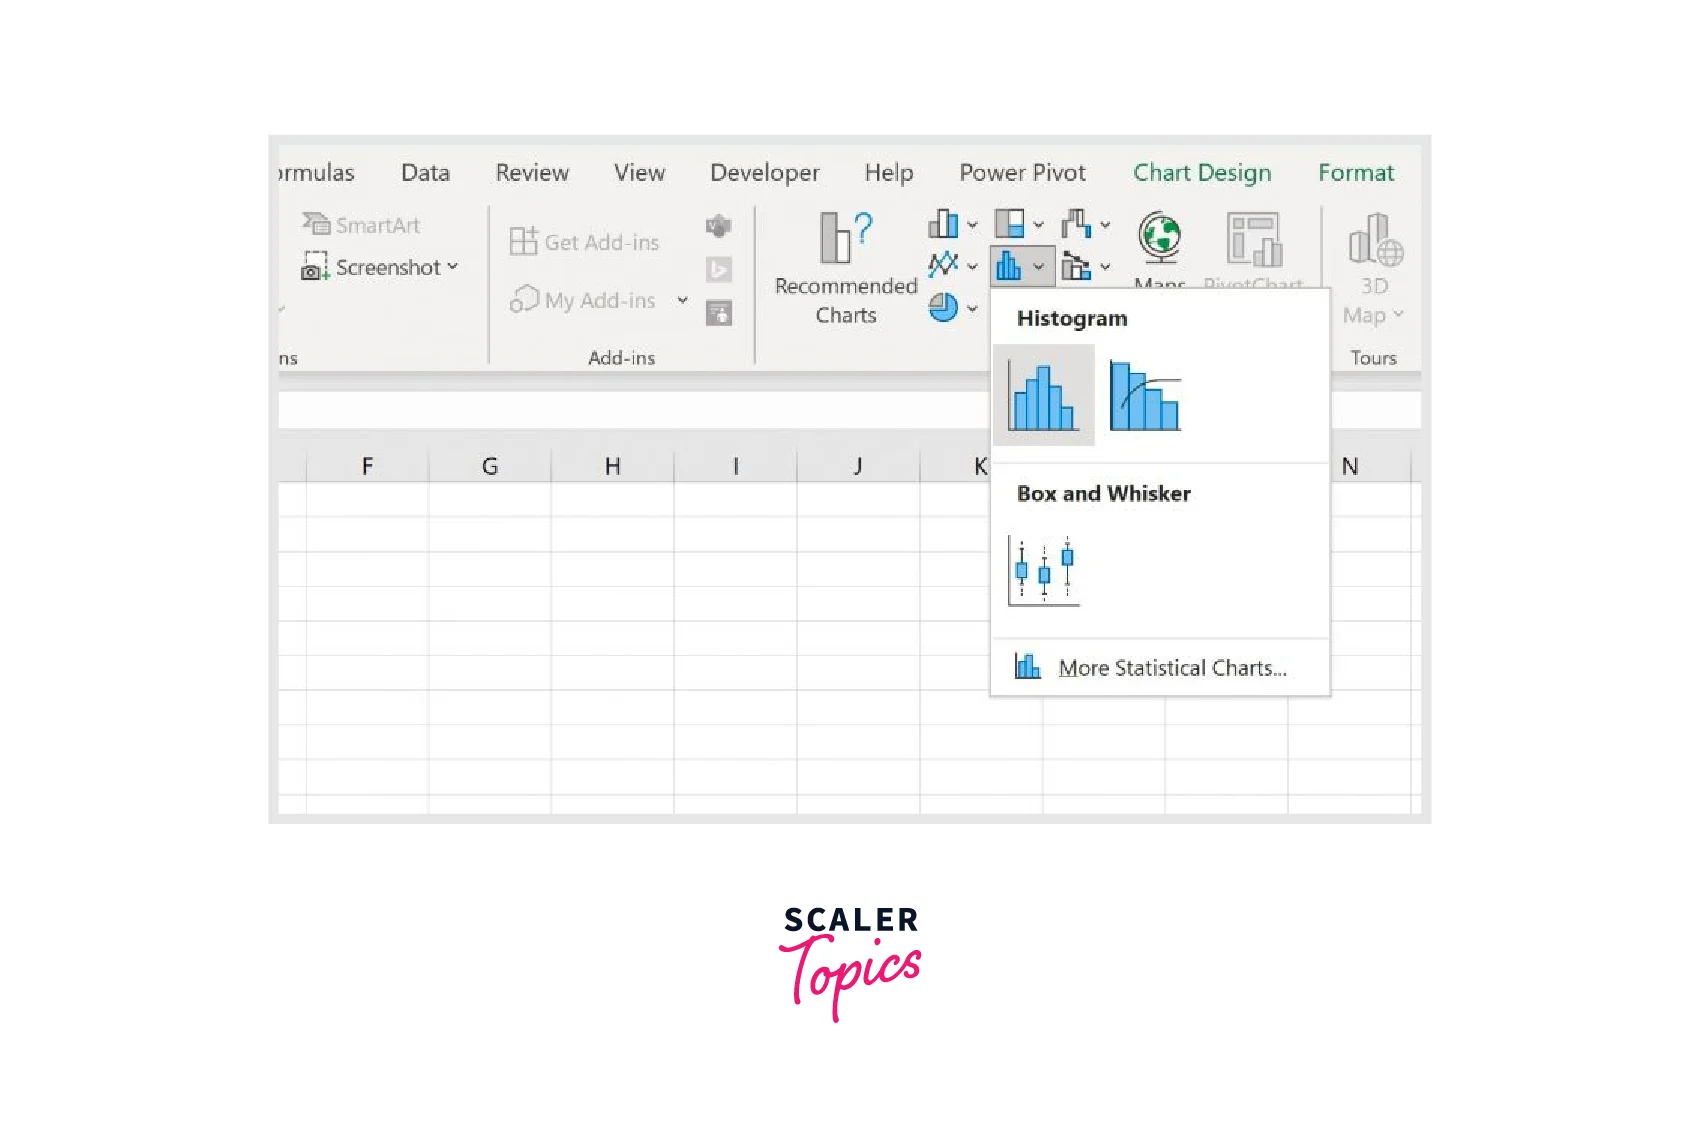
For instance, we can highlight the values in cells B2–B11, select the Insert tab from the top ribbon, and then select the Histogram icon from the Charts group to see how the values for the Points variable are distributed:
The following histogram will be generated automatically.
Exporting data To export data in Excel, follow the steps given below.
- Select Microsoft Office > Excel under File > Export.
- The Excel Export window appears.
- Choose the settings you want to use for the export.
- Click Help in the Export Excel window for further details on the export options.
- Click Export.
Microsoft Excel opens the exported content.
More on Data Preprocessing in Excel
Advanced Excel Functions for Data Preprocessing
TEXTJOIN function A delimiter joins text from two or more strings using the TEXTJOIN function. TEXTJOIN, a new Excel String/Text function, was introduced in Excel 2016.
Formula =TEXTJOIN(delimiter, ignore_empty, text1, [text2], …text_n)
The TEXTJOIN function uses the following arguments:
Delimiter is the string that separates each text value in the output string (mandatory argument). Commas and spaces are the two most widely used delimiters. This option helps determine whether empty cells are included in the output string by specifying whether to ignore empty cells (mandatory argument). Empty values won't be taken into account if the argument is TRUE. If it returns FALSE, the results will also contain empty values. We wish to link the strings: text1, text2,.... text_n. We can combine up to 252 strings using the TEXTJOIN method.
Let's look at a few samples to understand further how this function works.
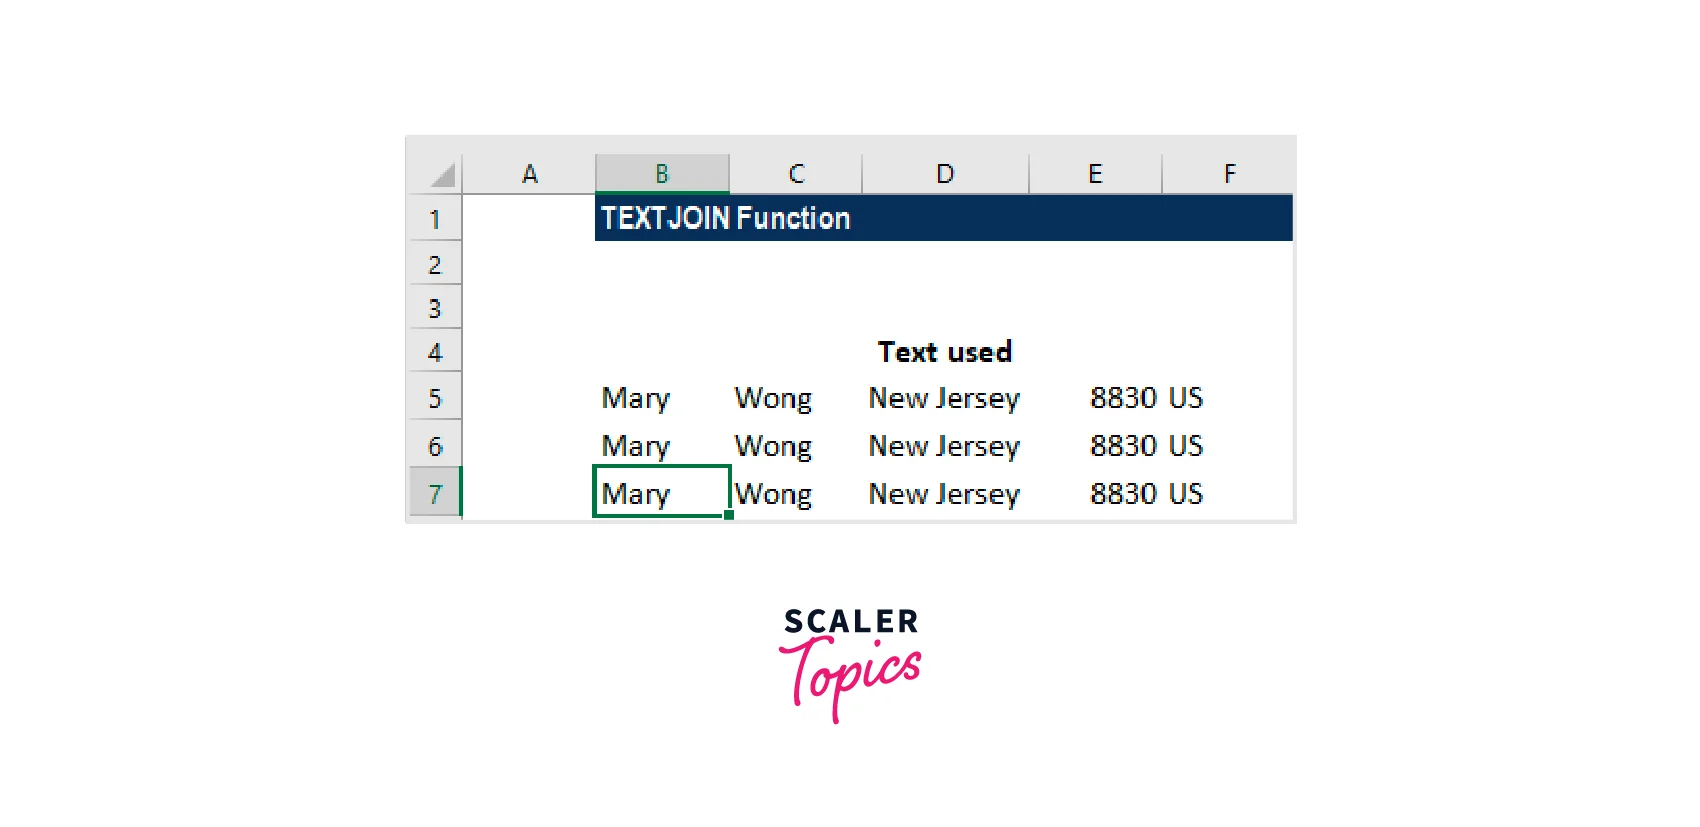
Let's assume, for this example, that information we retrieved from an address is received as follows:
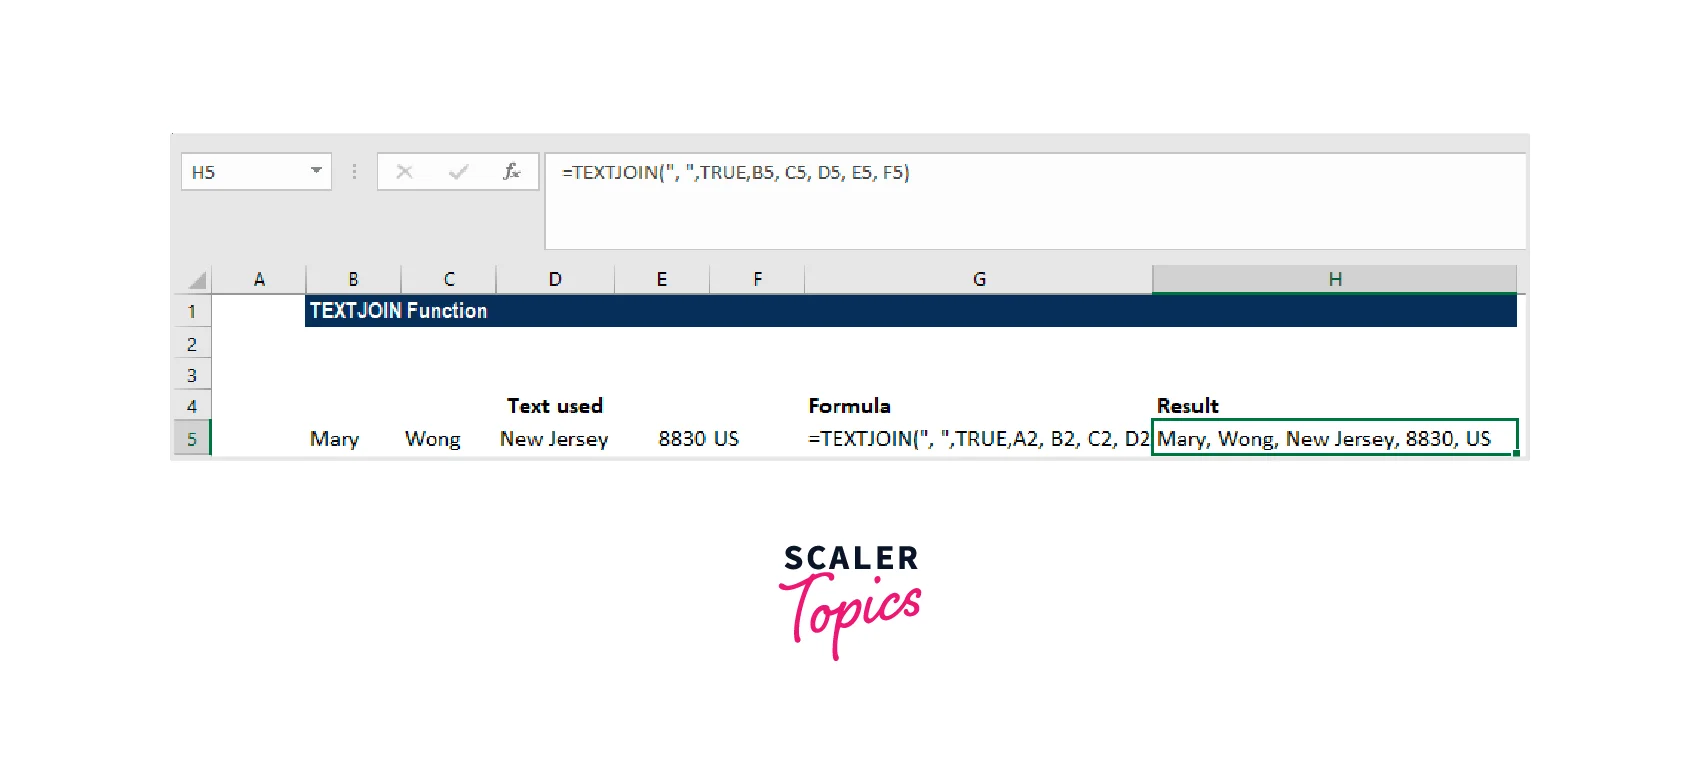
The text strings can be joined using the formula =TEXTJOIN(", ",TRUE, B5, C5, D5, E5, F5), as shown below:
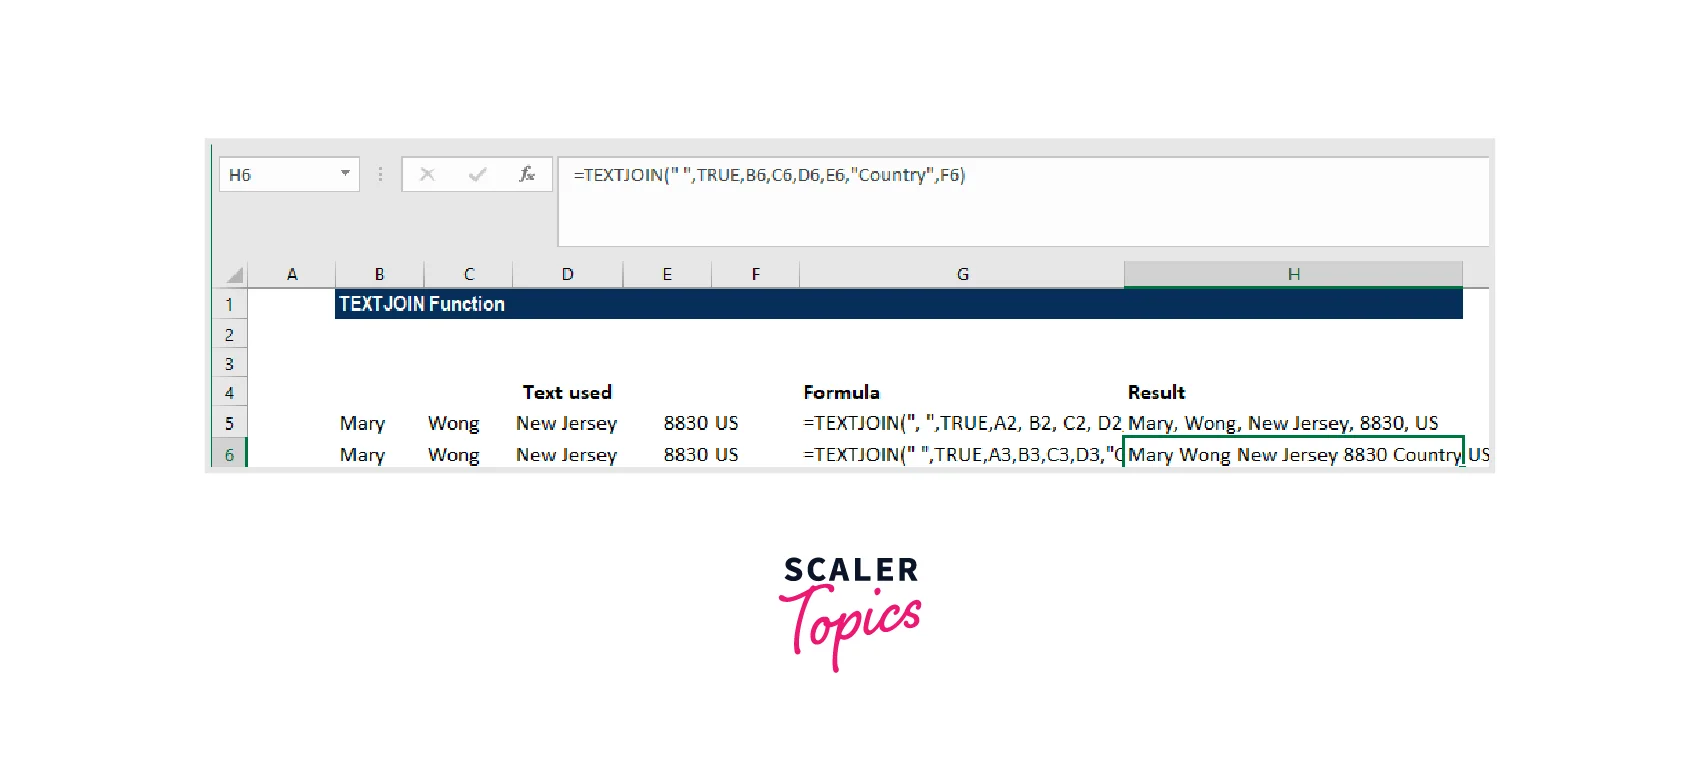
Let's assume we want to add the word "Country" before the US. The equation would then become =TEXTJOIN(" ",TRUE,B6,C6,D6,E6,,"Country",F6).
Using this formula, we will obtain the following outcome:
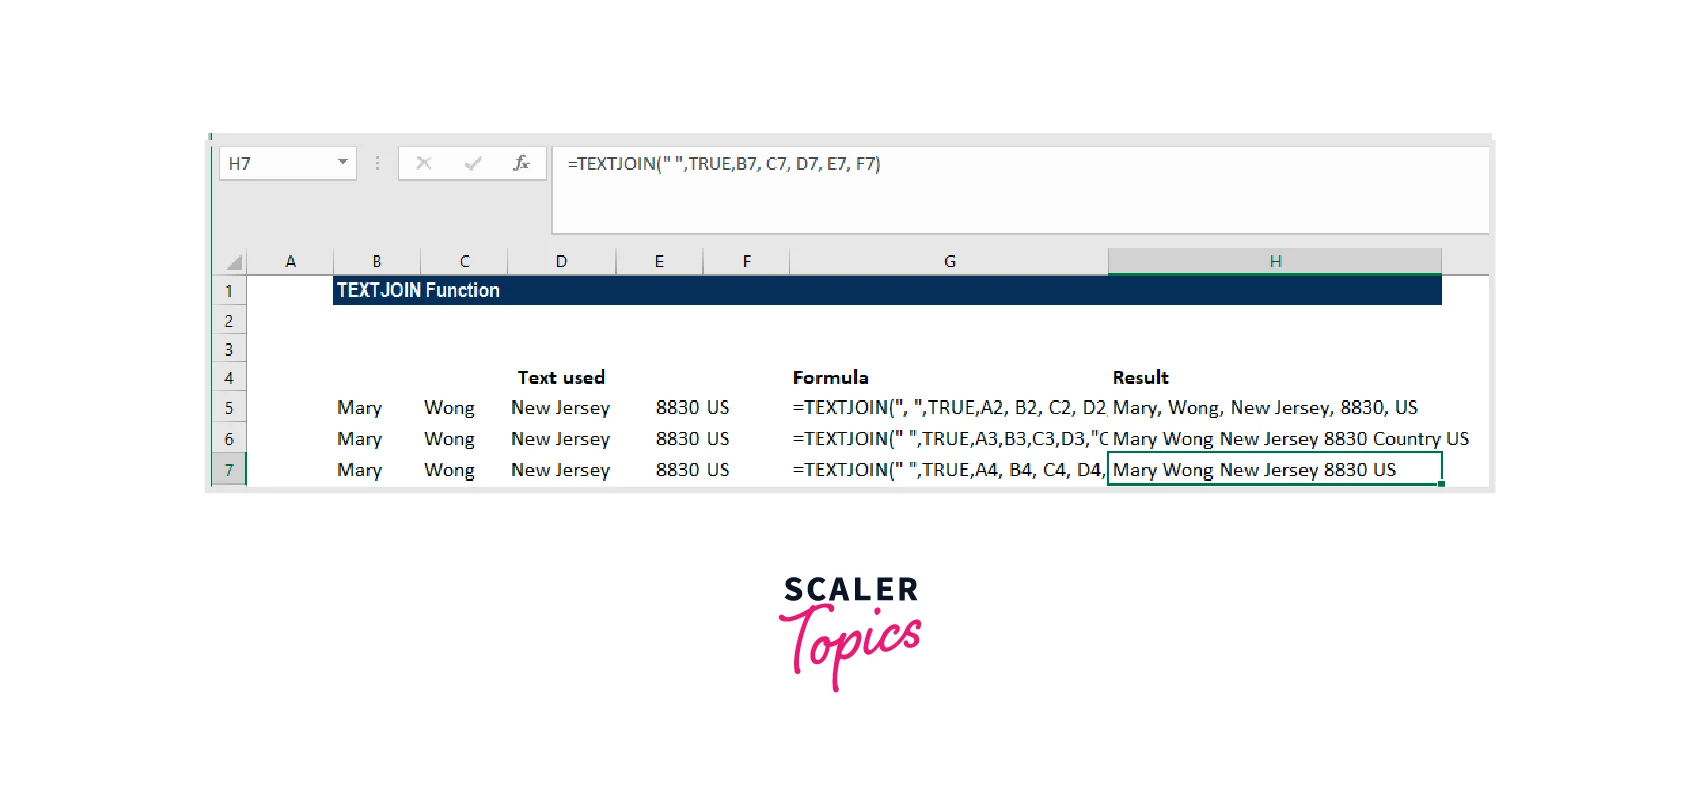
Imagine that we want to use a space as a delimiter. The appropriate formula in this situation is =TEXTJOIN("",TRUE,B7, C7, D7, E7, F7).
IFS Function
A logical function called the IFS Function was added to Excel in 2016. The function is significantly simpler to use than the Nested IF function and serves as an alternative. The IFS function determines whether one or more criteria are met and returns a value if the first TRUE condition is met.
Formula
Where:
The first logical test is called logical_test1. This is because the criteria Excel uses to determine whether the argument is TRUE or FALSE is a required argument. Value1: The outcome if logical_test1 is successful. You can keep it empty if necessary. The value and additional logical_test parameters are optional. The IFS function is used in the function to accept up to 127 logical_test inputs.
It is a built-in Excel function that may be used in worksheets. Let's look at an example:
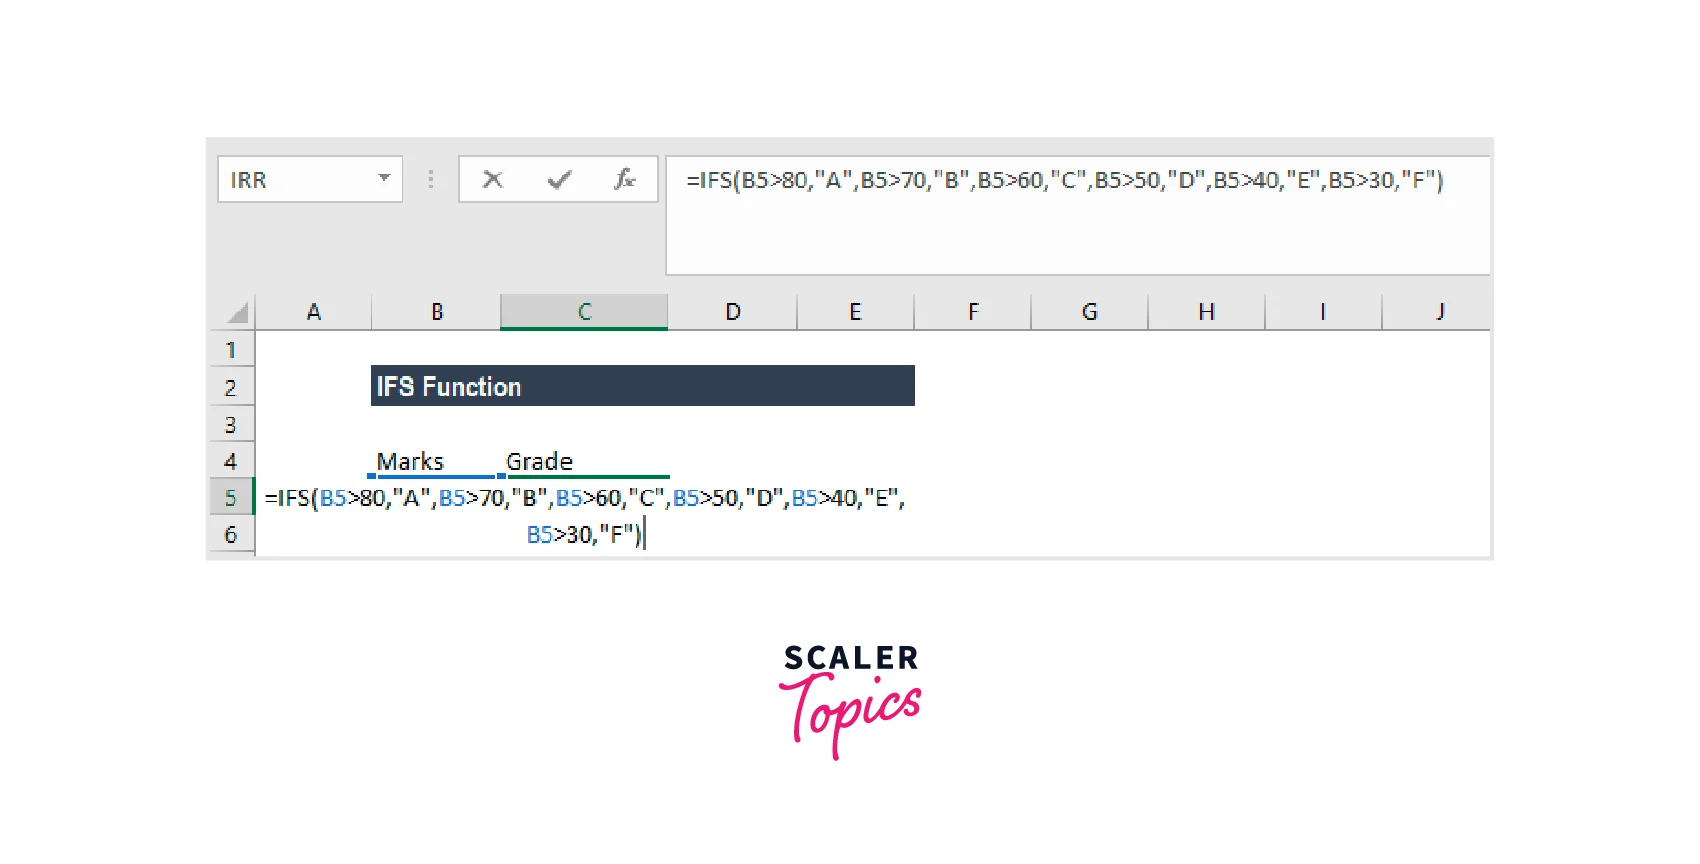
Let's say we want to provide students who receive marks a grade. Then, the IFS Function can be applied in the following ways:
It goes like this:
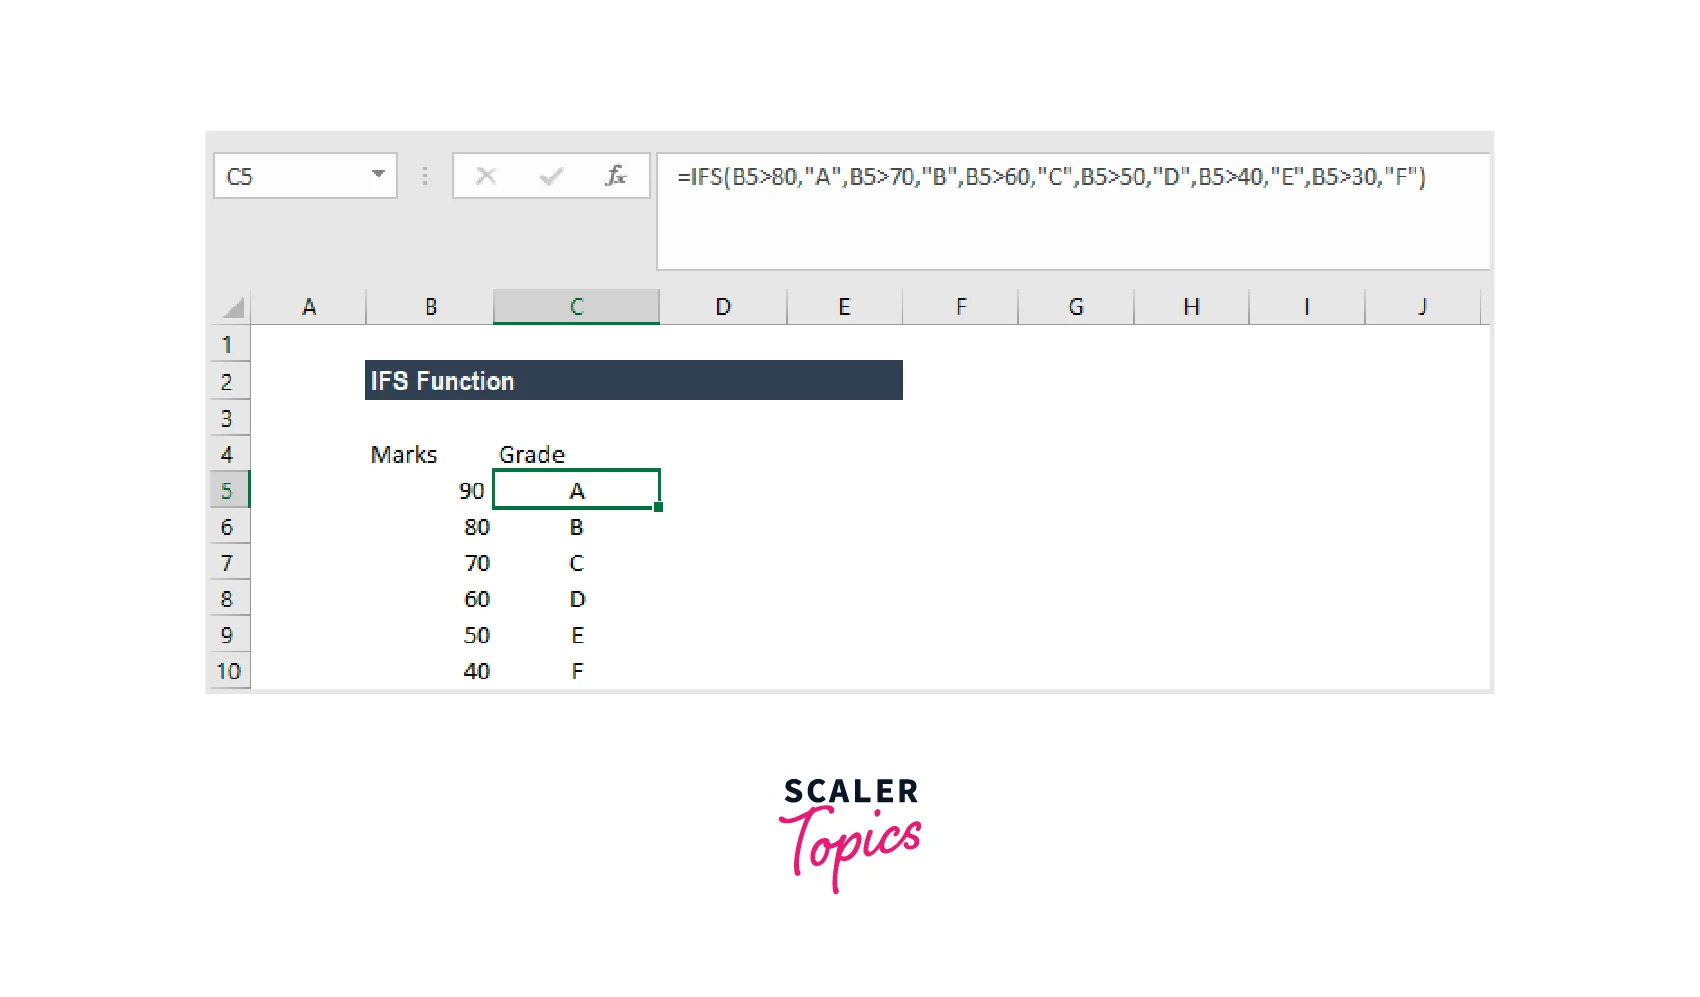
IFS(A2>80, "A", A2>70, "B", A2>60, "C", A2>50, "D", A2>40, "E", A2>30, "F") directs the computer to return an "A" if cell A2 is greater than 80, and so on.
The result of this formula would be:
Power Query for Excel (Get & Transform)
You may use Power Query, an Excel add-in, for ETL. Put another way; you can get data from many sources, modify it, and then input it into the worksheet. Given that it has every option for transforming the data, POWER QUERY can be referred to as a machine for data purification. In addition, it is real-time and records every action you take.
Why Should You Use Power Query?
Different Data Sources: You can import data from various sources, including CSV, TXT, JSON, and others, into a power query editor. Simple Data Transformation: For data transformations, you typically utilize formulas and pivot tables, but with POWER QUERY, you can accomplish a lot with only a few clicks. It's in Real Time: Once you've written a query, you may update it whenever data changes, and it will modify the newly updated data.
Imagine your boss asks you to generate a report using the data from all 100 of your Excel files, each containing information from 100 different cities. OKAY, manually opening each file and copying and pasting the data from them will take you an hour.
However, with the power query, you may finish it quickly.
You need to understand the power query's three-step idea to use it.
Get Data
Power Query enables you to retrieve information from various sources, including the web, CSV, text files, multiple workbooks in a folder, and many other places where data may be kept.
Transform Data
After obtaining the data for the power query, you have a wide range of options for transforming and cleaning it. It generates queries for each action you take. (in a sequence, one step after another).
Load Data
You can import the transformed data into the worksheet via the power query editor or immediately build a pivot table, a pivot chart, or just a data connection.
Conclusion
These Excel functions-based data preparation methods. This article only covers other preprocessing/cleaning methods that can be carried out in Excel using functions. Utilizing a computer language like Python or R is advised if you have programming experience. Excel is one of the best tools for handling structured data for non-programmers.