A/B Testing in Python

Overview
A/B testing is a method that is used to compare two versions of a variable, such as a product or marketing campaign, to determine which one performs better. It is a crucial skill in Data Science and is often used by organizations to make informed decisions about optimizing their products or marketing campaigns to maximize revenue and profit.
Transform Your Career
Choose from our industry-leading programs designed for career success
Modern Software and AI Engineering Program
Master full-stack development with AI integration

Modern Data Science and ML with specialisation in AI
Advanced data science techniques with AI specialization
Advanced AIML with Specialisation in Agentic AI
Deep dive into AIML with focus on Agentic systems
DevOps, Cloud & AI Platform Engineering
Build and manage AI-powered cloud infrastructure
AI Engineering Advanced Certification by IIT-Roorkee
Premier AI engineering certification from IIT-Roorkee
What is A/B Testing?
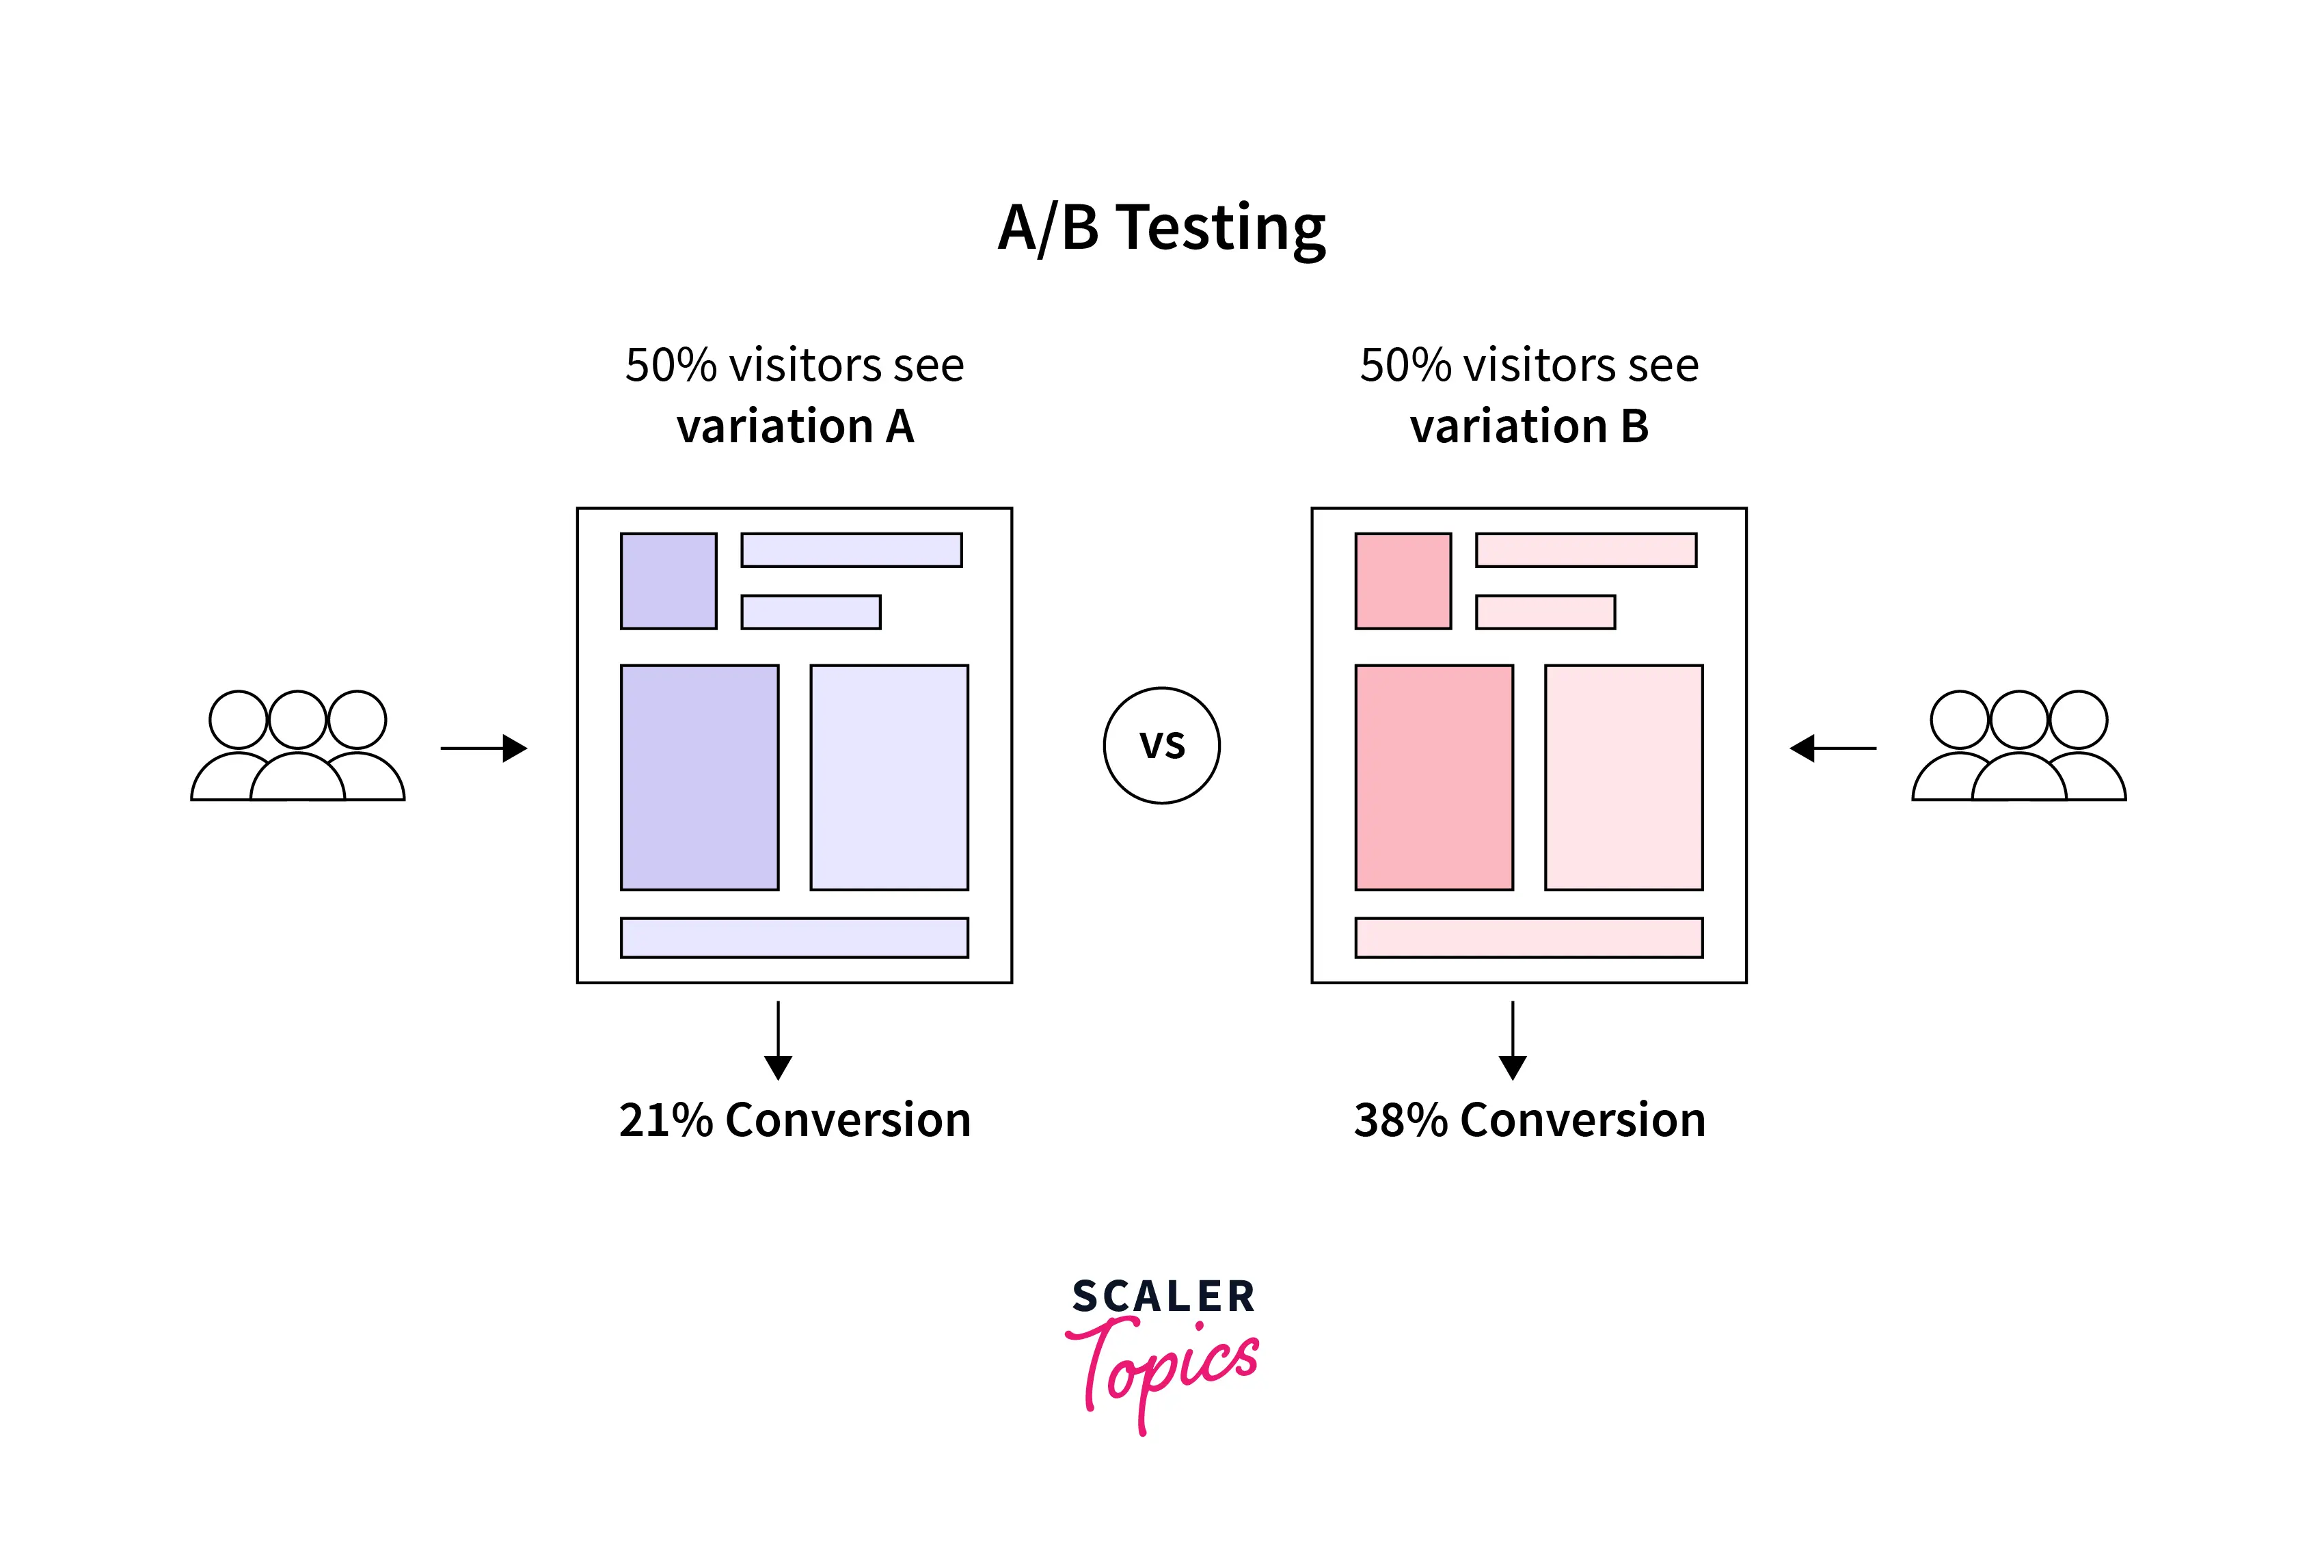
- Suppose an e-commerce company wants to increase the conversion rate or the number of people purchasing its products. They have made significant changes to their website and product landing page. There is no way of predicting how people visiting the new website and landing pages will react and how it will impact the conversion rate. Here A/B testing can help measure which version is more effective at achieving a higher conversion rate.
- A/B testing is a randomized control experiment. In a controlled environment, A/B testing is a statistical method of comparing two versions of a product or service (A and B) to determine which one is more effective. It is prevalent in marketing and product development to optimize a website, mobile app UI, or other products to achieve a specific goal, such as increasing conversion rate, maximizing revenue, increasing sales, etc.
- To conduct an A/B test, the two versions of the product or service, A and B, are created. These two versions are randomly assigned to different sets of users. The test results are compared to determine which version is more effective at achieving the desired goal.
Scaler Placement Report and Statistics
Scaler learners achieved 2.5x salary growth with average post-Scaler CTC reaching ₹23L.
How Does A/B Testing Work?
In this section, with an example, let’s understand the various steps involved in conducting A/B testing to compare two product or service versions to determine which one performs better. Suppose an e-commerce company uses two variants of email in a marketing campaign and wants to determine which variant is more effective in terms of click rate or open rate of the emails.
Define Objective
- The first step in conducting an A/B test is to define the objective of the test. This could be increasing conversion rates, increasing click rates, improving the user experience, etc.
- For example, in our case, our objective is to increase email click or opening rates.
Create Control Group and Test Group
- In this step, we will create two groups of customers, a control group and a test group, that will participate in the A/B testing. Generally, the control group receives the original version, and the test group receives the modified version.
- In our case, we randomly select 10000 customers - 5000 each for our control and test groups. Customers in the control group will receive email variant A, and customers in the test group will receive email variant B.
- Random sampling in creating control and test groups helps eliminate bias as we want the results of A/B testing to be representative of the entire population.
Make a Hypothesis
- Formulating a hypothesis is important in the A/B testing process because it helps guide the test and analyze the results. In this step, we will define two hypotheses - the null hypothesis and the alternative hypothesis.
- In A/B testing, the NULL hypothesis (H0) states that there is no difference between the control and test (variant) groups, and observed results are purely by chance. The alternative hypothesis (Ha) states that there is a significant difference between the control and test (variant) groups.
- In our example, H0 will state that both email variants have no difference in the click rate. Ha will state that the click rate of email variant B is higher than email variant A.
Conduct A/B Test and Collect Data
- In this step, A/B testing is conducted, and relevant data is collected for both control and test groups. For example, after running the A/B test in our case, we collected mean click rate or opening rate data for both groups. Suppose the control group's average click rate is 23%, and for the test group, the average click rate is 29%.
Statistical Significance of the Test
- In our case, as the average click rate is higher in the test group, can we directly conclude that the email variant received by the test group works better compared with the email variant received by the control group? The answer is No!
- We need to prove that the results of A/B testing are statistically significant. It means that the difference between your control and test versions is not due to some error or random chance. The two-sample t-test is one of the most common tests to prove the statistical significance of the results.
- To perform the two-sample t-test, we need to be familiar with the below terms -
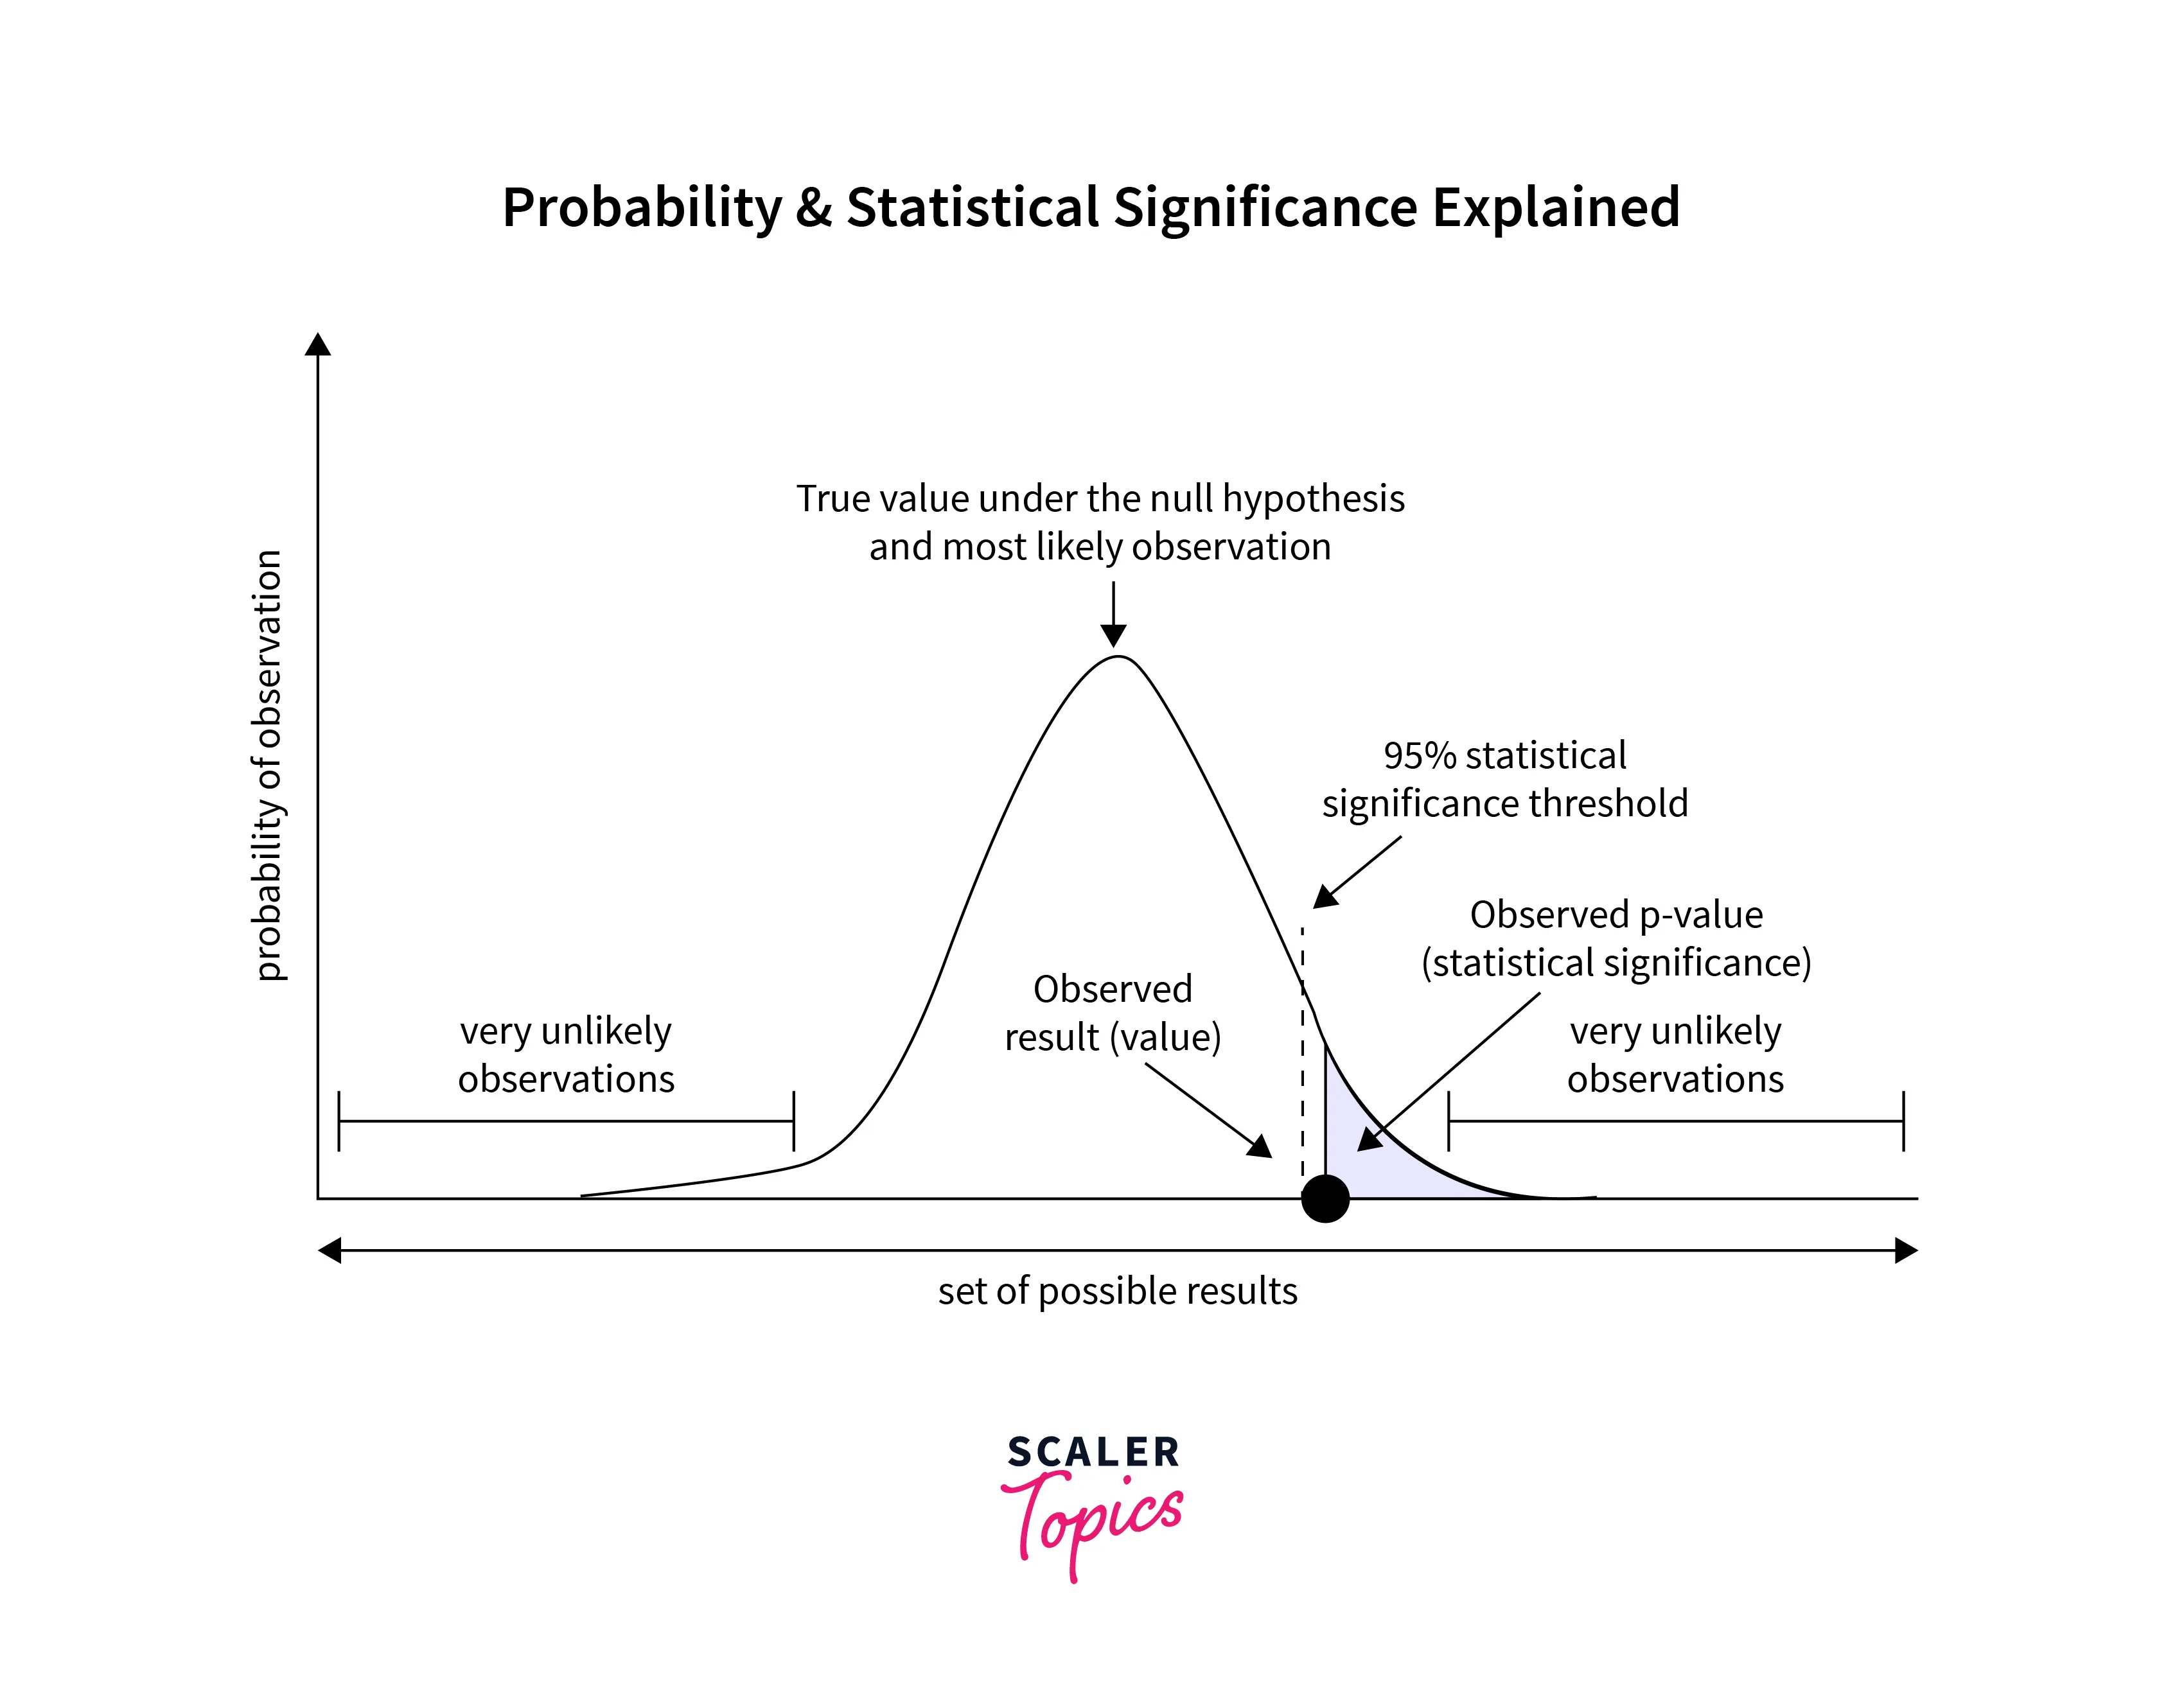
- Significance level - The significance level, also known as the alpha level, is a probability threshold to determine whether the results of a test are statistically significant. Generally, it is set at 0.05 in statistical tests.
- It is essentially the probability threshold of the case when we reject the null hypothesis. For example, a 0.05 significance level means that the probability of observing data/results must be less than 0.05 for the results to be statistically significant. It is denoted by alpha (α).
- P-Value - P-value is the probability of obtaining given observations or results, given that the null hypothesis is true. If the p-value is less than the significance level (alpha level) that was set before the study, then the null hypothesis is rejected, and the results are considered statistically significant.
- Confidence Interval - A Confidence Interval is a range of reasonable values for a population statistic based on sample data. In a t-test, the confidence interval estimates the possible range of population mean based on the sample mean and standard deviation.
- After this, we can calculate the t-test score based on the formula mentioned below. After calculating the t-test score, we compare it to a t-distribution to compute the p-value to determine whether the difference is statistically significant.
Turn Learning into Career Growth
Mistakes We Must Avoid While Conducting the A/B Test
There are several mistakes that researchers and analysts should avoid while conducting an A/B test:
- No clear hypothesis - It is essential to have a clear hypothesis about what you expect in the results of the A/B testing. Without a clear hypothesis, it is difficult to interpret the test results.
- Not large enough sample size - A/B testing should be conducted with a large enough sample size to ensure that the results are statistically significant.
- Not considering external factors - External factors, such as changes in the market or seasonality, can affect the results of A/B testing. It is essential to control for these factors to get accurate results from A/B testing.
- Not running the test for a long enough period - It is important to run the A/B testing for a long enough period of time to get reliable results.
- Ignoring statistical significance tests - It is important to analyze the results of the A/B testing carefully and to use statistical techniques to determine whether the results are statistically significant.
When to Use A/B Testing
- A/B testing is helpful when you want to make incremental changes to a product, website, app, or marketing campaign and want to test whether the incremental change will have a positive, negative, or no effect on a specific business metric, such as conversion rate, click-through rate, etc.
- A/B testing does not work well when you want to test major changes, such as new products, branding, UI, etc.
Implementation
Let’s implement A/B testing in Python on a sample dataset. This dataset can be downloaded from here.
Output:
This dataset contains user IDs, session timestamp of accessing the landing page, and information on whether the user belongs to the control or the treatment group, converted or not. This dataset contains multiple session data for some users. We will remove users with multiple sessions from our testing.
Next, we will randomly sample 5000 users' data from each group and perform the statistical significance test.
Output
Output
As you can see, p-value for the A/B testing results is 0.252. If we set the significance level at 0.05, then we can’t reject the NULL hypothesis at this p-value. It means that observed results have occurred due to random chance and are not statistically significant to say that the landing page of the treatment group works better.
Conclusion
- A/B testing compares two versions of a product, website, app, or marketing campaign to determine which one performs better. It is useful in a situation when you want to test the effectiveness of incremental changes in a product, website, or app.
- Post conducting A/B testing, we need to prove that the results are statistically significant. It means that the observed results are not due to some random chance.