Covariance and Correlation

Overview
Covariance and Correlation are mathematical concepts in probability theory and statistics that are frequently used to analyze the relationship between two numerical variables. These two concepts are different but related to each other. Covariance represents how two variables change with respect to each other, and correlation represents how two variables change with respect to each other, but it also explains how strong the relationship between two variables is. In this article, we will compare covariance vs. correlation and understand the difference between covariance and correlation.
What Is Covariance?
Covariance is a statistical concept that describes the systematic relationship between two random variables, where a change in one variable is reflected in the other variable.
The value of covariance can range from -∞ to +∞. A positive value indicates a positive relationship, meaning that as one variable increases, the other variable tends to increase as well. Conversely, a negative value indicates a negative relationship, where as one variable increases, the other variable tends to decrease.
While covariance is useful for determining the type of relationship between variables, it is not ideal for interpreting the magnitude of the relationship.
Scaler Placement Report and Statistics
Scaler learners achieved 2.5x salary growth with average post-Scaler CTC reaching ₹23L.
Types of Covariance
Covariance can take either a positive or negative value, leading to its classification into two types:
-
Positive Covariance: A positive covariance between two variables indicates that they move in the same direction. In other words, when one variable has higher or lower values, the other variable tends to have correspondingly higher or lower values. This positive covariance suggests that the variables exhibit similar behavior.
-
Negative Covariance: Conversely, negative covariance occurs when two variables move in opposite directions. It is the inverse of positive covariance, where higher values of one variable correspond to lower values of the other variable, and vice versa. Negative covariance suggests an inverse relationship between the variables.
Scaler Placement Report and Statistics
Scaler learners achieved 2.5x salary growth with average post-Scaler CTC reaching ₹23L.
Covariance Matrix
A covariance matrix is a square matrix that represents the variability of elements within a dataset and the relationships between pairs of datasets. Variance, which measures the spread of data around the dataset's mean, is used to quantify the dispersion. Covariance, on the other hand, assesses how two variables vary in tandem.
Transform Your Career
Choose from our industry-leading programs designed for career success
Modern Software and AI Engineering Program
Master full-stack development with AI integration

Modern Data Science and ML with specialisation in AI
Advanced data science techniques with AI specialization
Advanced AIML with Specialisation in Agentic AI
Deep dive into AIML with focus on Agentic systems
DevOps, Cloud & AI Platform Engineering
Build and manage AI-powered cloud infrastructure
AI Engineering Advanced Certification by IIT-Roorkee
Premier AI engineering certification from IIT-Roorkee
Applications of Covariance
A few of the most common applications of Covariance include -
- Covariance is used to perform Principal Component Analysis, which is further used to reduce the features in a given dataset.
- Covariance is used to measure certain DNAs in Genetics and Molecular Biology.
- Forecasting investment amounts in various assets in financial markets.
- Analyzing astronomical/oceanographical data and observations.
What Is Correlation?
Correlation is a statistical concept that is used to determine the strength of the relationship between two numerical variables.
To understand the difference between covariance and correlation, let's now them one by one. While Covariance measures how two variables differ with respect to each other, correlation also measures the magnitude of the relationship. This is one of the major comparison for covariance vs. correlation.
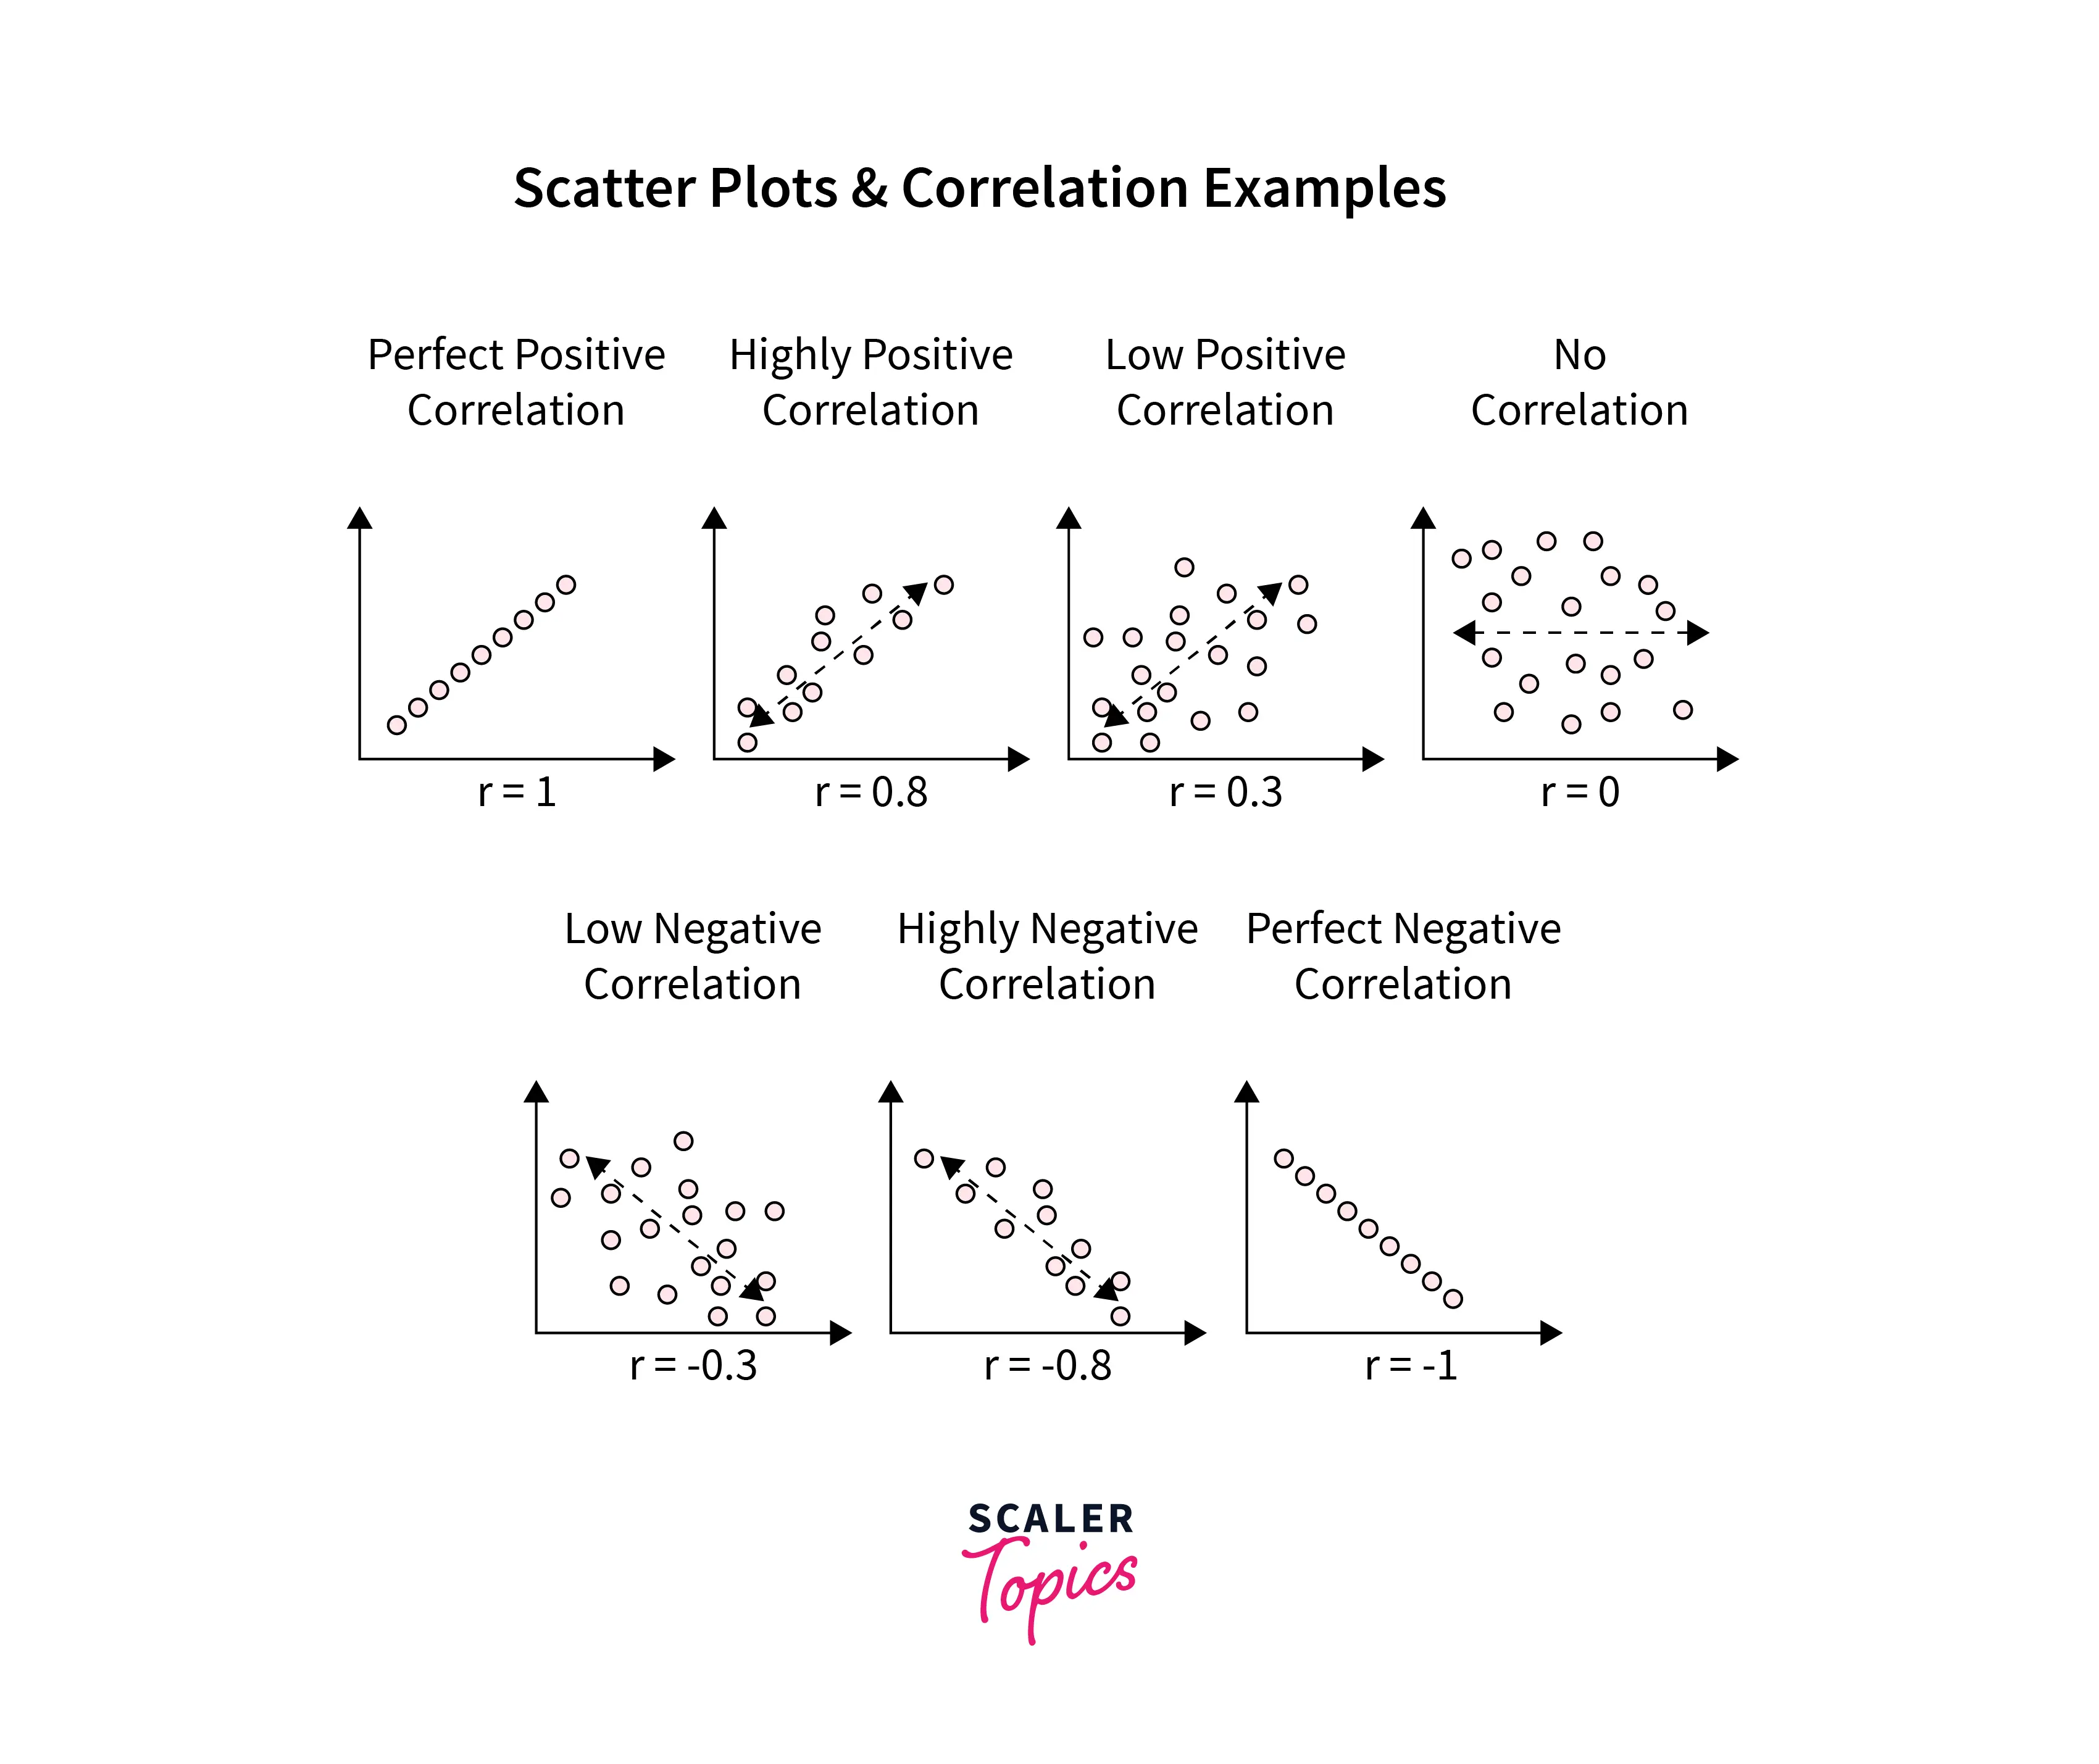
Correlation can range between (-1,1). A correlation value greater than zero represents a positive relationship, while a value less than zero indicates a negative relationship.
A correlation value of 1 means a perfect positive correlation, and a correlation value of -1 represents the perfect negative correlation between the two variables.
The formula for correlation is shown below -
Where,
- covariance of and
- standard deviation of
- standard deviation of
Types of Correlation
Correlation can be classified into three types:
-
Simple Correlation: Simple correlation quantifies the degree of relationship between two variables using a single number.
-
Partial Correlation: Partial correlation helps unveil the correlation between two variables by removing the effects of a third variable.
-
Multiple Correlation: Multiple correlation is a statistical technique that utilizes two or more variables to predict the value of a single variable.
Correlation Matrix
A correlation matrix is a table consisting of correlation coefficients that depict the relationships between various variables. Each cell in the matrix represents the connection between two variables. A correlation matrix serves multiple purposes, such as summarizing data, serving as input for advanced analysis, or acting as a diagnostic tool for further studies.
When constructing a correlation matrix, important factors to consider include selecting an appropriate correlation statistic, coding the variables correctly, handling missing data, and determining the best way to present the matrix.
Applications of Correlation
The most common applications for Correlation include -
- Identify related variables in a dataset. It can further help improve the accuracy of the developed ML models.
- Identifying various factors across industries. For example, time vs. money spent in E-Commerce, weather forecasting, etc.
- Prevalent in pattern recognition
Turn Learning into Career Growth
Covariance vs. Correlation
Let’s review the differences between Covariance vs. Correlation in the below table -
| Factor | Covariance | Correlation |
| Definition | Covariance is used to compute the joint variability of two variables, i.e., how these two variables differ with respect to each other. | In addition to measuring joint variability, correlation also provides the magnitude of the relationship between two variables |
| Output | Direction only | Direction and Magnitude |
| Values Range | -∞ and +∞ | -1 and +1 |
| Change in Scale | Affects covariance | No change in correlation |
How to Calculate Covariance and Correlation?
- Covariance between two variables can be computed using the formula mentioned in previous sections. One can calculate the Covariance between variables X and Y using the below formula
Methods of Calculating the Correlation
The Graphic Method
- In the graphic method, values for two variables, X and Y, are plotted on the X-axis and Y-axis, respectively. After plotting, one can determine the direction of correlation based on the observed linear or non-linear relationships between variables.
- This method can only indicate the direction of correlation, not the numerical magnitude.
The Scatter Method
- It is similar to the graphic method. In this method, the scatter plot is drawn based on values in variables X and Y. Once a scatter plot is drawn, a correlation can be determined between the two variables.
- If dots are moving upward from left to right, the correlation is positive. If the dots move in a downward direction from left to right, the two variables are negatively correlated.
Karl Pearson Coefficient of Correlation
- This is the most common method to calculate the correlation coefficient between two variables. It is also a default method to compute correlation in many programming languages. Using this method, correlation can be computed using the below formula -
Where,
- mean of variable
- mean of variable
Coefficient of Concurrent Deviation
- Concurrent deviation method is a very simple method to measure the correlation between two variables.
- Under this method, we consider only the directions of deviations or how they differ from each other. The magnitudes of the values are ignored. Therefore, this method is useful when we are interested in analyzing the correlation between two variables in a casual manner and not in high precision.
Where,
- number of pairs of positive concurrent deviations
- ( is the total number of data pairs)
Spearman’s Rank Correlation Coefficient
- Karl-Pearson method to compute correlation assumes Gaussian-like distribution of the data, while the Spearman method does not assume Gaussian distribution for the variables.
- Correlation between two variables using Spearman’s Rank method can be computed using the formula mentioned below -
Where,
- = Spearman's rank correlation coefficient
- difference between the two ranks of each
- = number of observations
FAQs
Q. How can covariance and correlation be used in data analysis?
A. Covariance and correlation matrices provide insights into the relationships between multiple variables in a dataset.
Q. What does a positive covariance mean?
A. A positive covariance indicates that two variables tend to move in the same direction. When one variable has above-average values, the other variable also tends to have above-average values.
Q. What does a negative covariance mean?
A. A negative covariance suggests that two variables tend to move in opposite directions. When one variable has above-average values, the other variable tends to have below-average values.
Q. What does a correlation coefficient of 0 means?
A. A correlation coefficient of 0 means that there is no linear relationship between the variables. In other words, changes in one variable do not correspond to changes in the other variable.
Q. What does a correlation coefficient of 1 mean?
A. A correlation coefficient of 1 indicates a perfect positive linear relationship between the variables. This means that as one variable increases, the other variable also increases proportionally.
Conclusion
- Covariance and Correlation are one of important statistical concepts that are used to analyze relationships between each other, i.e., how variables change with respect to each other. Covariance only provides the direction of the relationship, while correlation also provides magnitude in addition to direction. There are some major difference between covariance and correlation which we have successfully compared in the Covariance vs. Correlation section.
- In Data Analytics, these methods are frequently used in EDA, pattern recognition, feature reduction (PCA), etc.