Data Aggregation and Interpolation

Overview
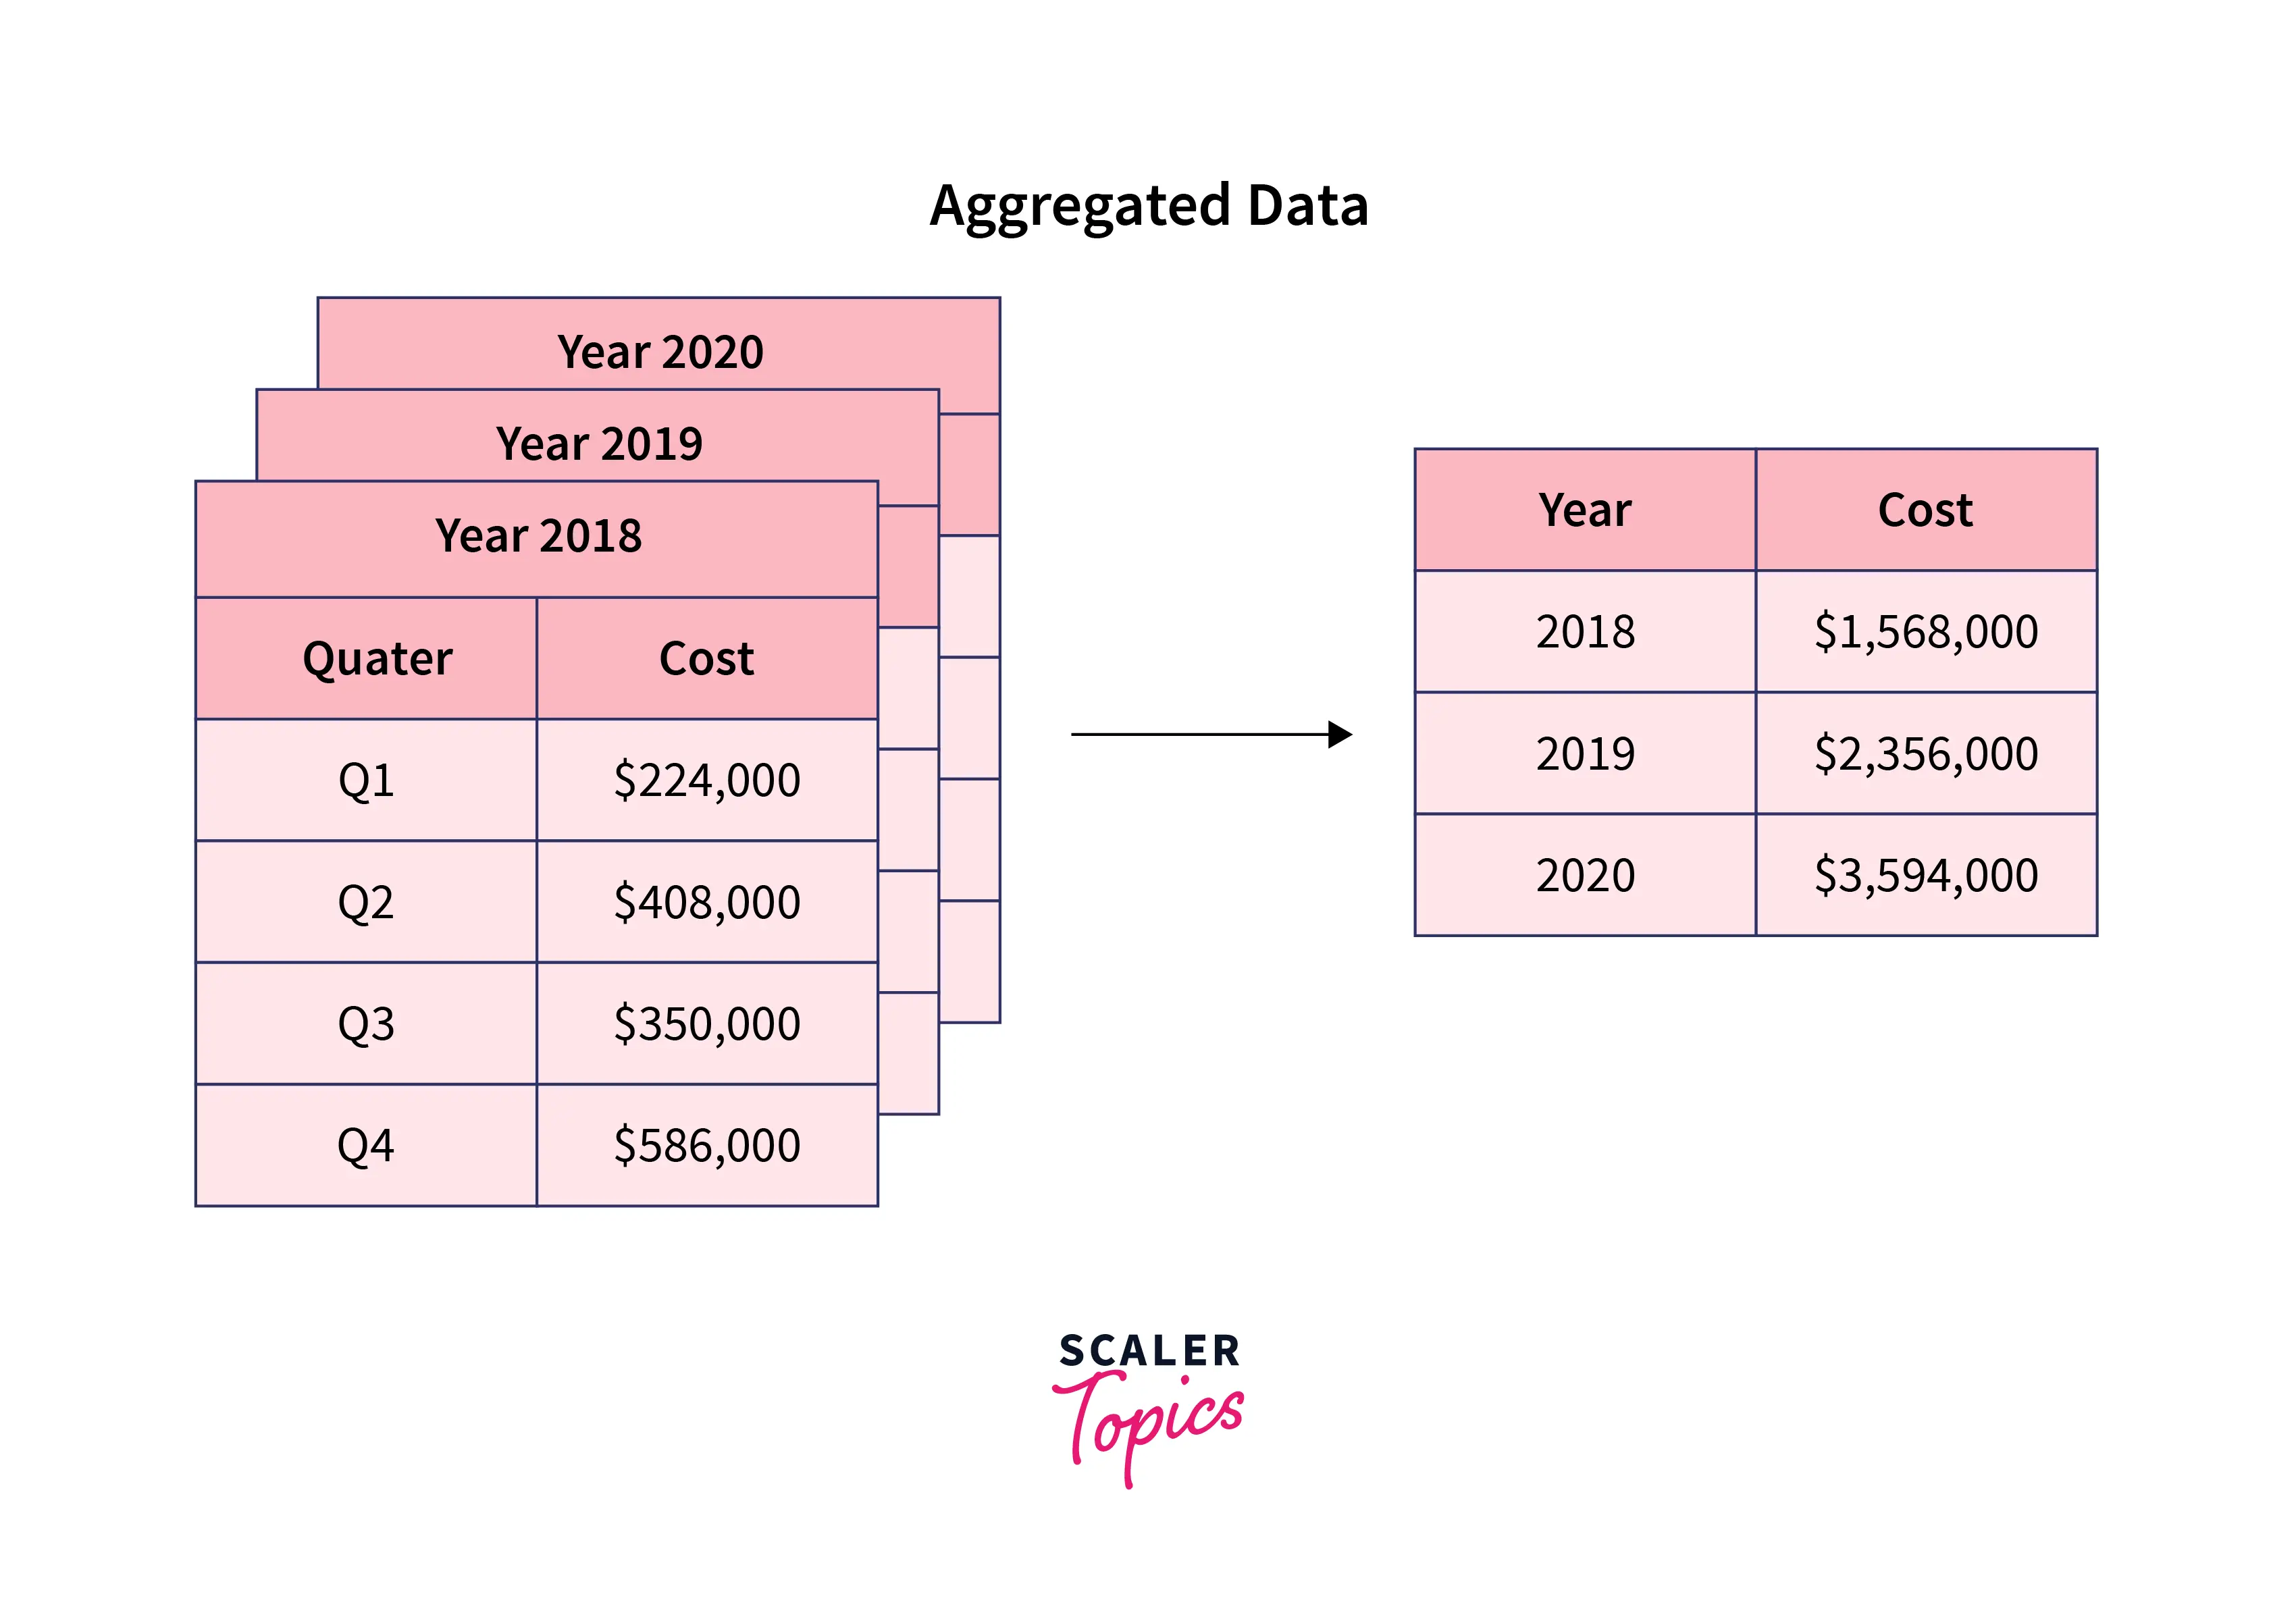
Data Aggregation can be defined as summarizing data in a format that is usable, understandable, and can be effectively consumed for any kind of analysis.
Data Interpolation (Data Disaggregation) is just the opposite of Data Aggregation, which is used to expand a dataset.
What are Data Aggregation and Data Interpolation?
Data Aggregation is collecting large volumes of raw data from databases and converting it into an organized and summarized format that is more consumable and comprehensive. Data Aggregation can provide the ability to forecast future trends and aid in statistical and predictive analysis. For example, a company may look at monthly sales data of a product instead of raw sales data to understand its performance better and forecast future sales.
Data Interpolation is a method of estimating new or unknown data points with the knowledge of known data points. It breaks down a dataset into smaller or more granular units or handles missing values. It is just the opposite process of Data Aggregation.
For example, if you have monthly sales data, you may break it down to daily-level sales data to gain a deeper understanding of sales performance.
Usage
- Organizations use Data Aggregation in many applications, such as Marketing Analytics, Sales Analytics, Price Forecasting, and Setting, Sentiment Analysis, etc.
- Similarly, Data Interpolation is also prevalent across organizations and has many use cases such as health condition analysis, granular understanding of population characteristics, pattern detection, etc. In addition, Data Interpolation is also used to fill in missing values by estimating them using known values.
Transform Your Career
Choose from our industry-leading programs designed for career success
Modern Software and AI Engineering Program
Master full-stack development with AI integration

Modern Data Science and ML with specialisation in AI
Advanced data science techniques with AI specialization
Advanced AIML with Specialisation in Agentic AI
Deep dive into AIML with focus on Agentic systems
DevOps, Cloud & AI Platform Engineering
Build and manage AI-powered cloud infrastructure
AI Engineering Advanced Certification by IIT-Roorkee
Premier AI engineering certification from IIT-Roorkee
Benefits of Raw Data Aggregation and Interpolation
In today’s world, data has become the most crucial asset of organizations worldwide. The majority of data stored in any organization’s databases is raw, complex, and continuously evolving. It is challenging to work with this data directly, making it essential to transform it into a more summarized and organized format that can help perform effective analysis and support better decision-making processes. A few of the most popular benefits of Data Aggregation include the following :
- Enables statistical and predictive analysis
- Extracts insights by providing data into a comprehensive and consumable medium
- Forecasts future trends
- Faster query results
Data Aggregation results in loss of information as it transforms data into a summarized format. However, in many cases where you need to perform deeper and more granular data analysis, you can use Data Interpolation to expand aggregated datasets to a finer granularity. Also, missing values are prevalent in real-world data, and you need to impute them before any analysis. Data Interpolation can estimate these missing values based on adjacent known values.
Ways of Data Aggregation
A few of the most common ways to perform Data Aggregation include the following :
- Sum:
In this approach, Data Aggregation takes the sum of a specified feature or data to summarize it. For example, extracting total month-wise sales data for a given product. - Average:
It computes the average/mean values of a specified feature. For example, extracting the average order price for a consumer. - Max:
It will extract the highest or max value of specified data or features. For example, the product or region with the highest sales. - Min:
It displays the minimum or lowest value of a given feature. For example, the product or region with the lowest sales. - Count:
It will count the total number of records for a given category. For example, count of past orders for consumers in a month.
Let’s see how you can use python to perform Data Aggregation on a Pandas dataframe :
Ways of Data Interpolation
A few of the most common methods to perform Interpolation include as follows :
- Linear Interpolation:
In this method, unknown points are estimated by fitting linear polynomials on known data points. Essentially, it assumes a linear relationship between adjacent points. - Polynomial Interpolation:
It is used to approximate a non-linear relationship between adjacent or known points to estimate unknown values. - Nearest Neighbor Interpolation:
It is one of the simplest methods to interpolate unknown data points. It replaces unknown values with their closest neighbor in terms of distance. It is prevalent in Image Processing.
Let’s have a look at one example of how interpolation can be used in Python language :
Turn Learning into Career Growth
Examples of Data Aggregation and Interpolation
Data Aggregation is not new and has been in use for many years. For example, In schools and universities, a student’s marks are aggregated to compute the percentage, which is further used in grading the students. But in the past few years, data has become convoluted and grown at an unprecedented rate, therefore complexity and scale of Data Aggregation have also grown exponentially. Let’s have a look at some of the examples of how Data Aggregation is used in organizations :
- Organizations rely heavily on Data Aggregation to analyze marketing campaigns. They aggregate sales and marketing data at many levels, such as user, product, region, month, etc. This aggregation helps organizations understand how a product is working in each consumer segment (gender, average age, etc.), region, etc. These insights are further used in improving the sales and marketing campaigns of the organizations.
- Companies aggregate online behavior data in the E-Commerce sector to understand consumer experience and sentiment.
- Data Aggregation is also used to estimate the voter turnout for an election in a country by counting the total number of votes for each region.
Similarly, Data Interpolation is also prevalent in organizations and aids in performing more granular analysis. A few of the most popular examples of interpolation include the following :
- Data Interpolation is heavily used in handling missing values in time series data. For example, if you have monthly sales data for January, February, April, and June. You can utilize interpolation to estimate sales data for March and May using the known sales data for other months.
- Data Interpolation is also used to transform time series data to a more granular date/time level by interpolating unknown points. For example, suppose you have sales data for the first day of each month. In that case, you can perform interpolation to transform it into daily sales data to effectively analyze the implicit trends.
Levels of Data Aggregation and Interpolation Proficiency
Data Scientists and Data Analysts are the most common users of Data Aggregation and Interpolation tools and software. Their proficiency or expertise in Data Aggregation and Interpolation can be divided into three categories, as mentioned below :
Beginner
As a beginner in Data Aggregation, you perform Data Aggregation to compute simple metrics such as conversion rates in marketing, click rates, etc. You are likely to work on a low volume and highly summarized data. Similarly, as a beginner, you are more likely to perform interpolation on a small and less complex dataset.
Intermediate
As an intermediate, you will deal with comparatively larger amounts of information to perform Data Aggregation and Interpolation. This information typically will get updated daily, weekly, monthly, etc.
Scaler Placement Report and Statistics
Scaler learners achieved 2.5x salary growth with average post-Scaler CTC reaching ₹23L.
Master
As a master in Aggregation and Interpolation, you will utilize a variety of data sources, such as spreadsheets, APIs, etc. In addition, you will spend your resources automating this process and building dashboards so that business management can make informed and data-driven decisions.
Conclusion
- Data Aggregation is a process of organizing and summarizing data in a format that is more consumable and comprehensive. It aids in predictive and statistical analysis and supports the organization’s decision-making processes. There are many ways to perform Data Aggregation, such as sum, min, max, count, etc.
- Data Interpolation estimates unknown values by utilizing known or adjacent data points. A few popular interpolation methods are linear, polynomial, nearest neighbor, etc.