Descriptive Statistics

Overview
Statistics is a branch of mathematics discipline that is related to the collection, analysis, interpretation, and presentation of data. Statistics is a powerful tool to understand, interpret data, and make informed decisions. It is one of the most essential skills required to become a Data Scientist. Statistics can be divided into two categories - Descriptive Statistics and Inferential Statistics.
What is Descriptive Statistics
- Descriptive Statistics is a branch of statistics that deals with data collection, organization, analysis, interpretation, and presentation. Descriptive Statistics helps you understand the data better and make informed decisions based on a given dataset.
- It provides various tools and methods to summarize and describe the characteristics of a sample or data set, such as its central tendency, dispersion, shape, and distribution.
- A few of the most common techniques/methods used in Descriptive Statistics include - measures of central tendency (mean, median, and mode), measures of dispersion (range, variance, and standard deviation), measures of shape (modality, skewness, kurtosis), etc.
Transform Your Career
Choose from our industry-leading programs designed for career success
Modern Software and AI Engineering Program
Master full-stack development with AI integration

Modern Data Science and ML with specialisation in AI
Advanced data science techniques with AI specialization
Advanced AIML with Specialisation in Agentic AI
Deep dive into AIML with focus on Agentic systems
DevOps, Cloud & AI Platform Engineering
Build and manage AI-powered cloud infrastructure
AI Engineering Advanced Certification by IIT-Roorkee
Premier AI engineering certification from IIT-Roorkee
Descriptive Statistics Examples
- The most common example of Descriptive Statistics is GPA (Grade Point Average) system used in schools, colleges, and universities. GPA is computed by taking the mean of a student's marks/grades obtained in each subject. It provides a summary of a student’s academic success.
- In sports, Descriptive Statistics is used to analyze the performance of players and teams. For example, average and strike rate are the most common metrics to analyze a batter's performance in cricket.
- In the financial sector, Descriptive Statistics is heavily used to analyze and summarize the performance of a company’s stock over some time. This includes the mean and median price of stocks, price-to-earning ratio (P/E), standard deviation, etc.
- Descriptive statistics are also used to analyze a movie or TV show's performance, such as TRP, % of users who liked the movie, etc.
Probability Distribution and Distribution Function
- In probability theory and statistics, a Probability Distribution is a mathematical function that describes the probabilities of the occurrence of different possible values for a given random variable. It is also called the Probability Distribution Function (PDF).
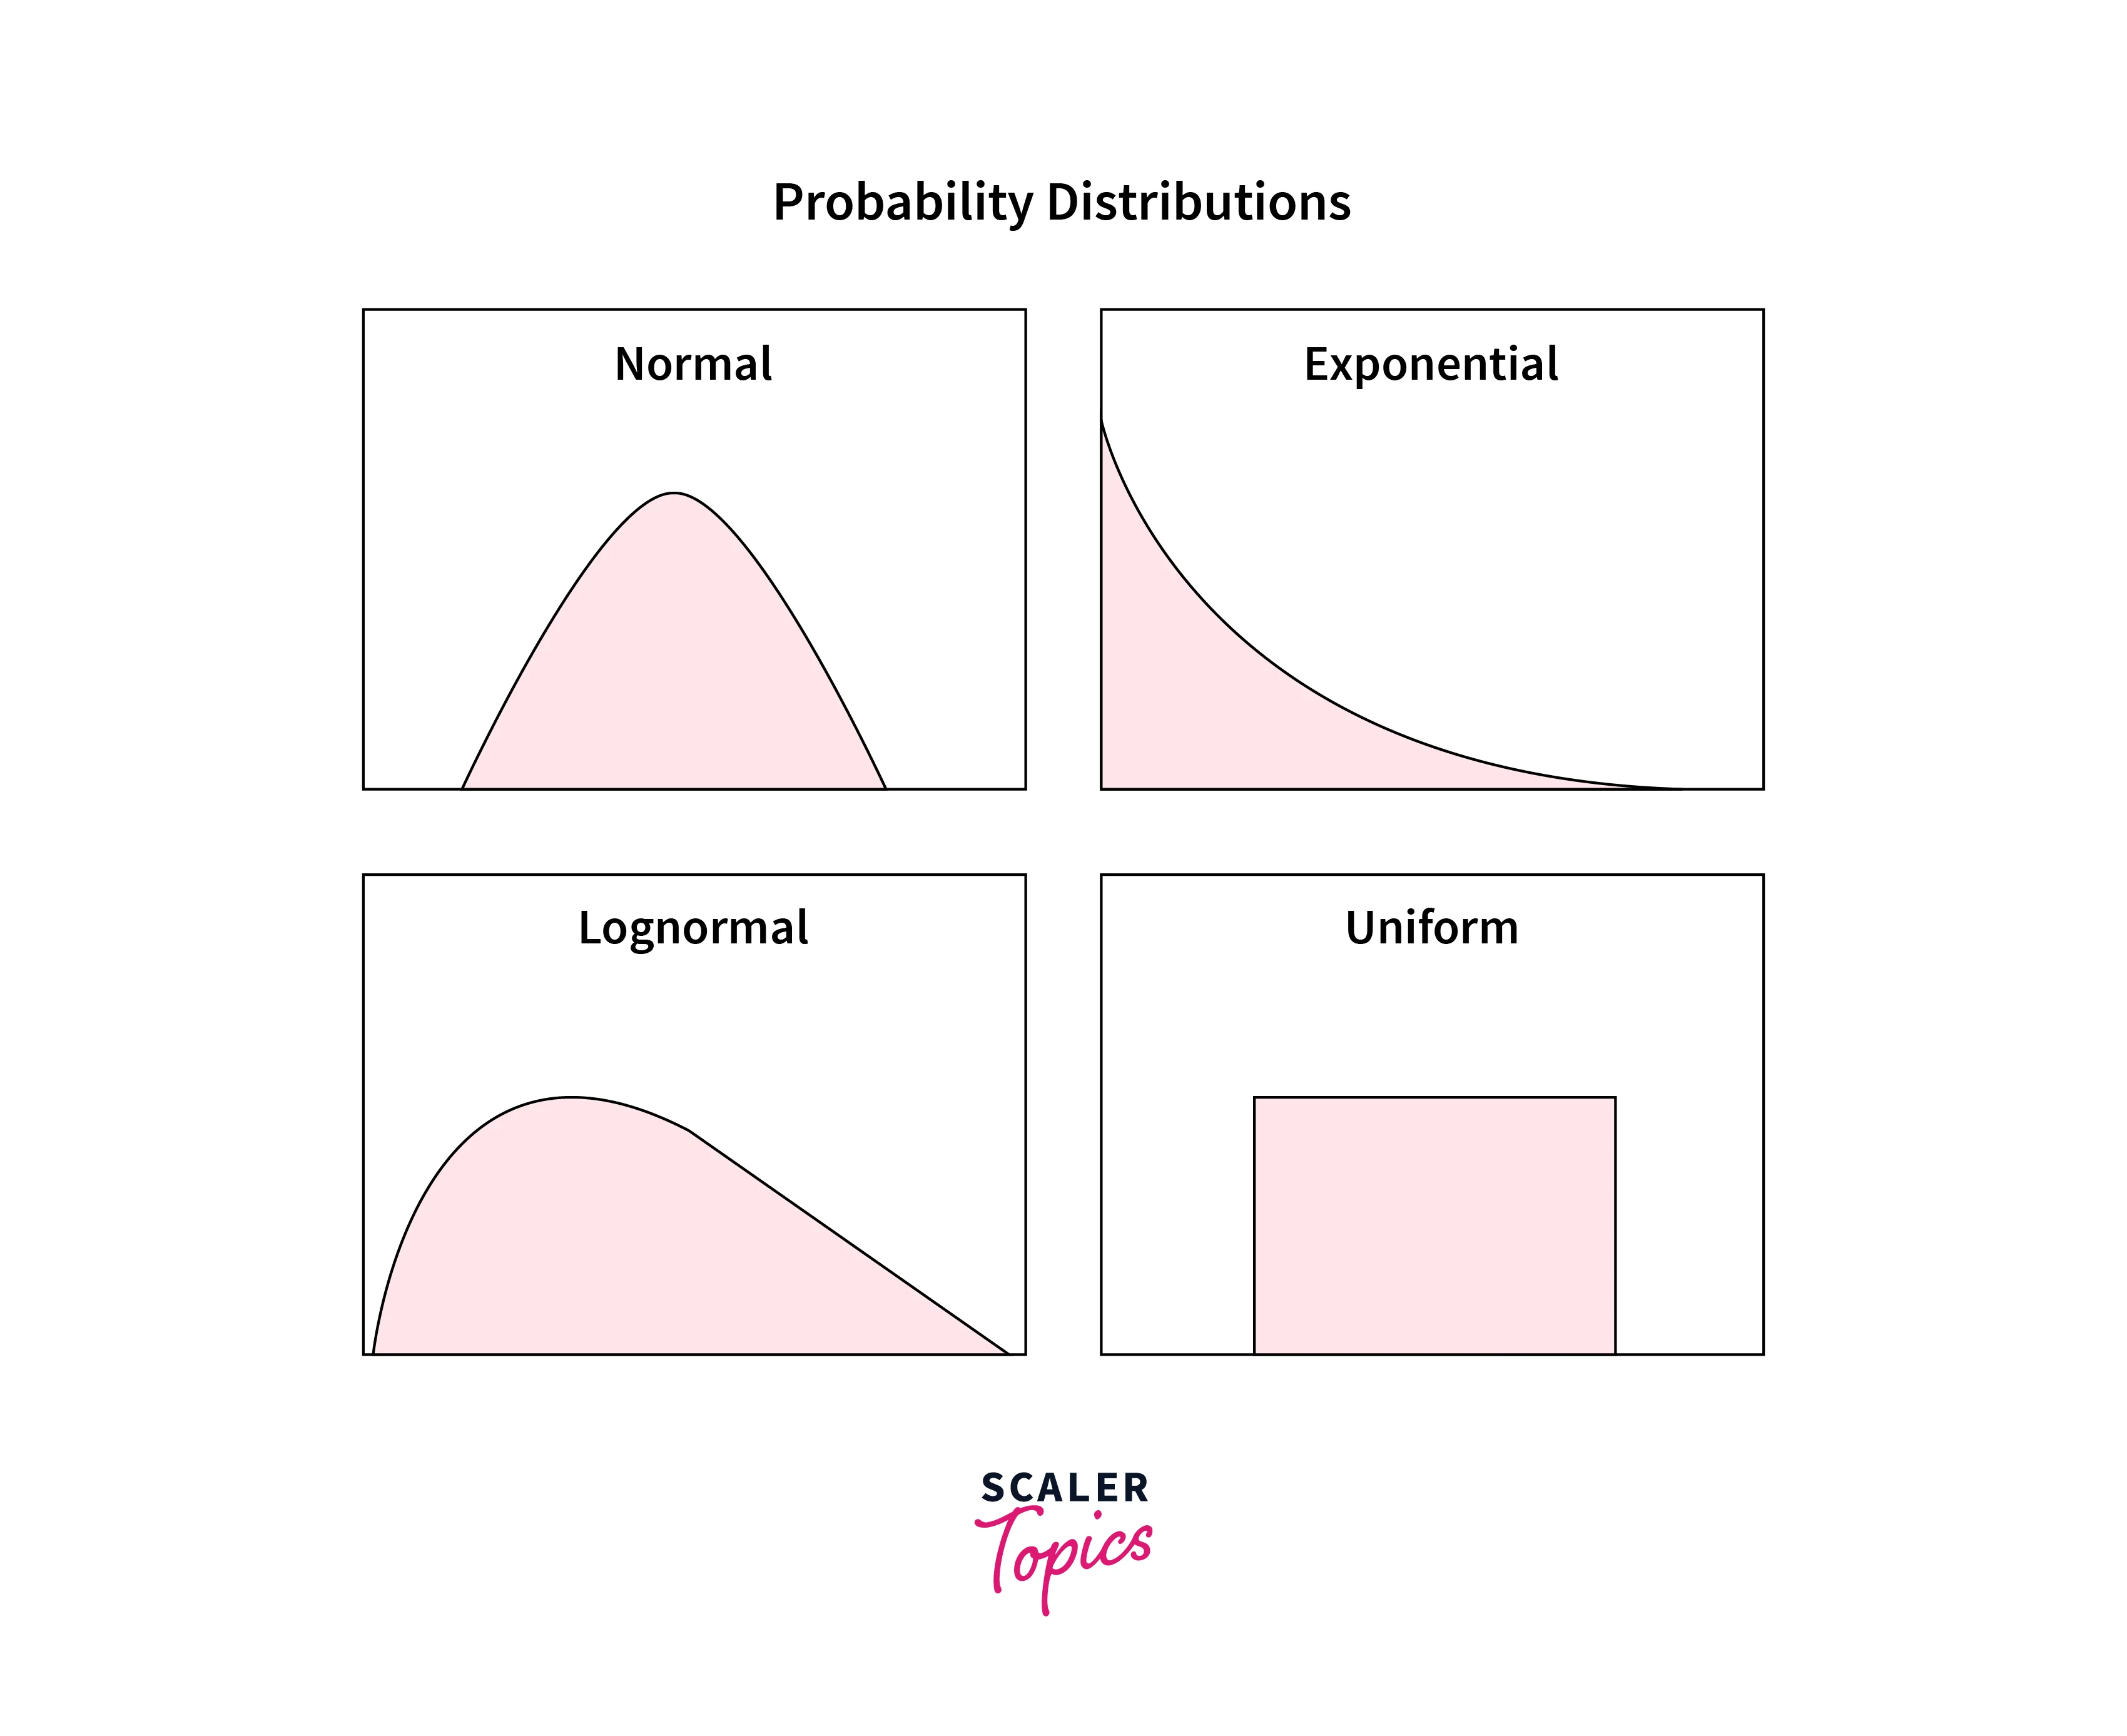
- A PDF of a random variable is typically represented by a curve where the X-axis represents all the variable's possible values, and the Y-axis represents corresponding probabilities. A few of the most common probability distributions are Normal, Exponential, Binomial, Uniform, Lognormal, Poisson, etc.
- Understanding the distribution of a sample/feature is essential to draw meaningful insights from it. It also helps to choose the best possible models/methods in Machine Learning development.
Normal Distribution
- The Normal Distribution is one of the most important concepts in Statistics, as most statistical concepts assume that input data is normally distributed.
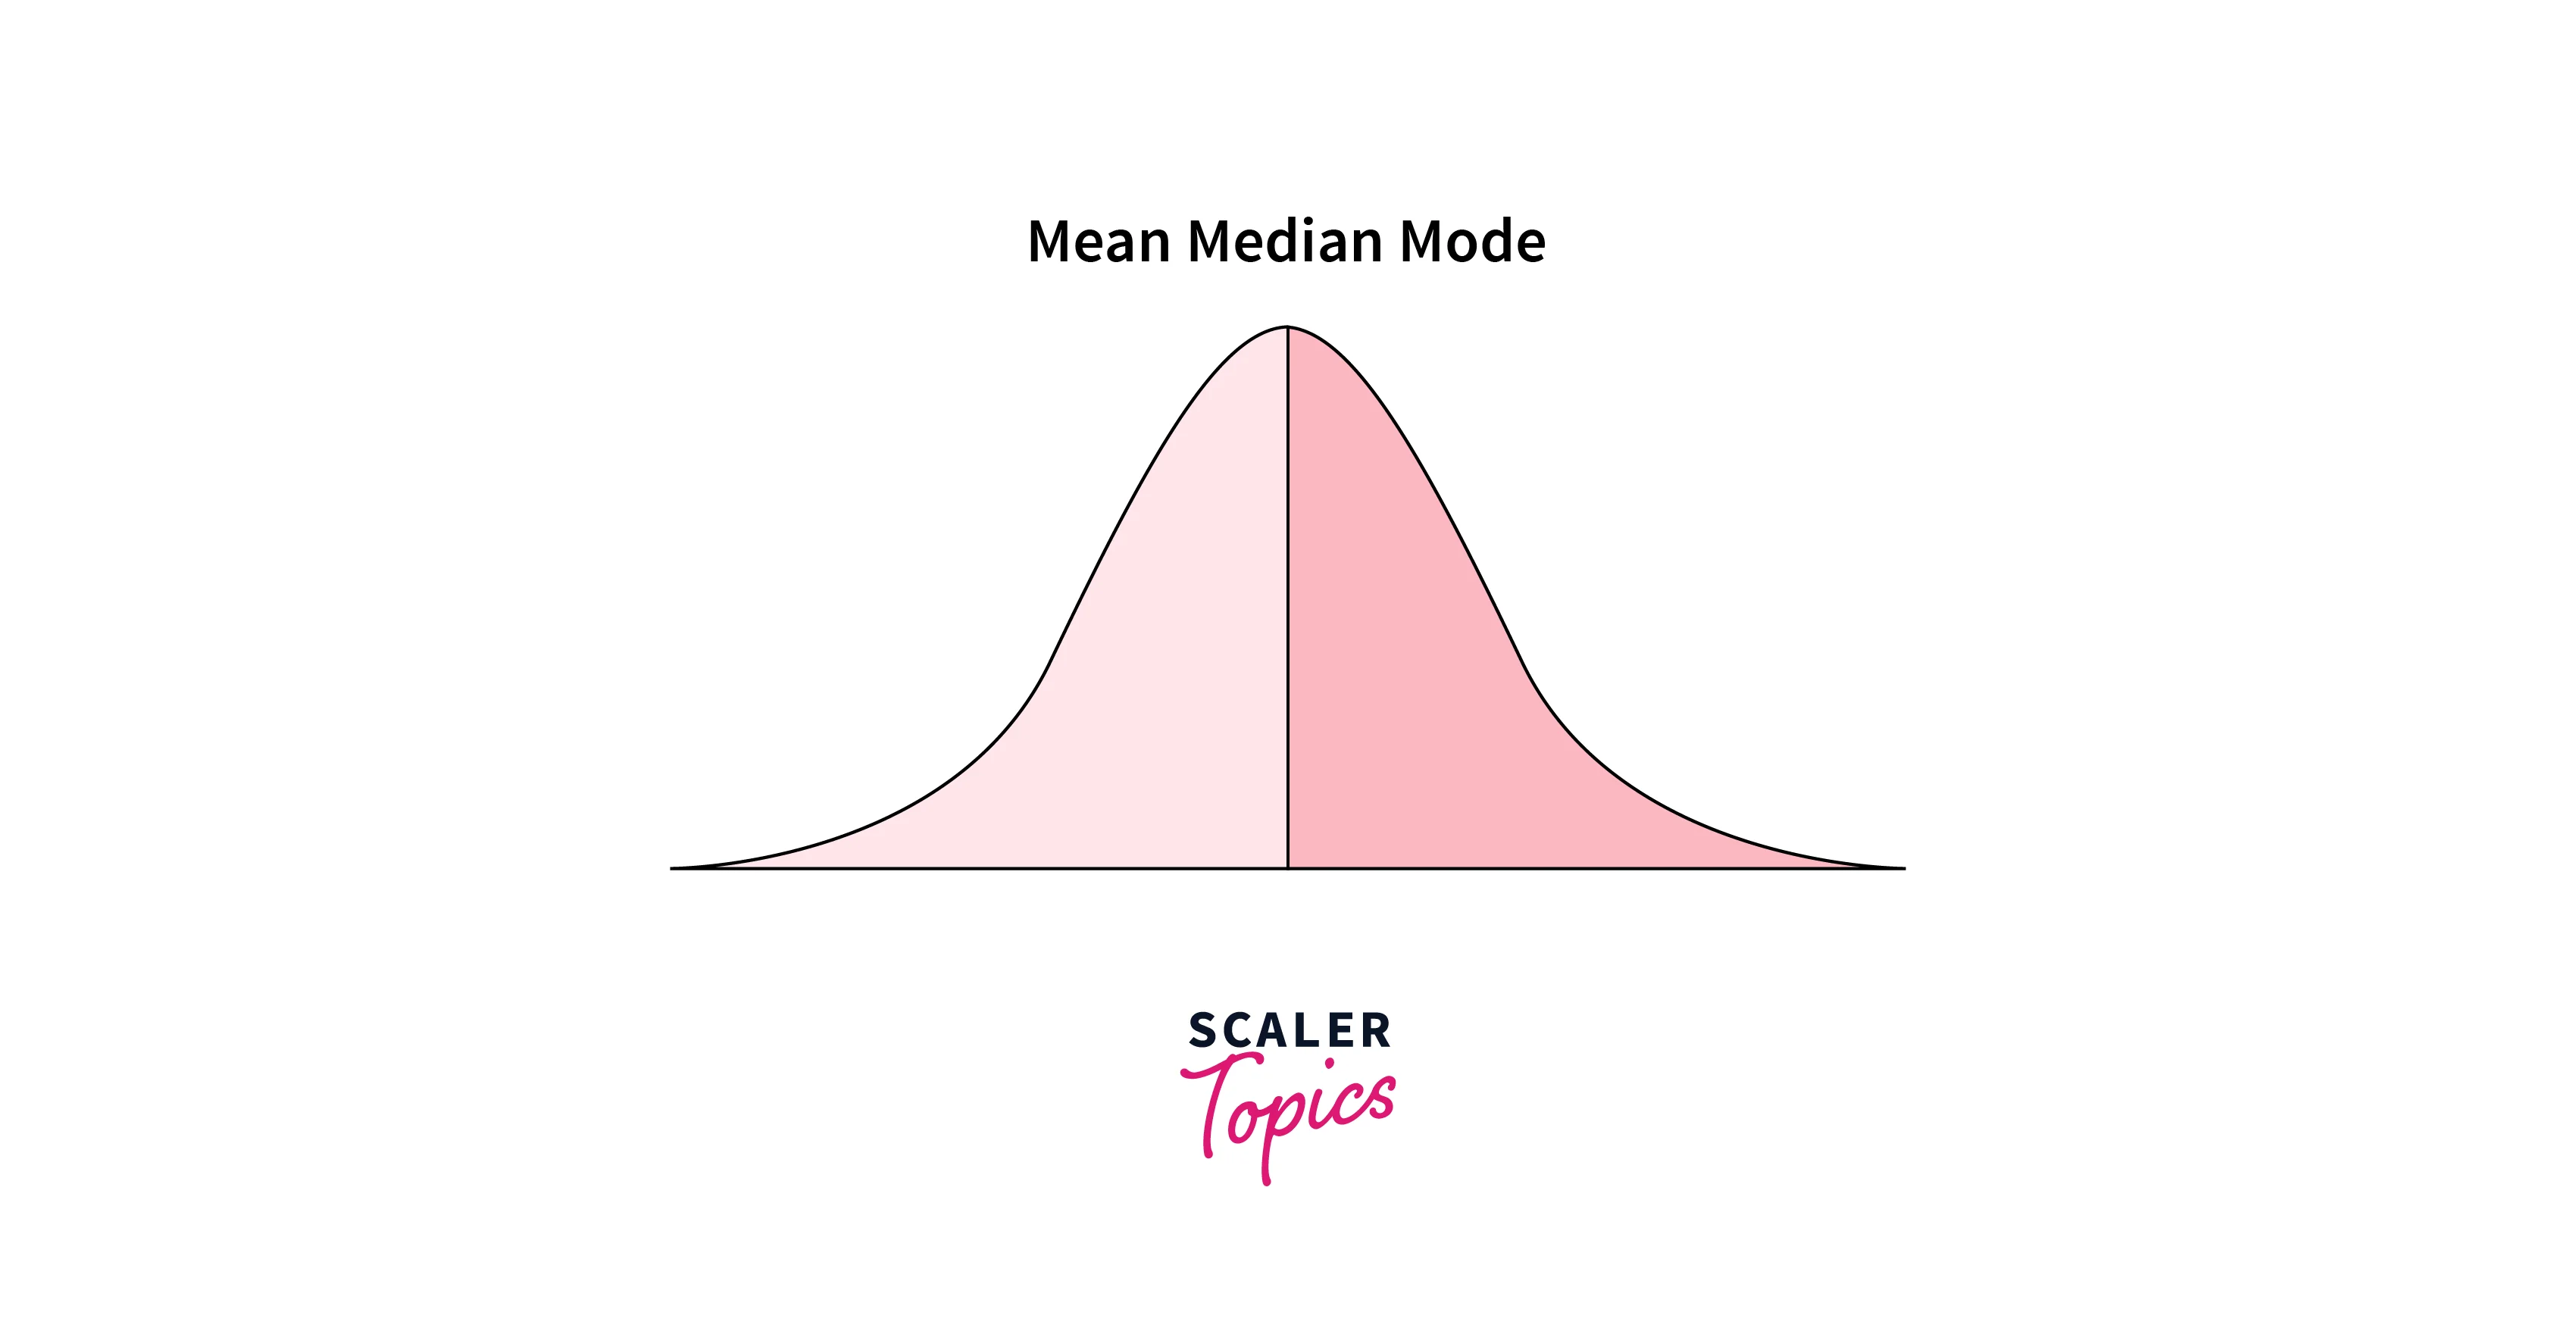
- Normal Distribution is a Probability Distribution that is symmetric about the mean, representing that values near the mean are more frequent in occurrence compared to values that are far from the mean.
- Normal Distribution is also called Bell Curve and Gaussian Distribution. It is a symmetric, unimodal, centered, and bell-shaped curve.
Scaler Placement Report and Statistics
Scaler learners achieved 2.5x salary growth with average post-Scaler CTC reaching ₹23L.
Measures of Central Tendency
- In Descriptive Statistics, Central Tendency measures the central or average value for a given dataset or population.
- It is a way of summarizing a data set by describing the center of the data distribution. There are several different measures of central tendency - the mean, median, and mode.
Mean
- The mean is the average value of the data or sample. Mean is calculated by taking the sum of all the values in the data set and dividing it by the total number of values. For example, if a data set contains the values 2, 6, and 13, the mean of the data set would be 7, which is the average of the three values.
- It is one of the most commonly used measures of Central Tendency. The mean is sensitive to the values of individual data points and can be influenced by extreme values or outliers present in the data set. So, removing the outliers before computing the mean will provide more good results.
Median
- The Median is the middle or center value or midpoint in your data. The Median is also called the 50th percentile of the dataset. The median separates the higher half of the data from the lower half.
- The Median of a dataset can be computed by first ordering/sorting the values in the dataset and then finding the middle value. For example, if a dataset contains the values 2, 5, 9, 13, and 17, the median of the dataset is 9.
- The Median is not sensitive to extreme values or outliers in the data and is a useful measure of central tendency when the data is skewed or extreme values are present in the data.
if is odd,
if is even,
number of terms th number
Mode
- The Mode is the value or category that is the most common or occurs most in the data. For example, if a data set contains the values 2, 4, 6, 7, and 7, the mode of the data would be 7, which is the most common value in the data set.
- Mean and Median can be applied only to numerical values, but Mode can be used to measure the central tendency for both numerical and categorical variables. The mode is a useful measure of central tendency when the data is categorical or multi-modal when there are multiple modes or peaks in the distribution of the data.
Measures of Variability
- In Descriptive Statistics, Measures of Variability are the statistical measures that describe the spread or dispersion of values in a data set. Measures of Variability are used to describe how much the values in a data set vary or deviate from the central tendency of the data.
- It is also called Measures of Dispersion or Measures of Spread. A few of the most commonly used measures of variability include the Range, Inter Quartile Range, Variance, and Standard Deviation.
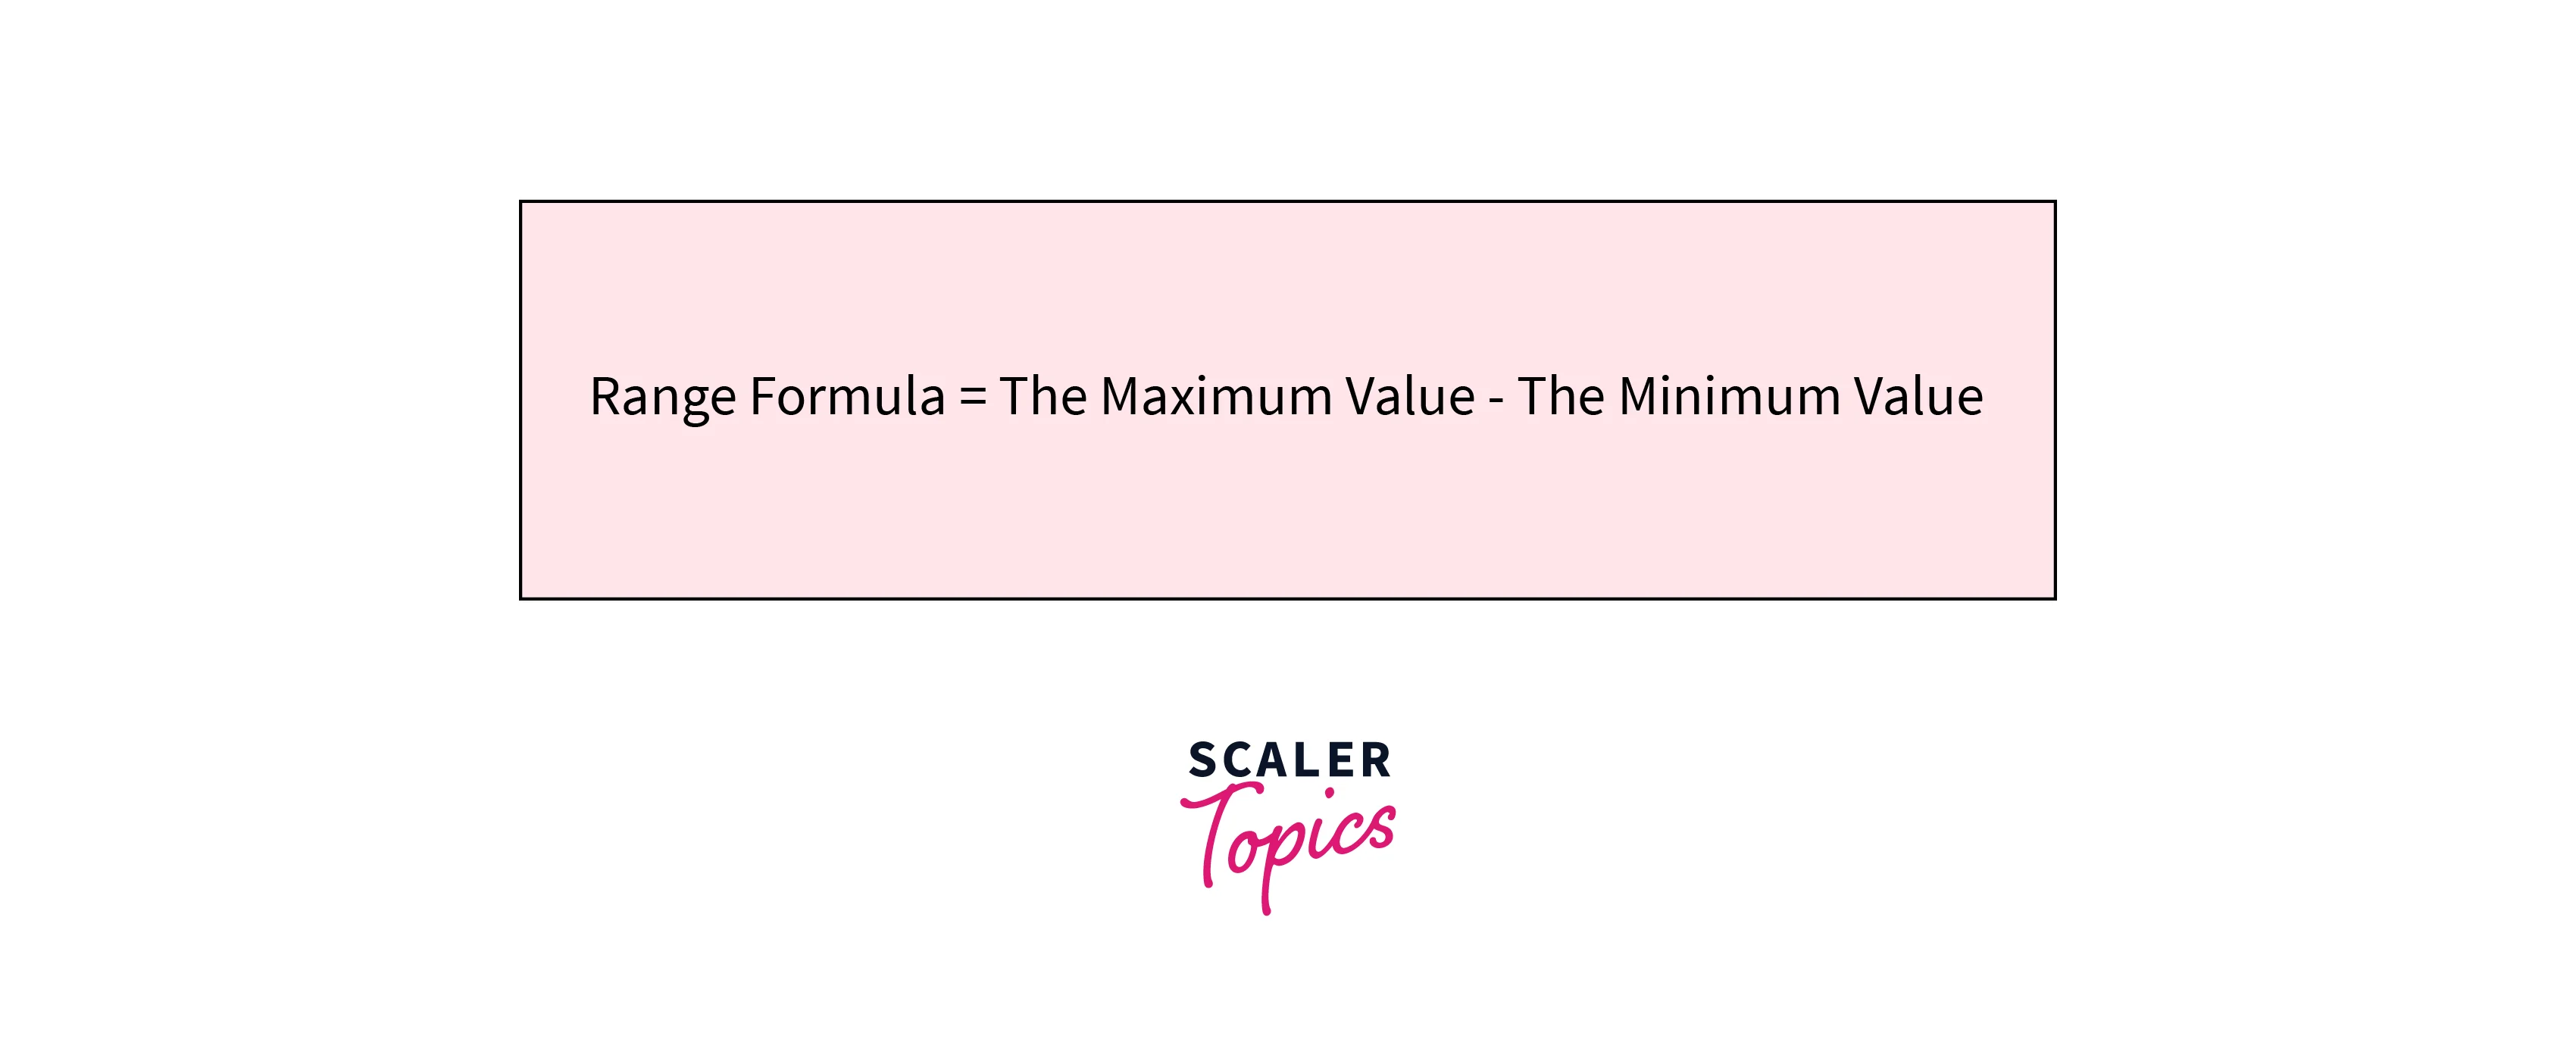
Range
- The Range is the difference between the highest and lowest values in a given sample or dataset. For example, if a data set contains the values 2, 6, 8, and 12, the range of the data set would be .
Inter Quartile Range
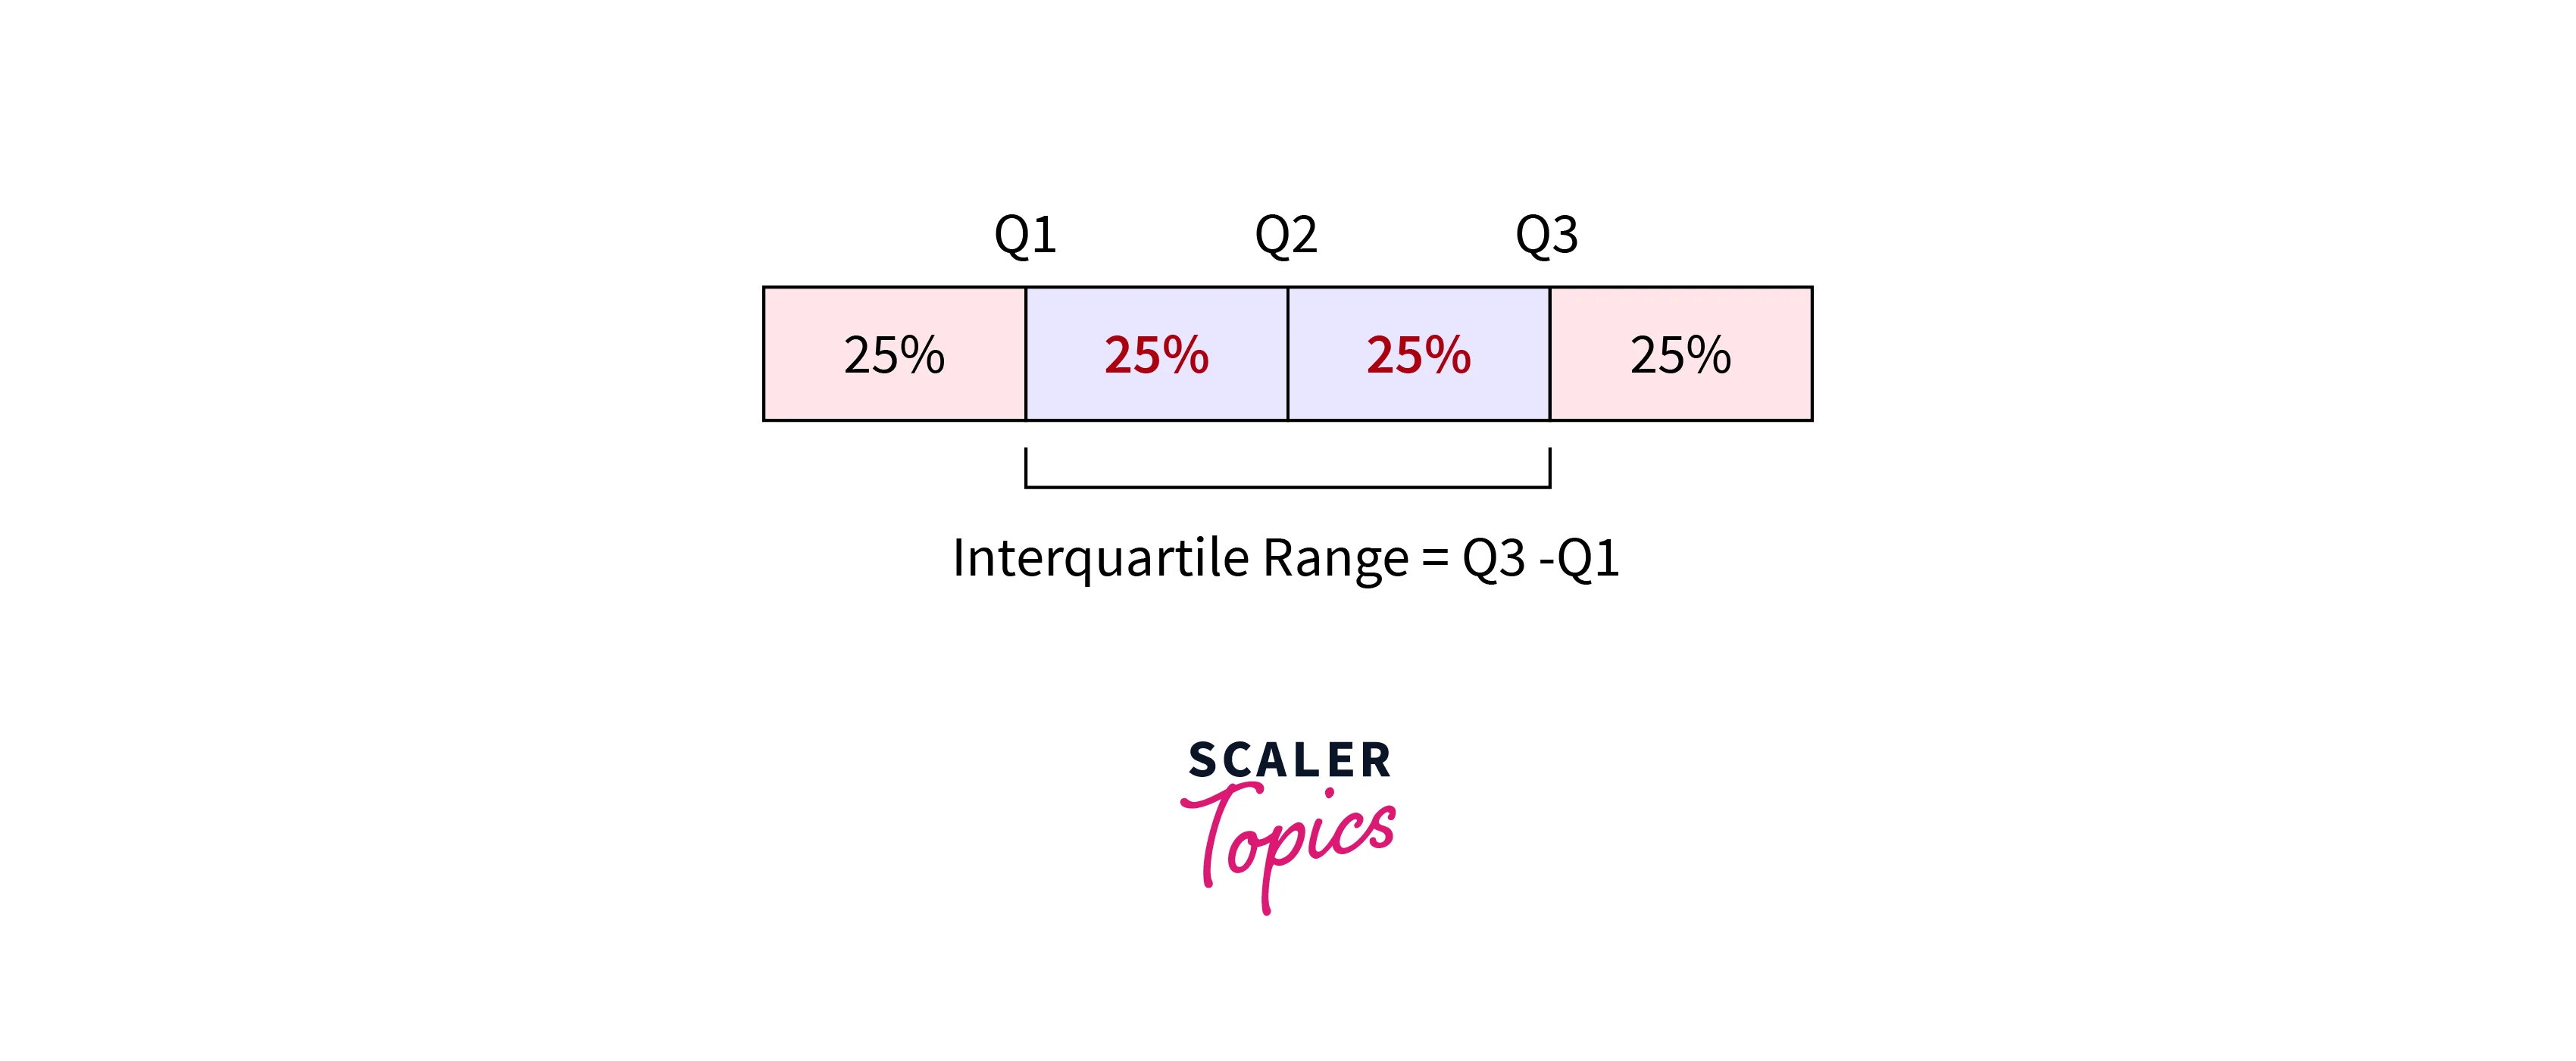
- Quartiles are values that divide a dataset into four equal parts or quarters. The first quartile, or lower quartile, is the value that separates the lowest 25% of the data from the higher 75% of the data. The second quartile, or median, is the value that separates the lower half of the data from the upper half of the data. The third quartile, or upper quartile, is the value that separates the lower 75% of the data from the highest 25% of the data.
- Inter Quartile Range is defined as the difference between the 3rd Quartile and 1st Quartile.
Variance and Standard Deviation
- Variance and Standard Deviation are the most commonly used methods to measure the dispersion or spread of a given dataset.
- Variance can be calculated by taking the average of the squared differences of values from the mean. The Variance summarizes the spread of a data set by describing the average distance of the values from the mean or how far values are spread from the mean.
- As we take the squared differences of values from the mean, it is not in the same unit of measurement as the original dataset. For example, if values in a dataset are in centimeters, the Variance would be in squared centimeters.
- That’s where Standard Deviation comes into the picture. Standard Deviation is the square root of the Variance. It is more often used compared with Variance as it will be in the same unit of measurement.
- If a dataset has a low standard deviation, values will be close to the mean, and values are spread out over a wide range in the case of a high standard deviation.
Measures of Shape
- The Measures of Shape are statistical measures describing the shape or form of the distribution of the data. These methods are used to describe the degree of symmetry, skewness, or kurtosis in the data distribution and to identify the peaks or modes of the data.
- A few of the most common measures of the shape include - Modality, Skewness, and Kurtosis.
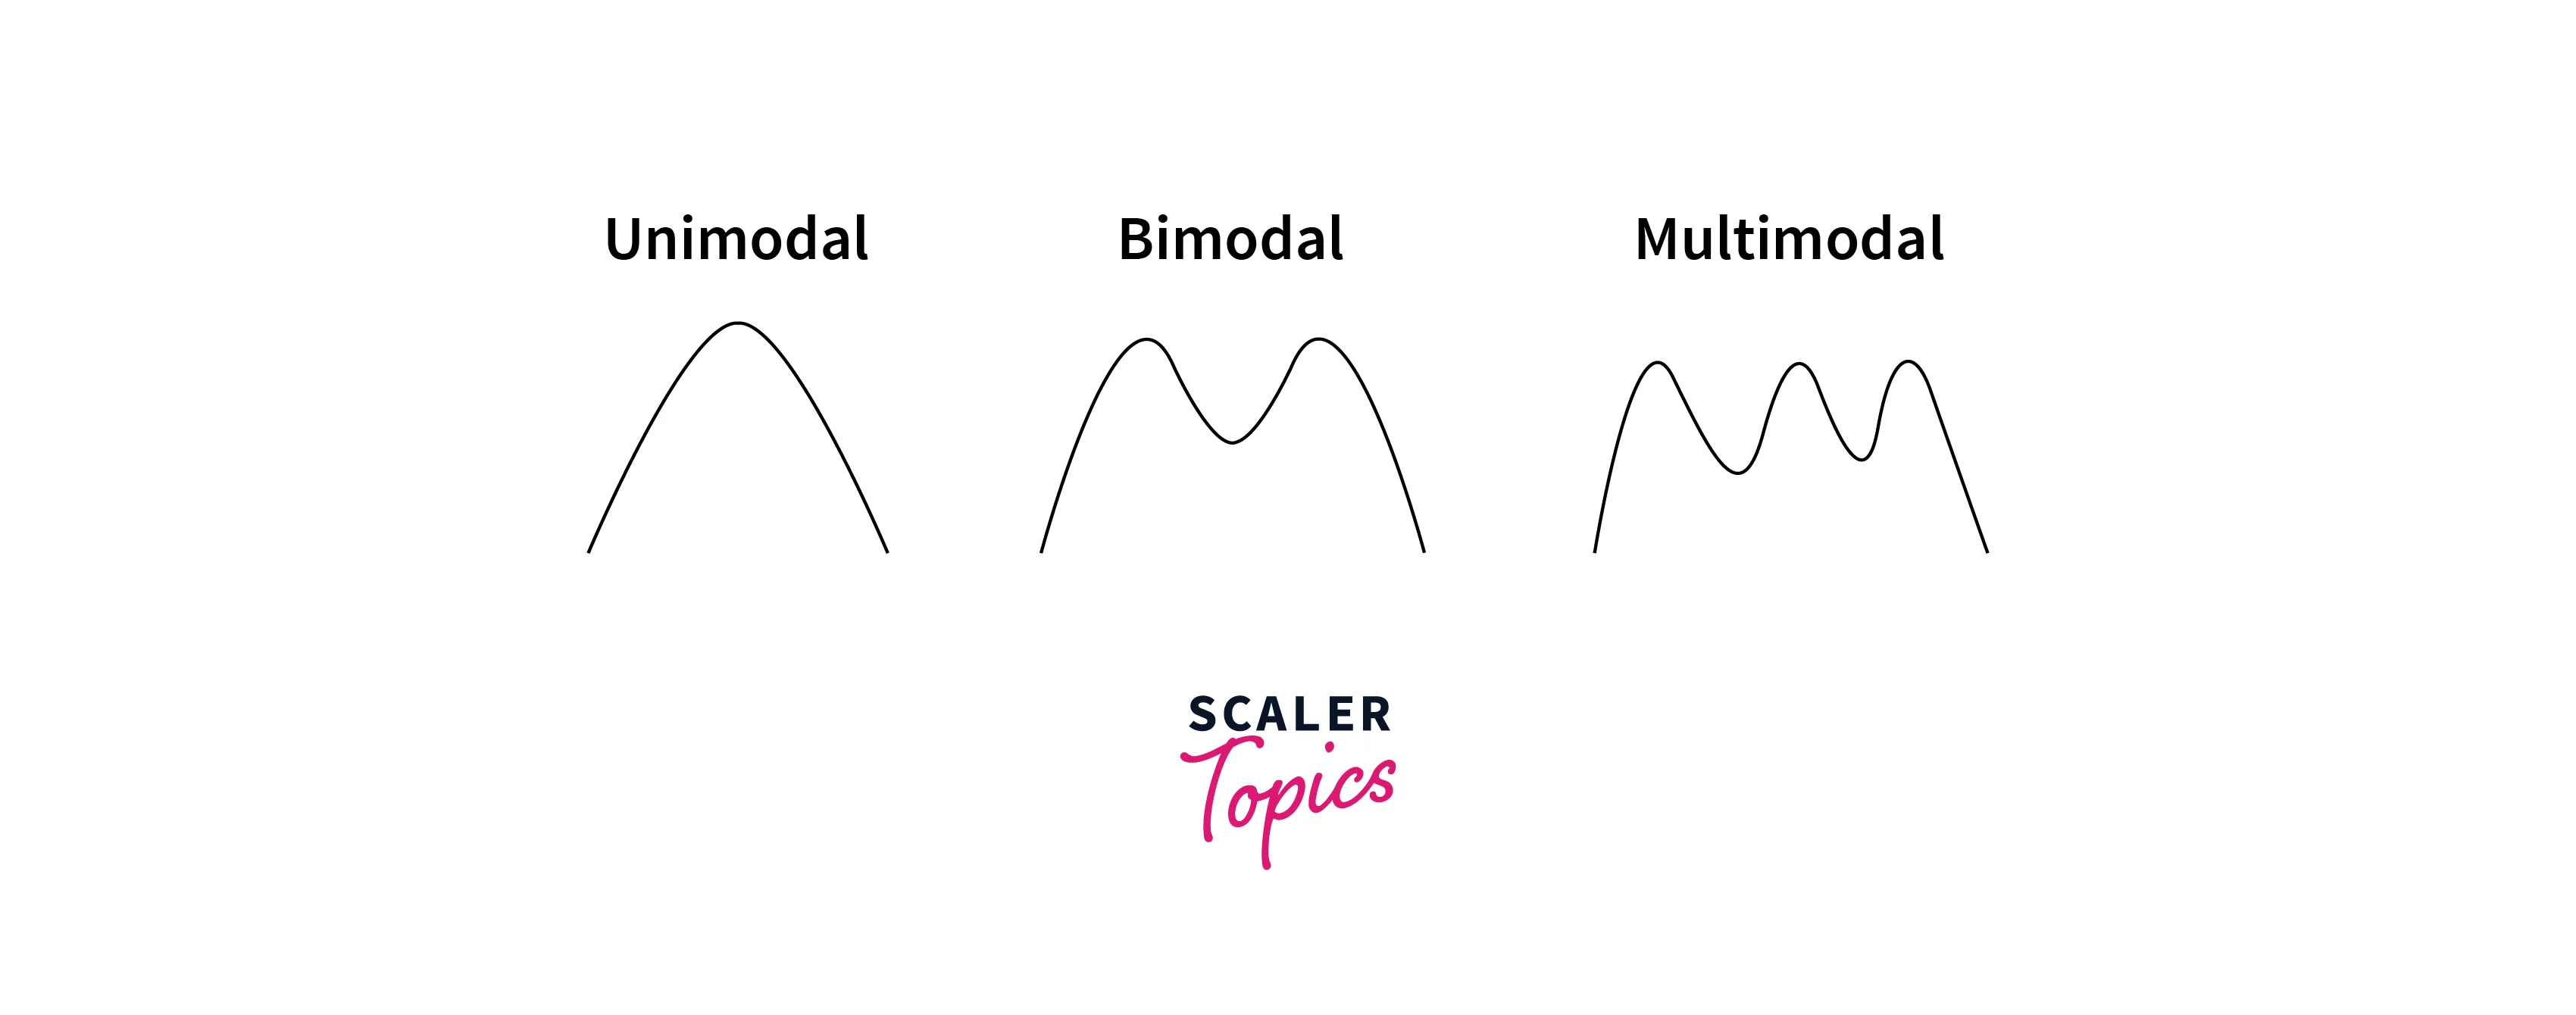
Modality
- Modality describes the number of modes or peaks in a given data distribution. If the data has only one peak, it is called unimodal. If it contains two peaks, it is referred to as bi-modal, and it is called Multi modal if there are more than two peaks in the data.
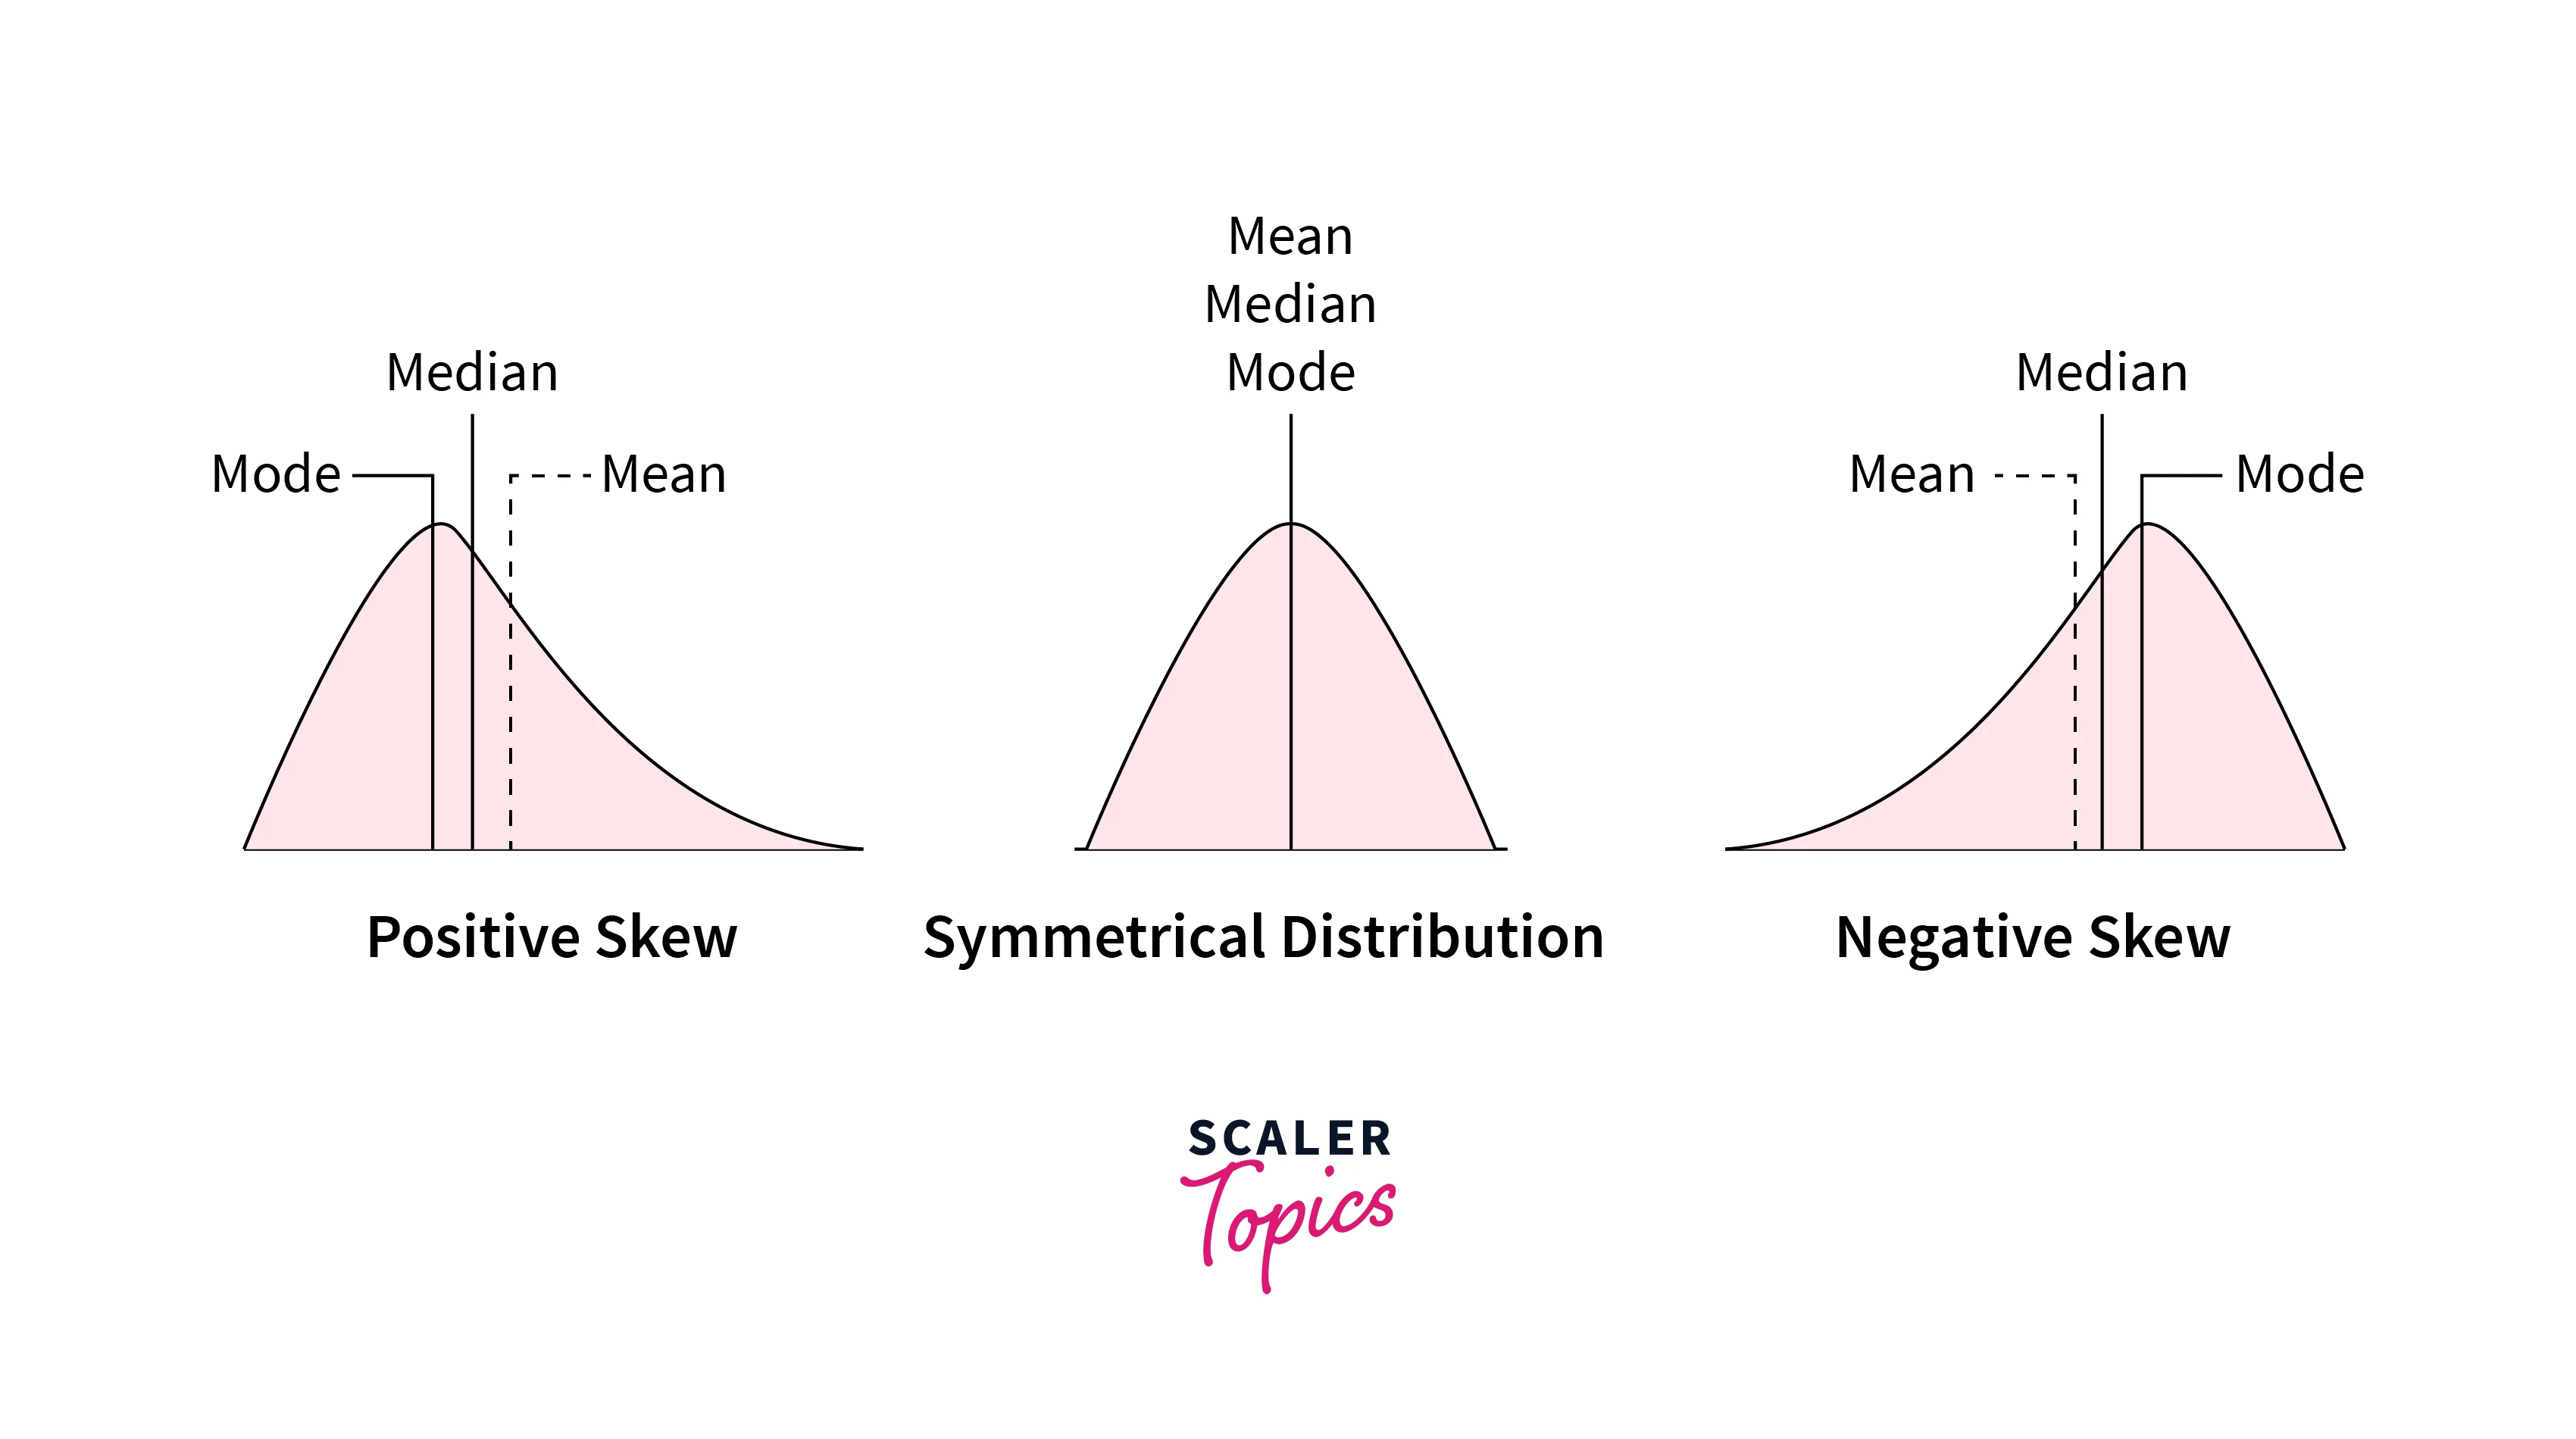
Skewness
- Skewness describes the symmetry of a given dataset. It measures the extent to which the data is skewed towards the mean's left or right side. Data is referred to as symmetrical if the values are evenly distributed around the mean or left and right side of the mean is a mirror image of each other.
- A dataset is called left skewed or right skewed if the values are more clustered toward the left or right side of the mean, respectively. The skewness values can be zero, positive, or negative. Normal Distribution has zero skewness as it is a symmetrical distribution, and the mean and median are the same.
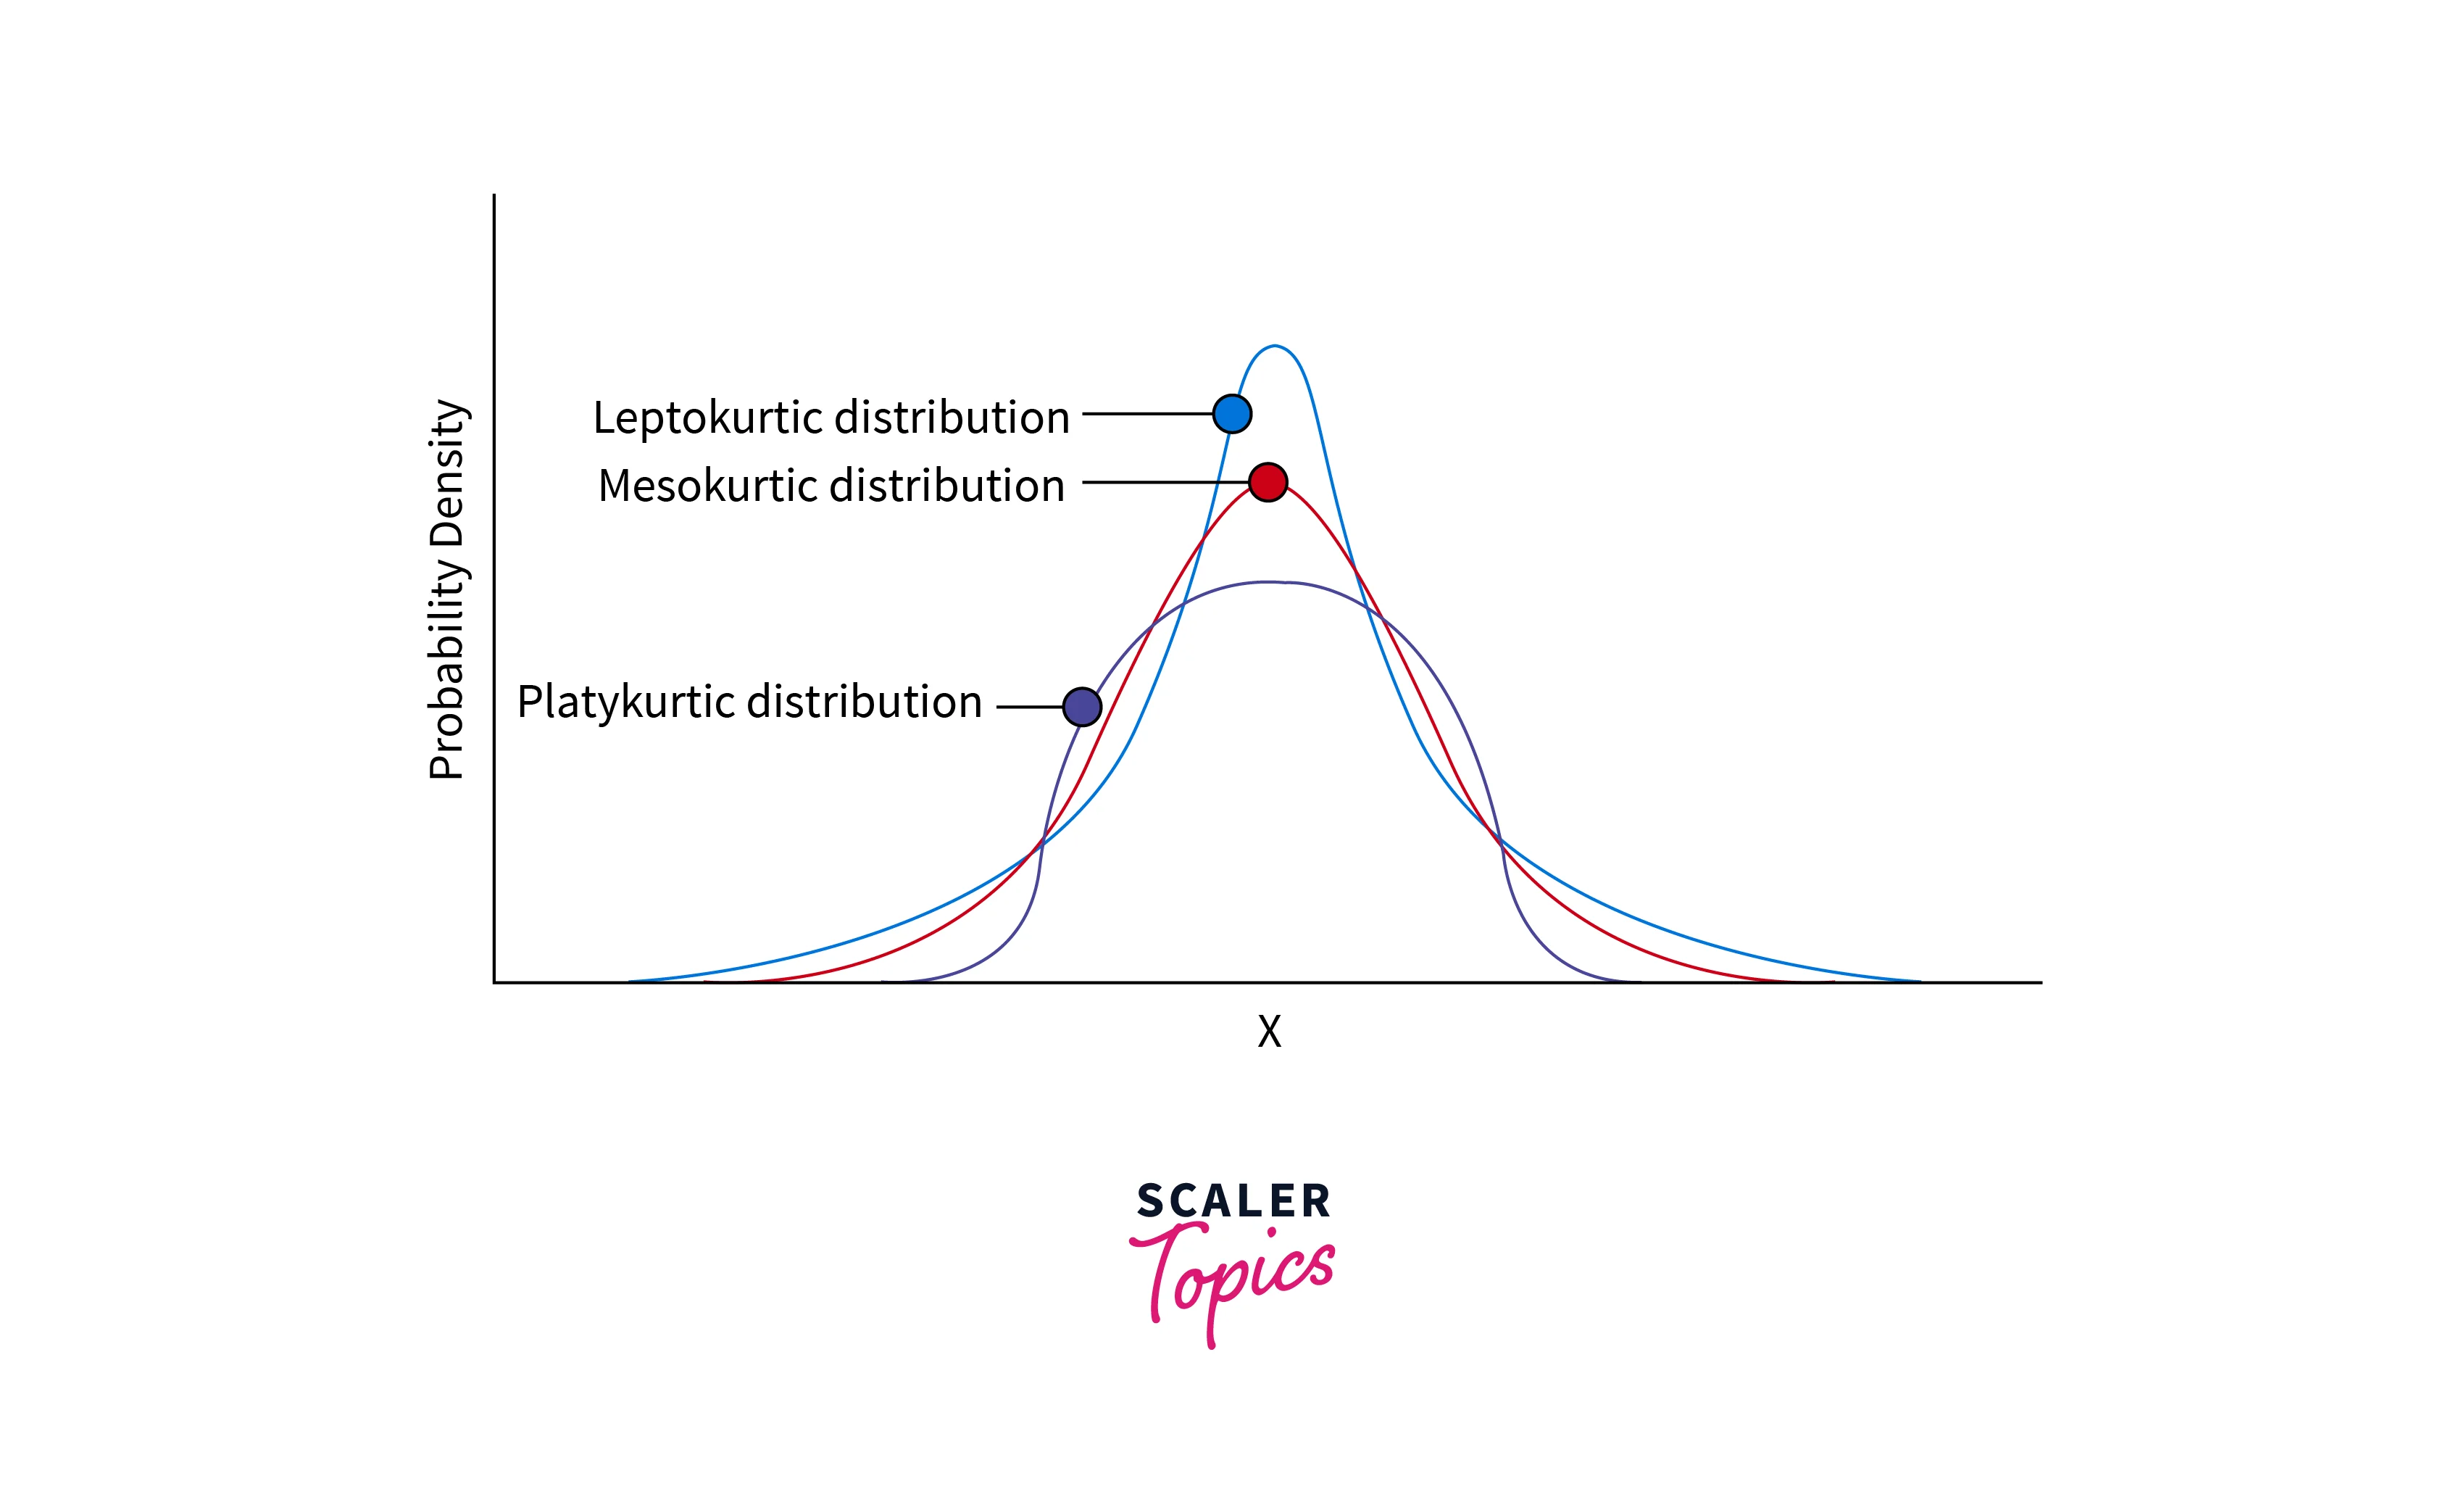
Kurtosis
- Kurtosis describes the peakedness or flatness of a data set relative to the normal distribution. It measures whether a given dataset is heavy-tailed or light-tailed compared to a normal distribution.
- A dataset with high Kurtosis contains more outliers, and a dataset with a low Kurtosis value will have fewer outliers. Distributions can be divided into three categories based on the degree of Kurtosis -
- Mesokurtic - distributions having medium kurtosis
- Platykurtic - distributions having low kurtosis
- Leptokurtic - distributions having high kurtosis
Conclusion
- Performing Descriptive Statistics is one of the most important steps in any Data Science project. Descriptive Statistics helps you understand the given data better and choose the best possible models during the ML model development.
- Descriptive Statistics typically measure the data's central tendency, dispersion, or shape. The most common methods used in Descriptive Statistics are Mean, Mode, Median, Standard Deviation, etc.