Detecting Parkinson’s Disease

Overview
Parkinson’s disease is a progressive central nervous system disorder affecting movement and inducing tremors and stiffness. It has a total of 5 stages and affects more than 10 lacs individuals annually in India. This is a chronic disease, and no cure has been found yet. In this article, we will develop an ML model to detect Parkinson’s disease based on a patient’s diagnostic results.
What are We Building?
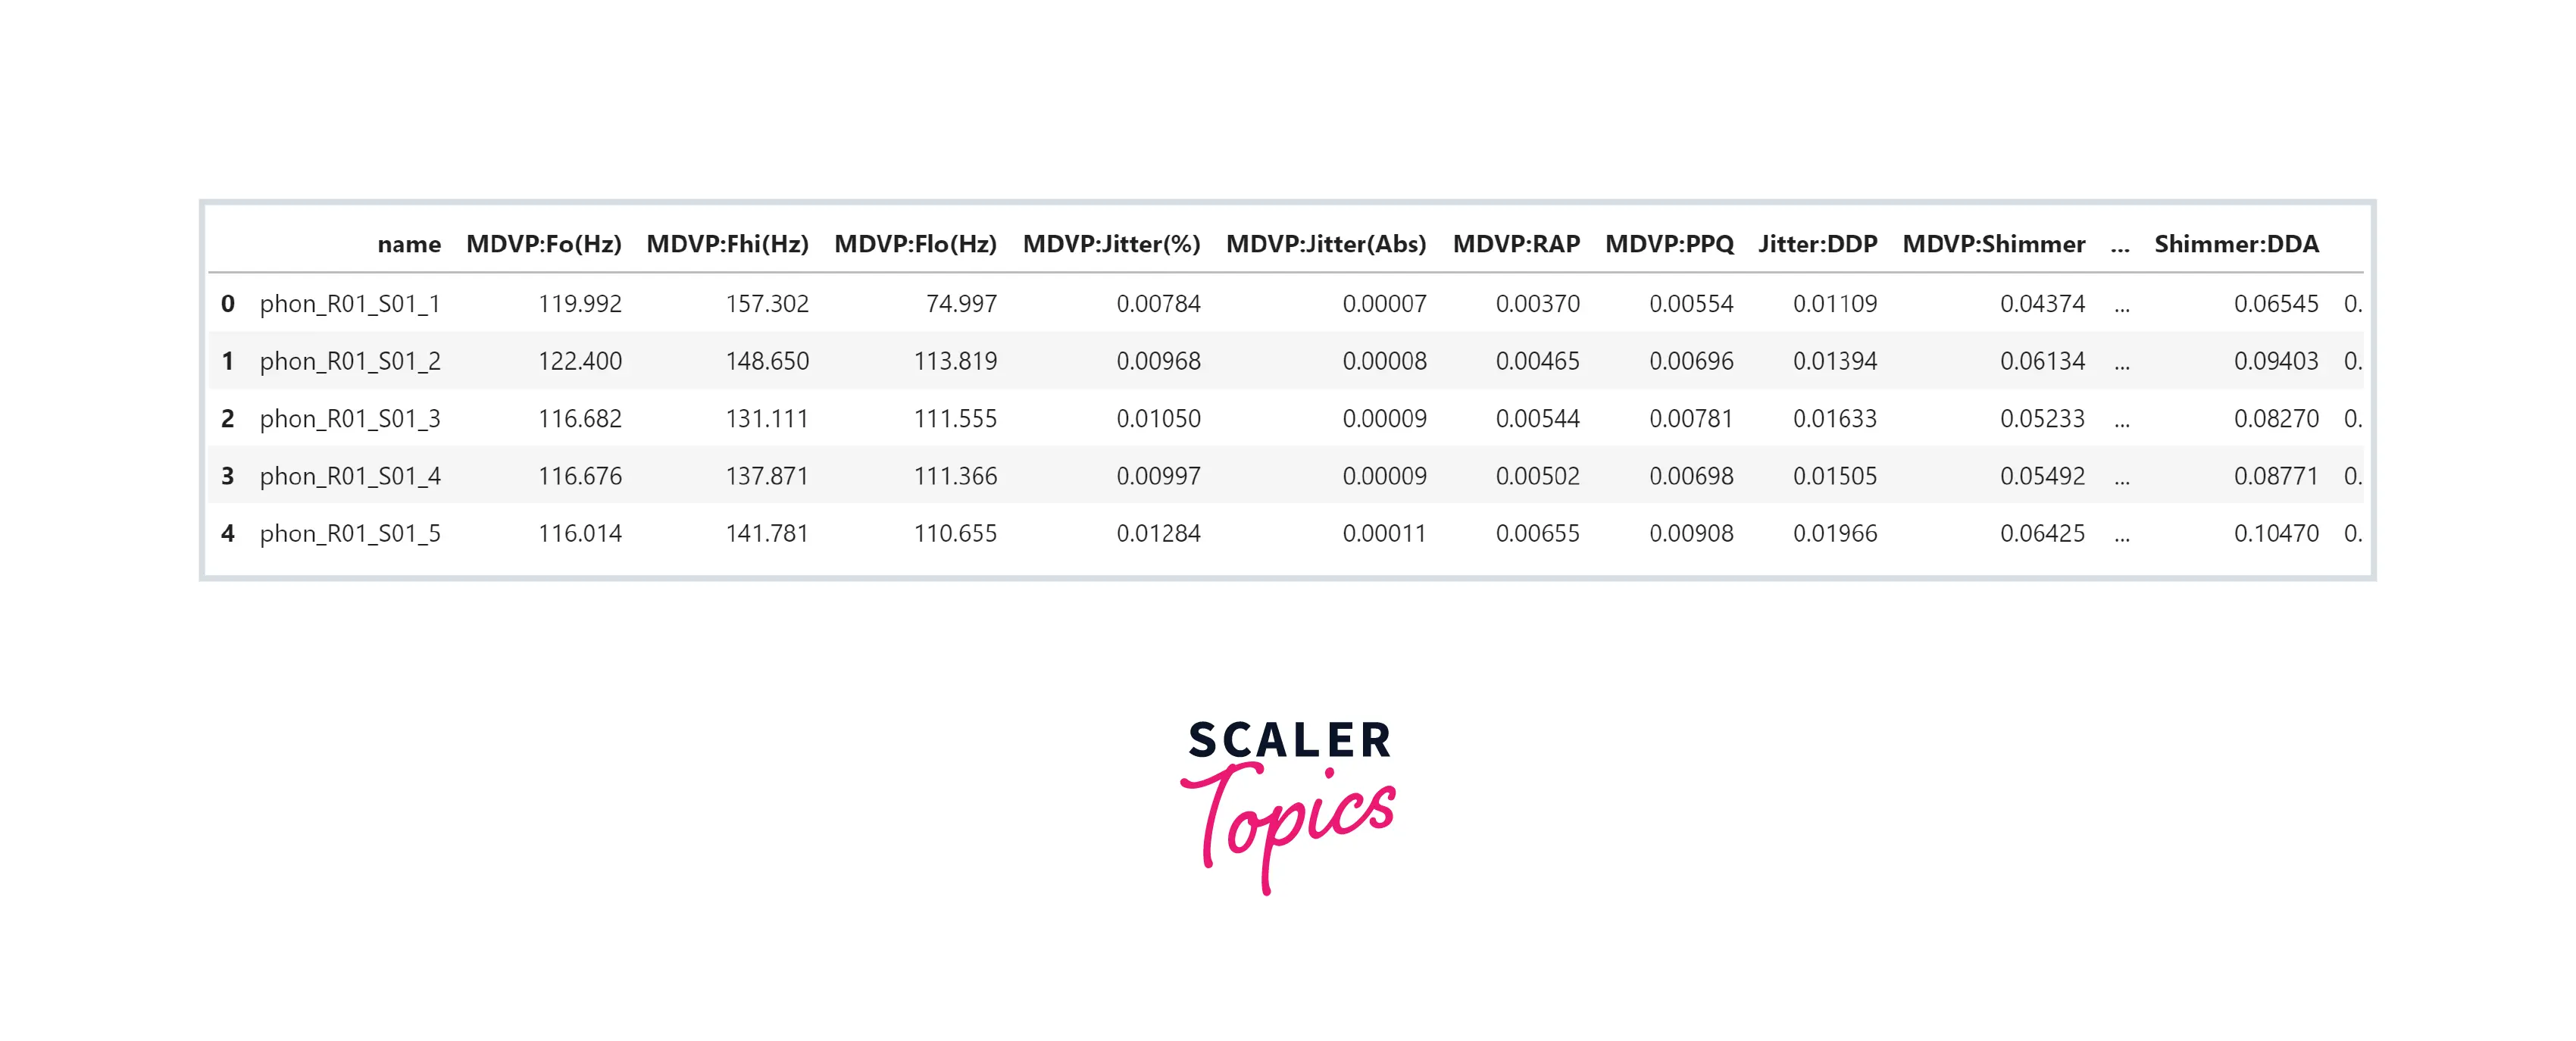
In this project, we will use the UCI ML Parkinsons dataset. It consists of 195 records and 24 columns. The feature status represents whether the patient has Parkinson’s disease or not. Our objective is to build a machine learning-based solution to detect Parkinson’s disease in a patient.
Pre-requisites
- Python
- Data Visualization
- Descriptive Statistics
- Machine Learning
- Data Cleaning and Preprocessing
Transform Your Career
Choose from our industry-leading programs designed for career success
Modern Software and AI Engineering Program
Master full-stack development with AI integration

Modern Data Science and ML with specialisation in AI
Advanced data science techniques with AI specialization
Advanced AIML with Specialisation in Agentic AI
Deep dive into AIML with focus on Agentic systems
DevOps, Cloud & AI Platform Engineering
Build and manage AI-powered cloud infrastructure
AI Engineering Advanced Certification by IIT-Roorkee
Premier AI engineering certification from IIT-Roorkee
How are We Going to Build This?
- We will perform exploratory data analysis (EDA) using various visualization techniques to identify underlying patterns and correlations.
- Further, we will train and develop a Decision Tree, Random Forest, and XGBoost model and compare their performance.
Requirements
We will be using below libraries, tools, and modules in this project -
- Pandas
- Numpy
- Matplotlib
- Seaborn
- Sklearn
- xgboost
Scaler Placement Report and Statistics
Scaler learners achieved 2.5x salary growth with average post-Scaler CTC reaching ₹23L.
Building the Parkinson’s Disease Detector
Import Libraries
Let’s start the project by importing all necessary libraries to load the dataset and perform EDA on it.
Turn Learning into Career Growth
Data Understanding
- Let’s load the dataset in a pandas dataframe and explore variables and their data types.
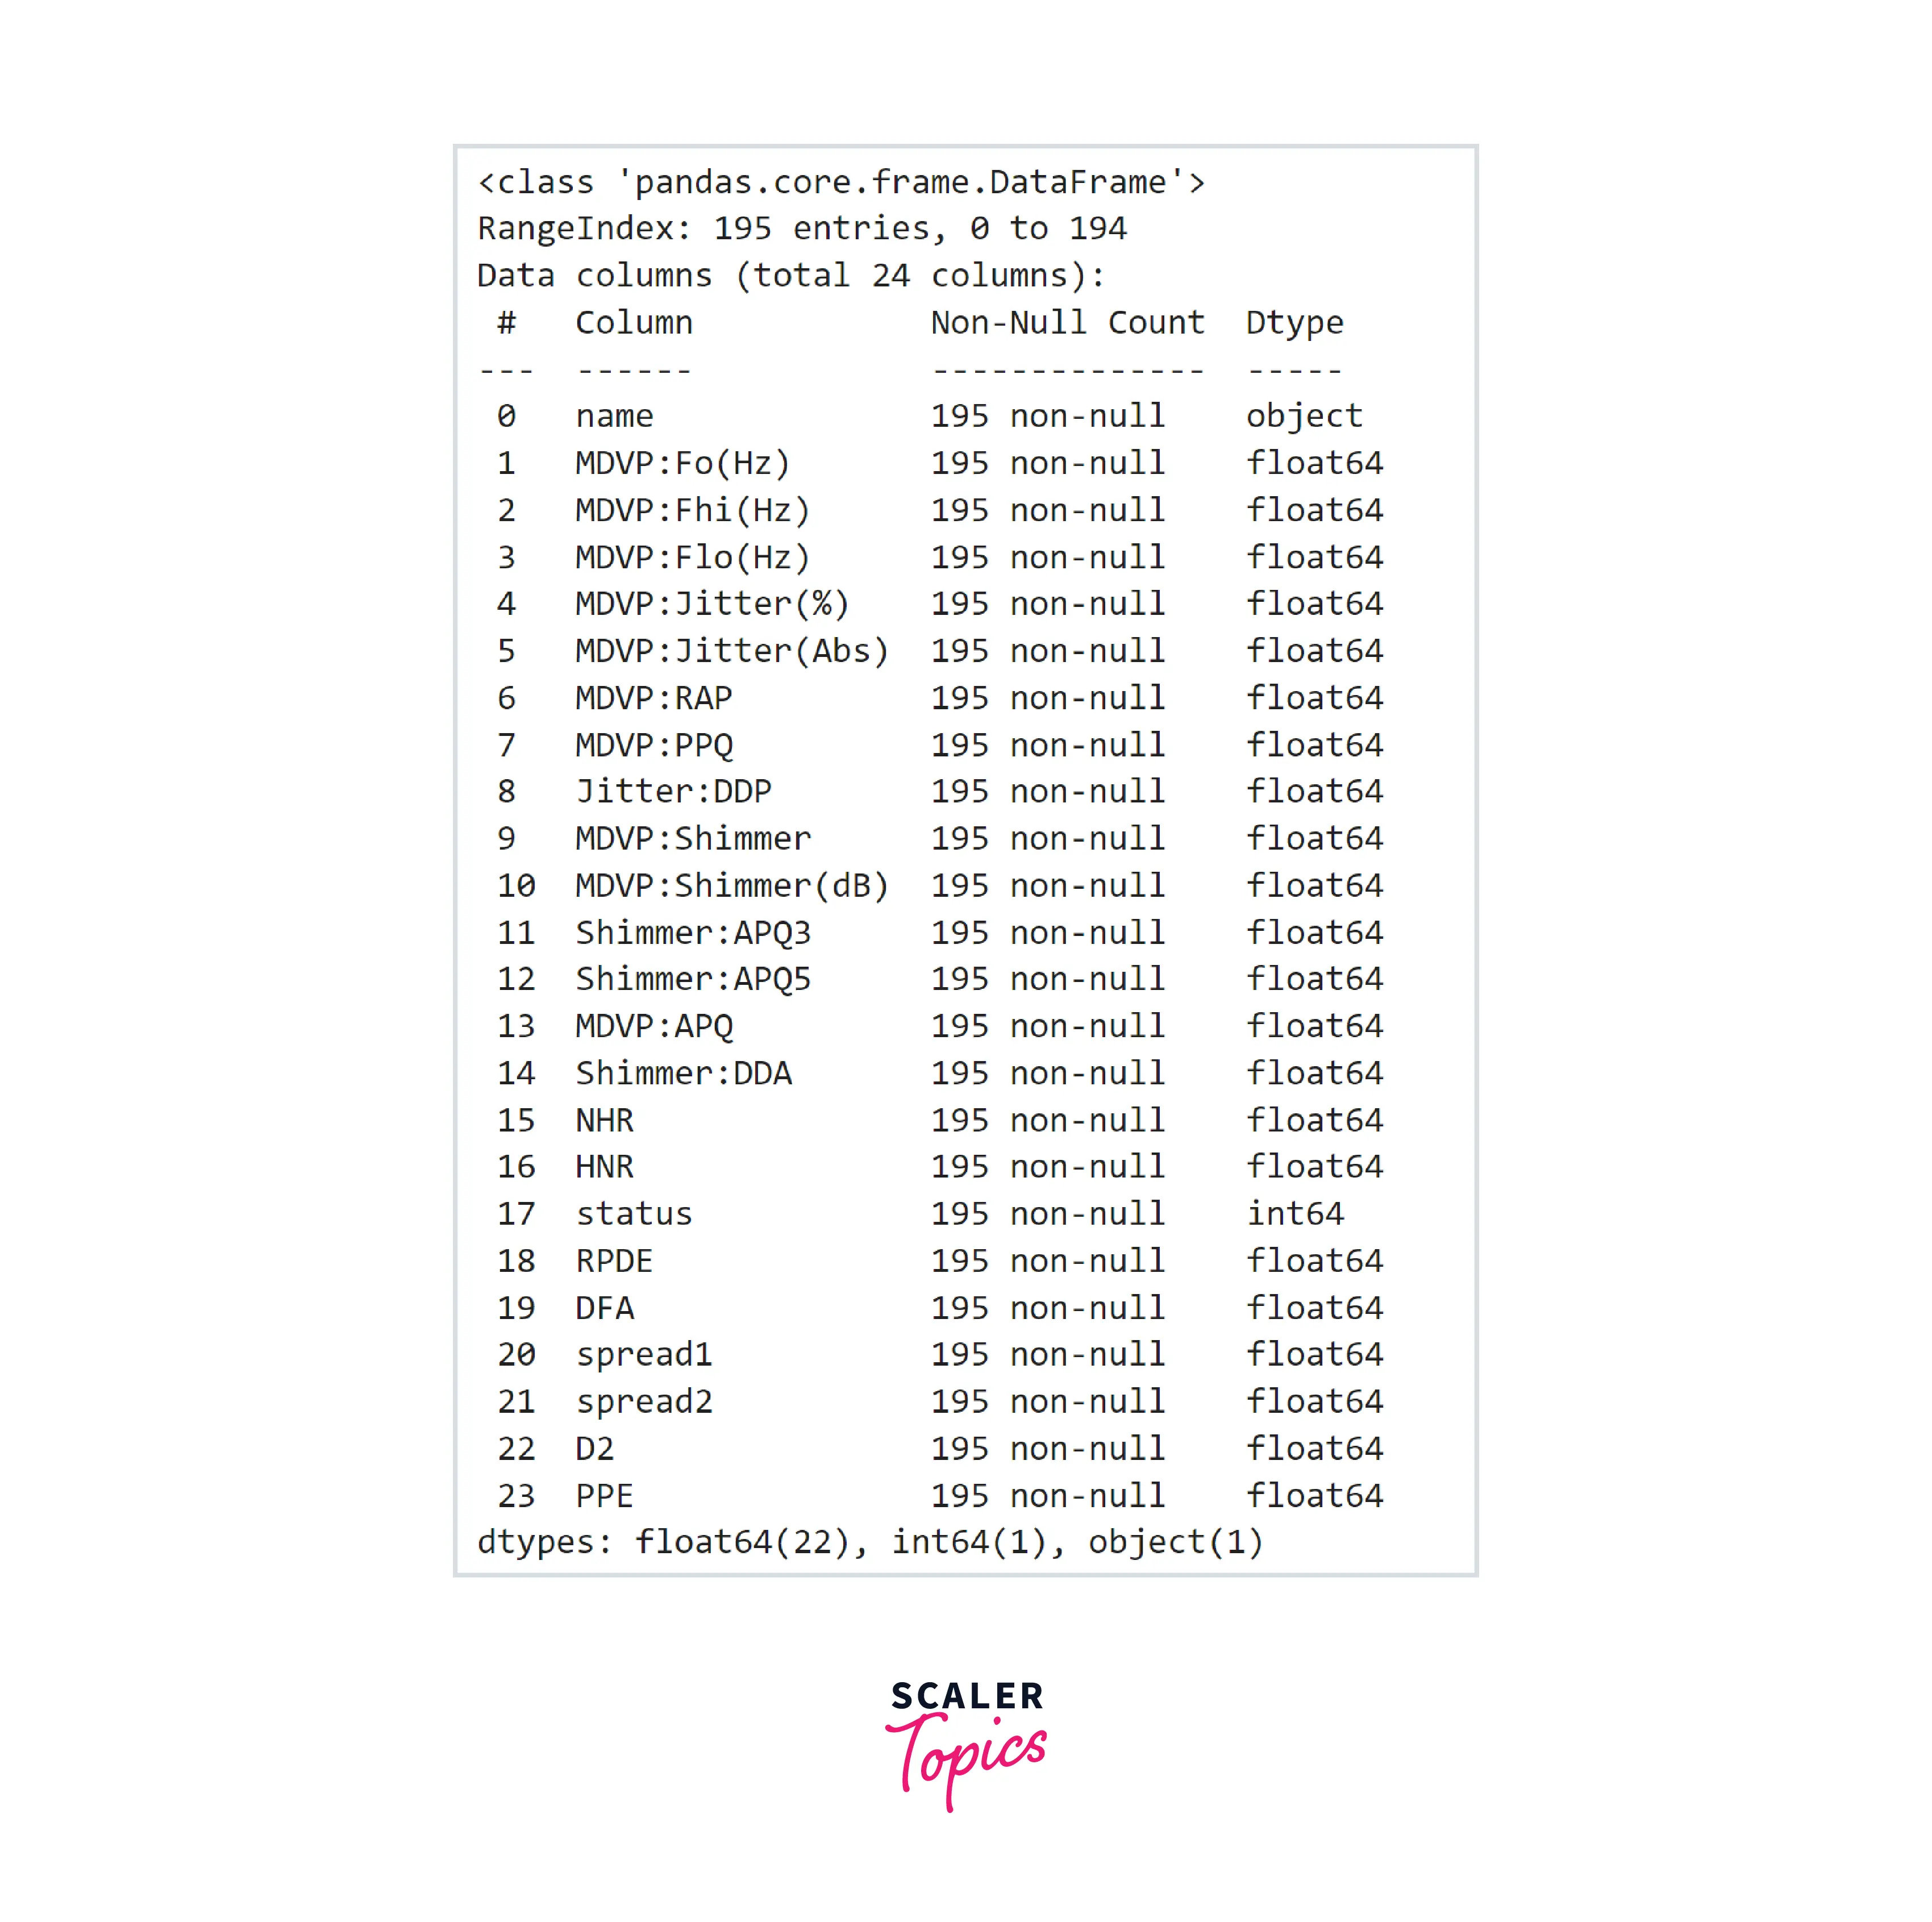
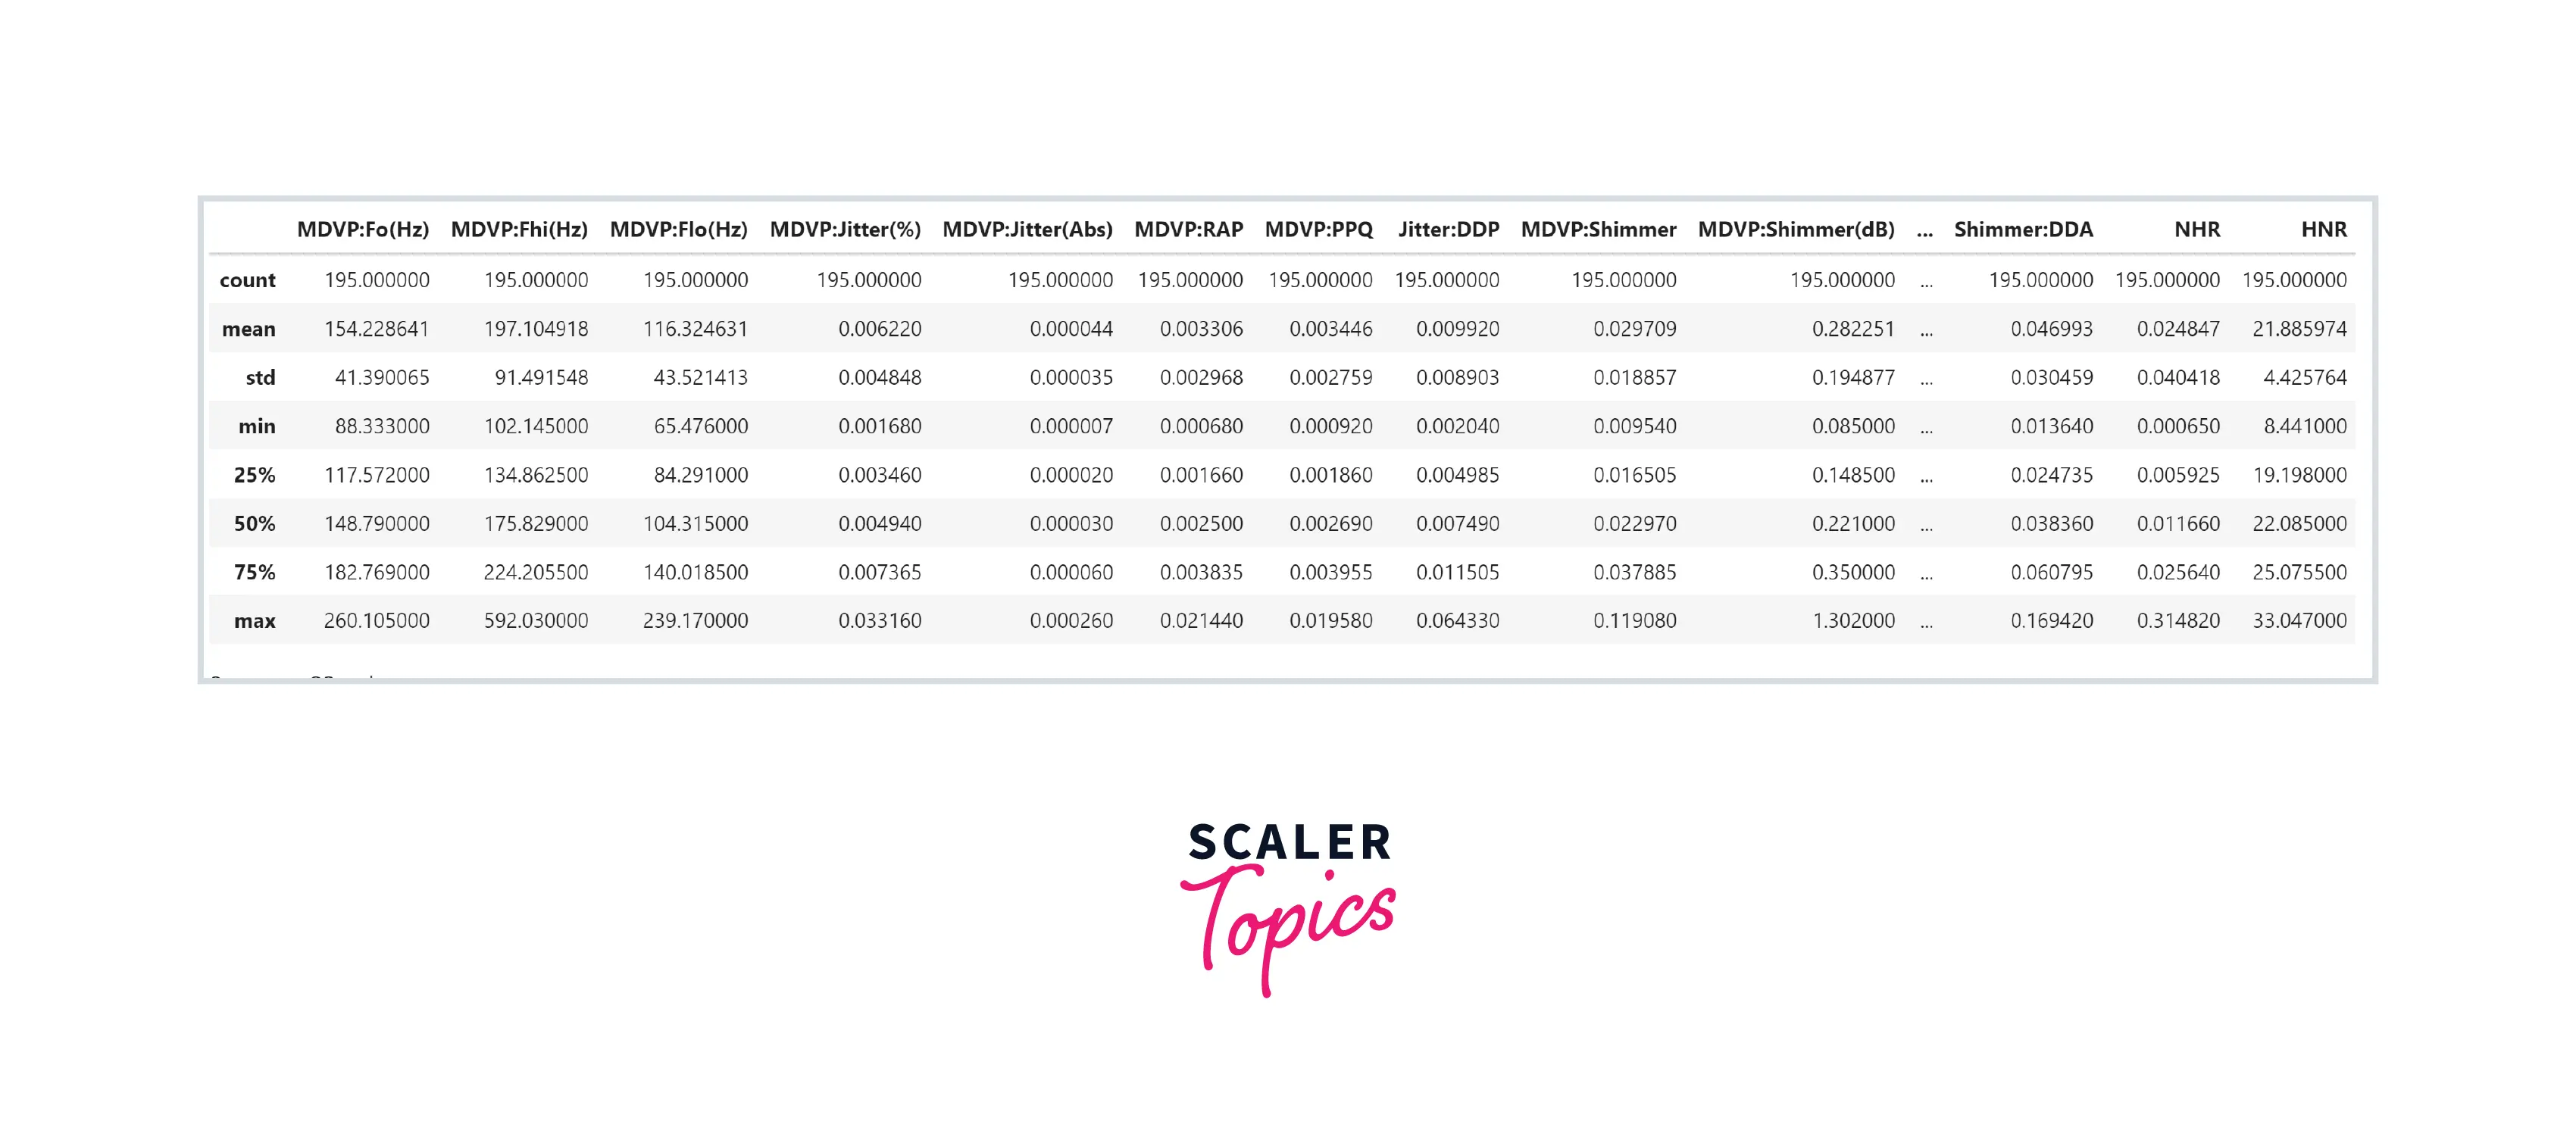
- As we can see, this dataset has 24 features, all features are numeric except the name. There are no NULL values present in any of the features. Let’s have a look at the summary statistics of the features in this dataset.
Exploratory Data Analysis
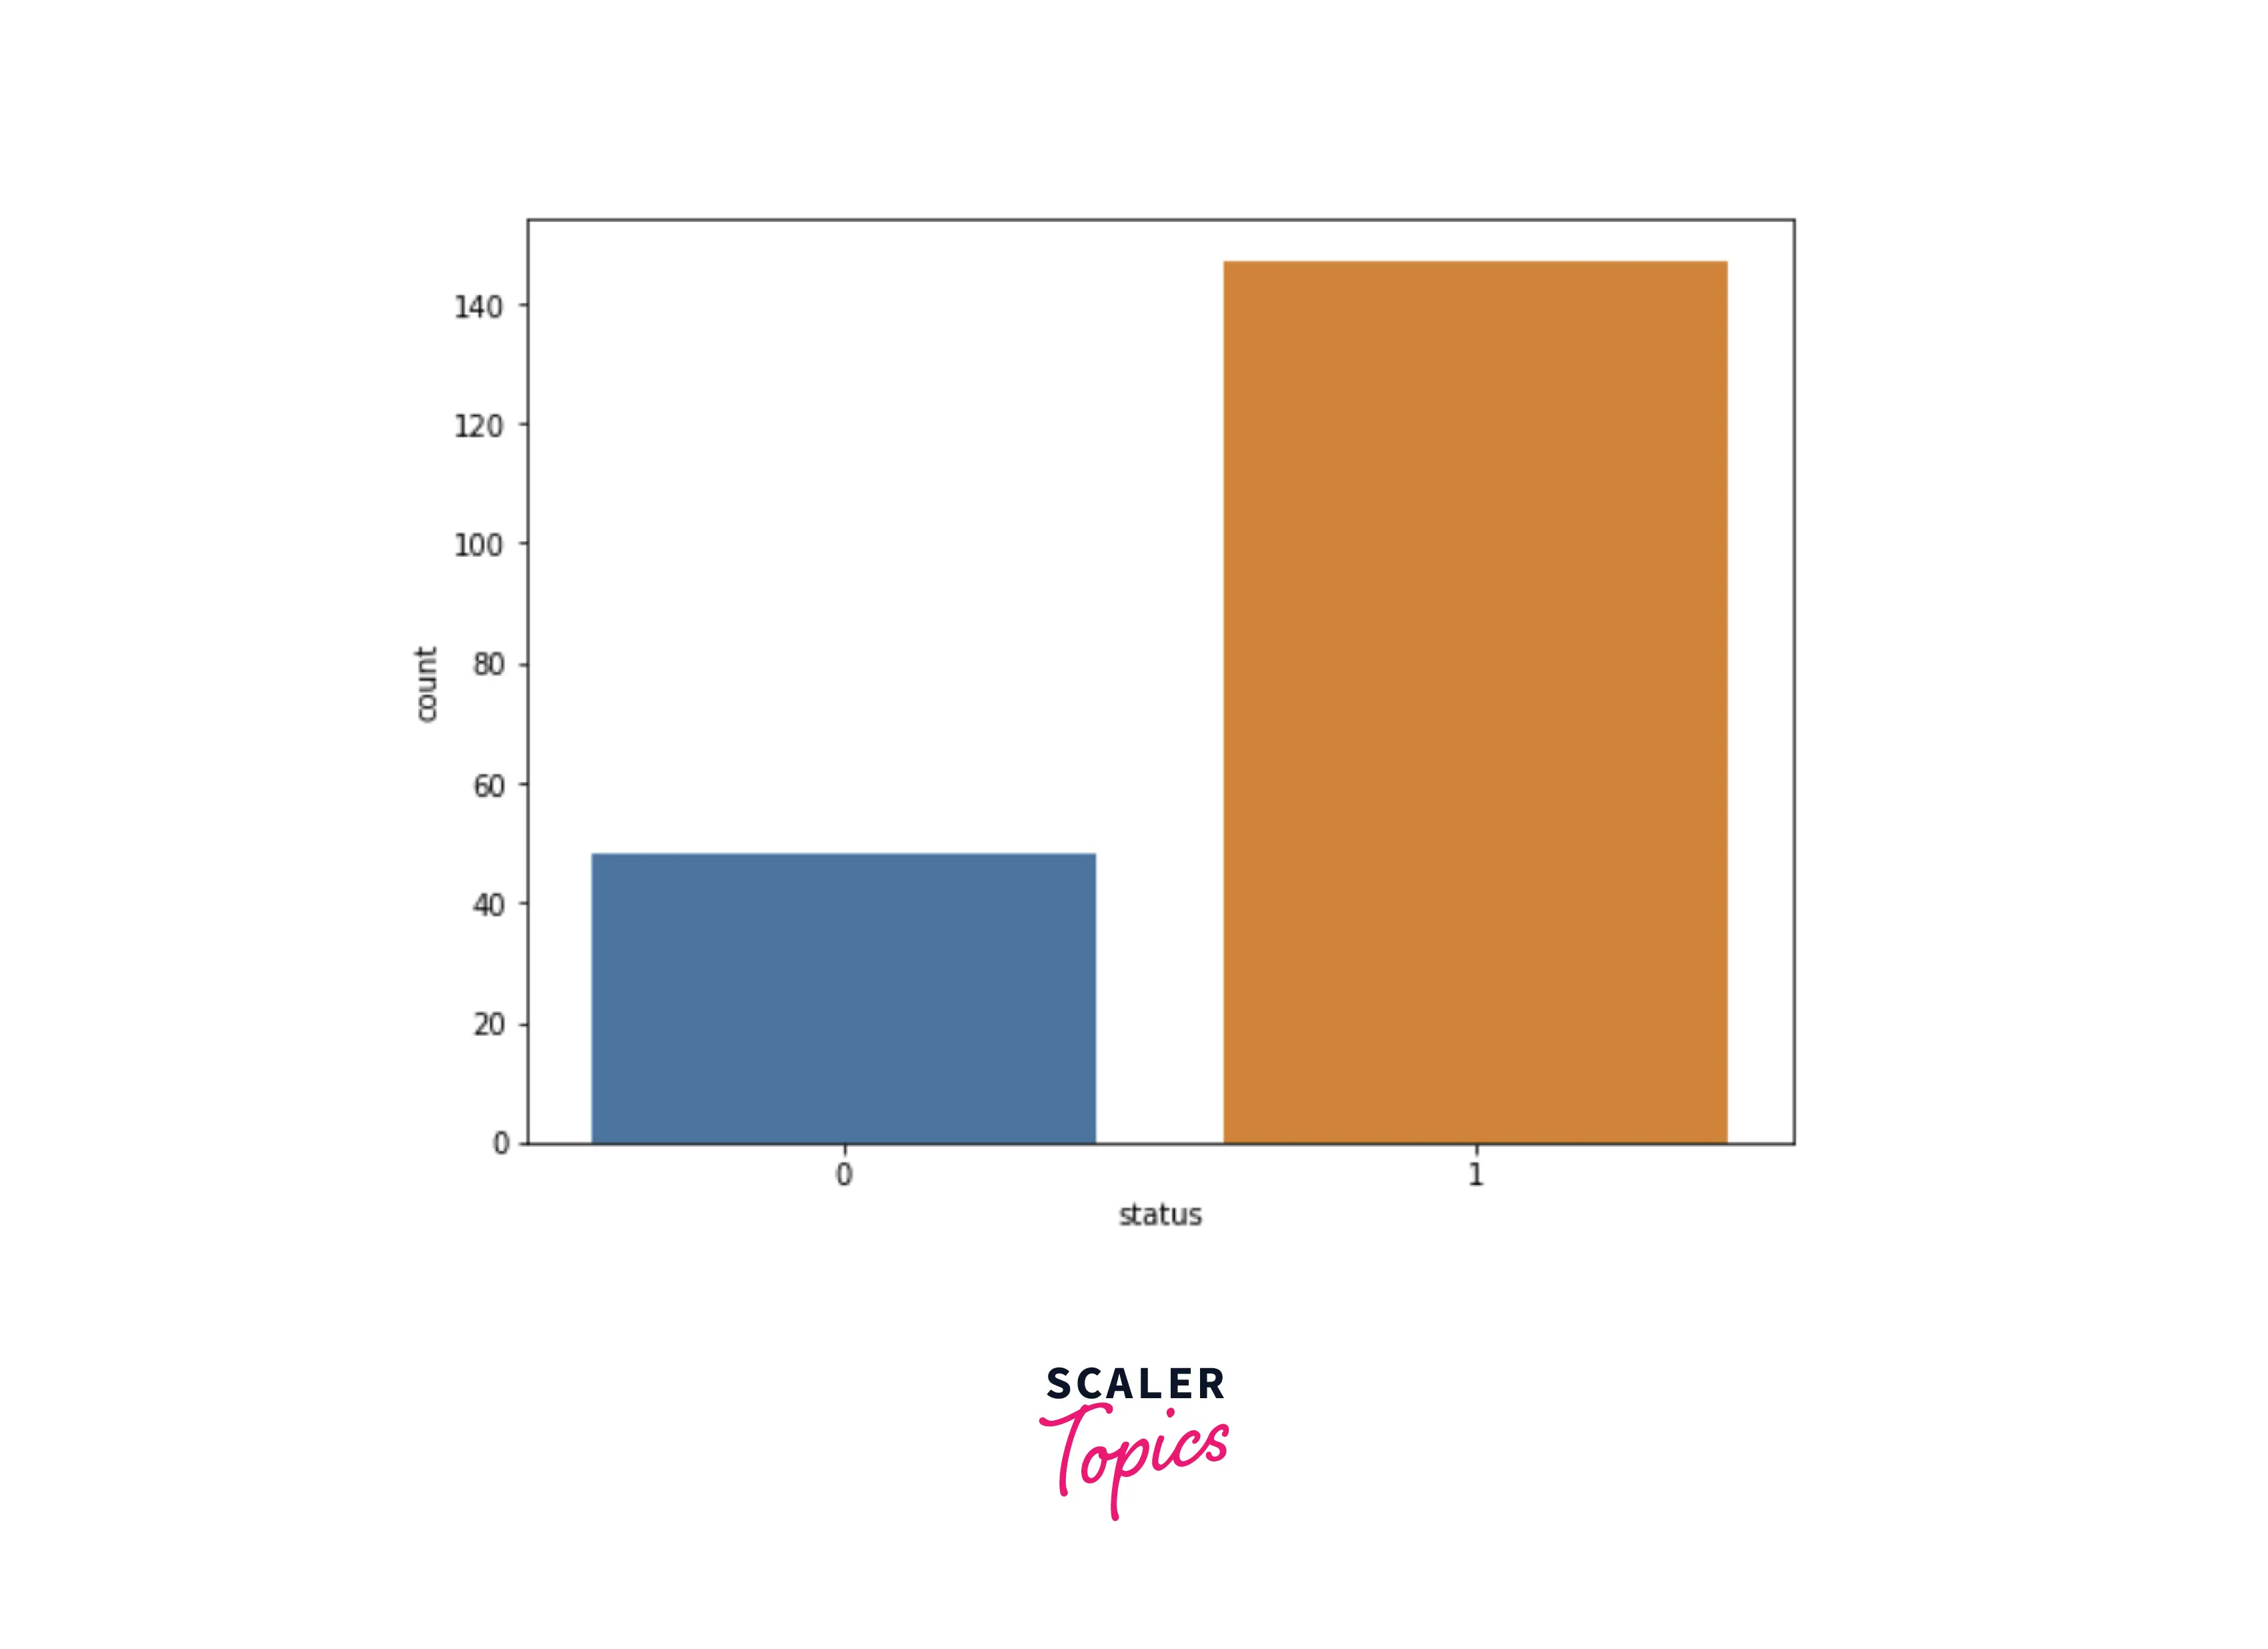
- Let’s explore the distribution of the target variable. In this dataset, 75% of the records belong to patients having Parkinson’s disease.
- As most of the features are continuous and numeric in this dataset, let’s explore the correlation matrix of this dataset.
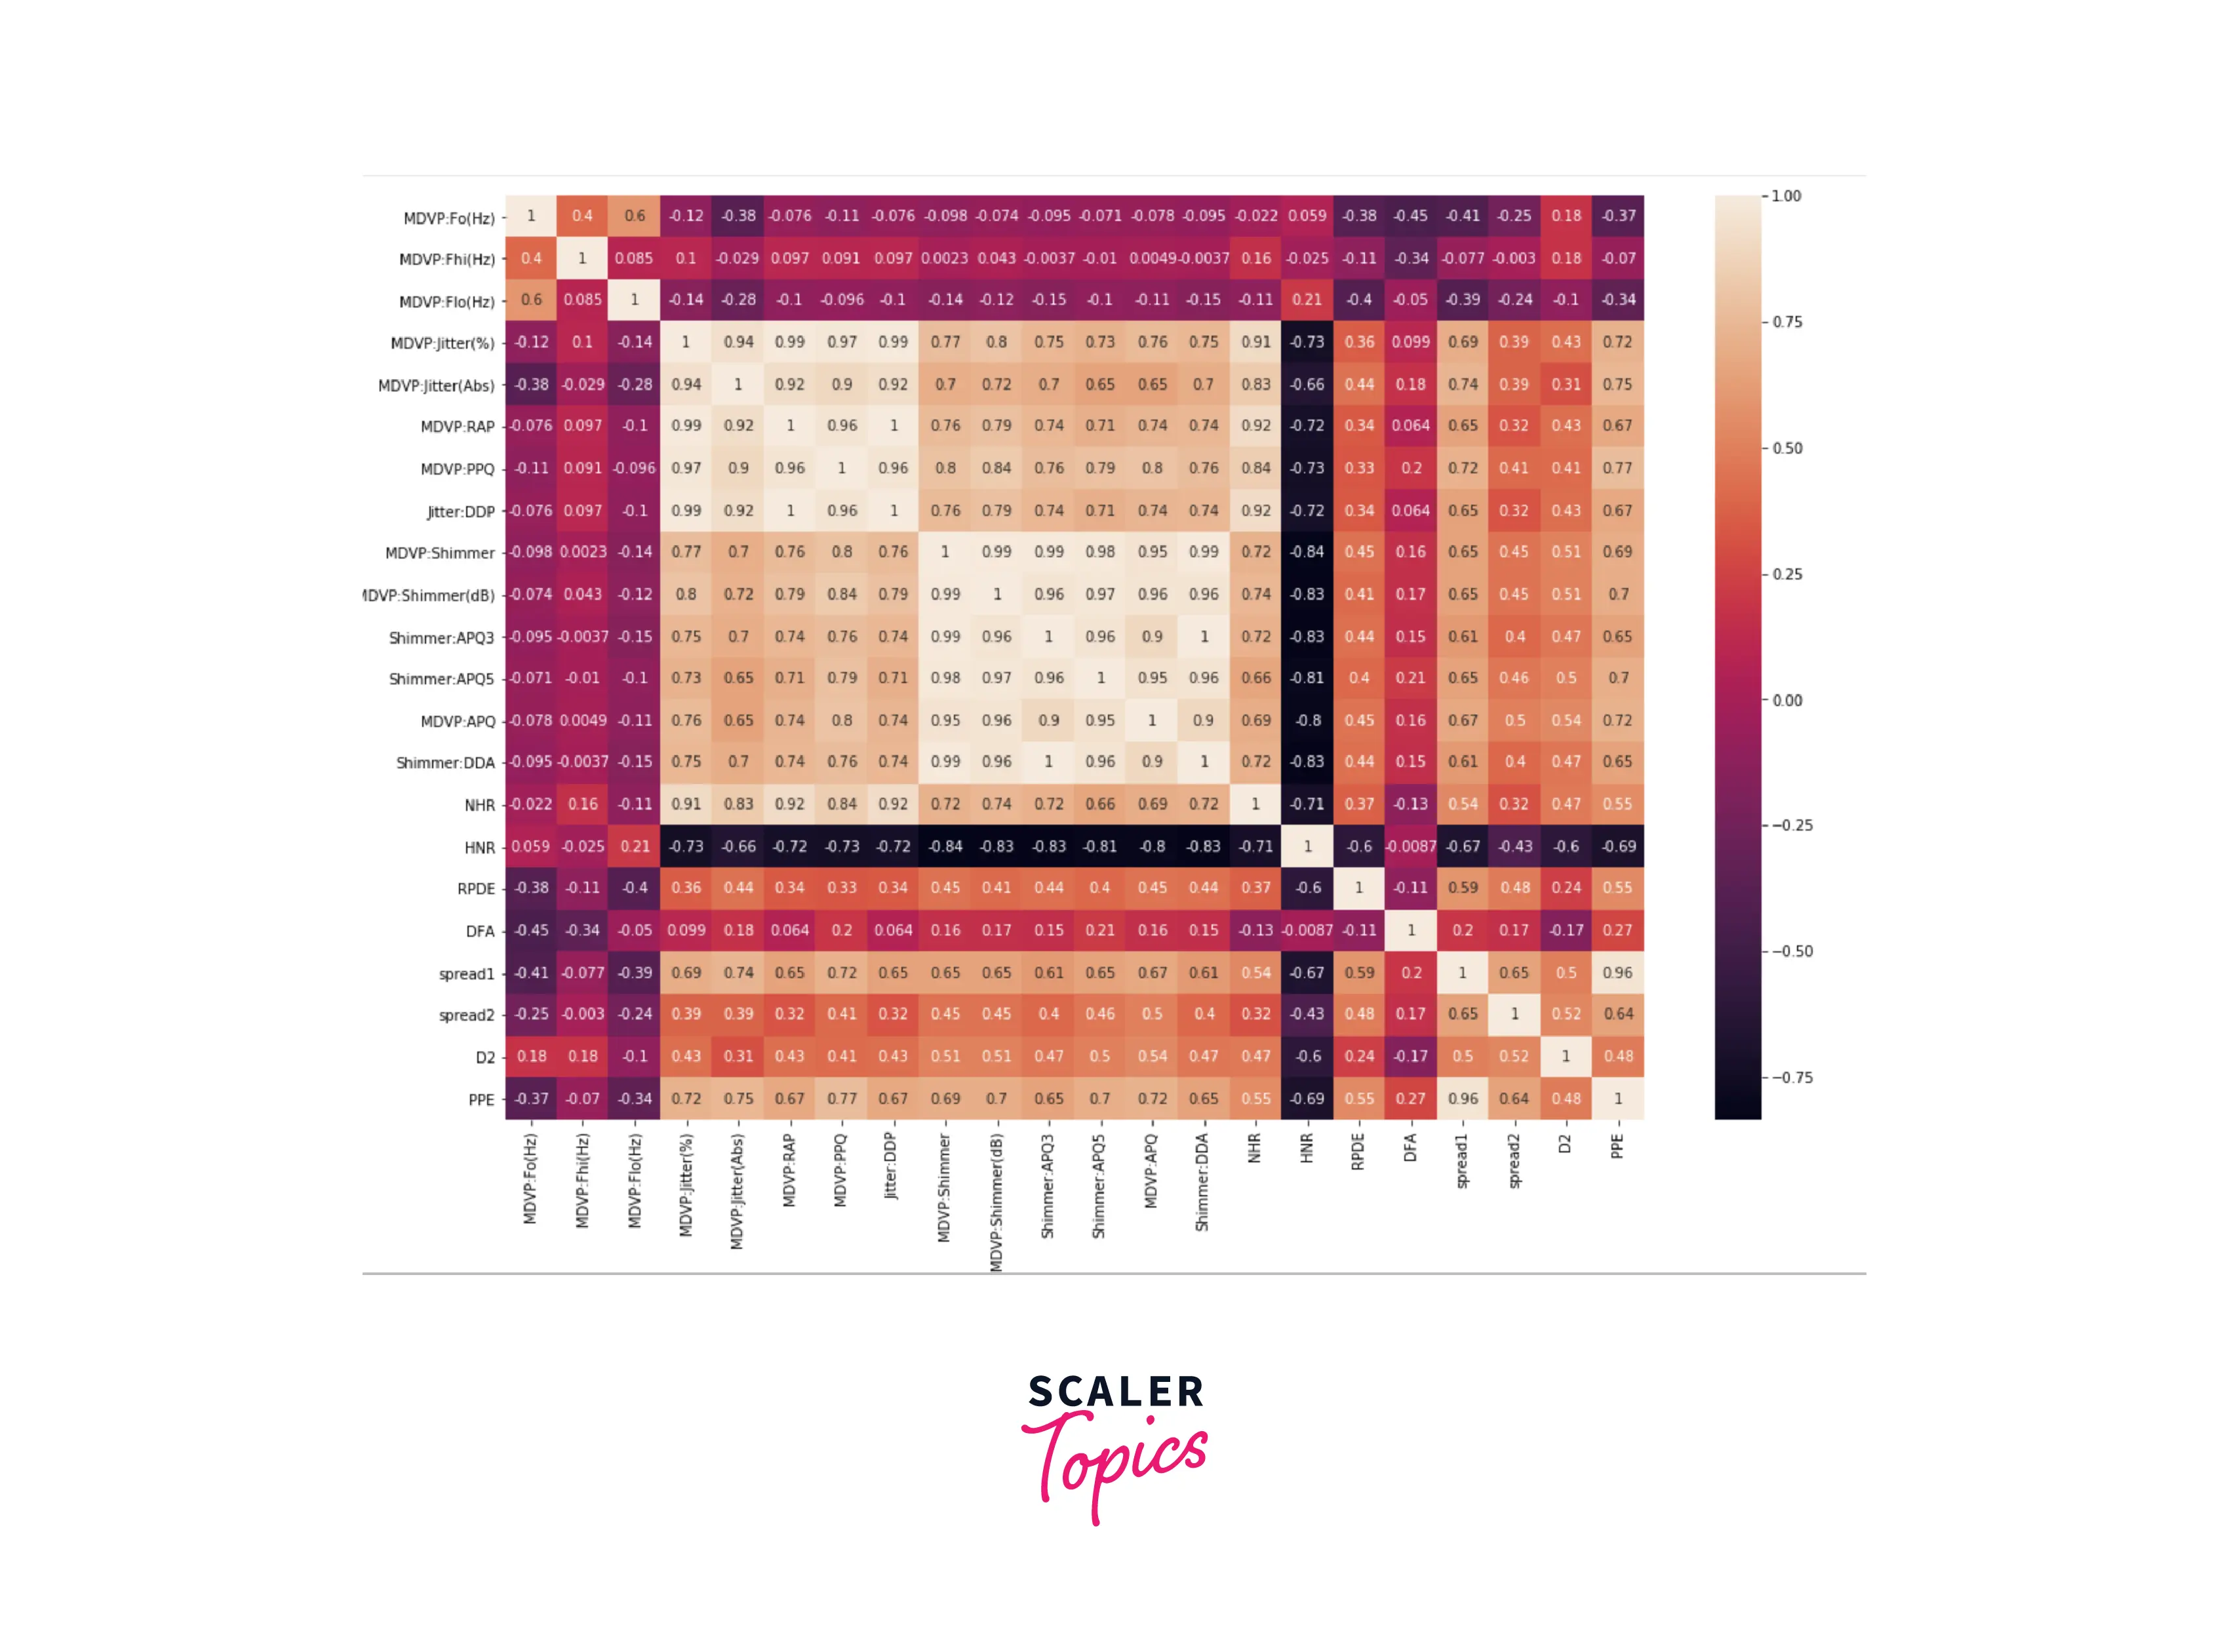
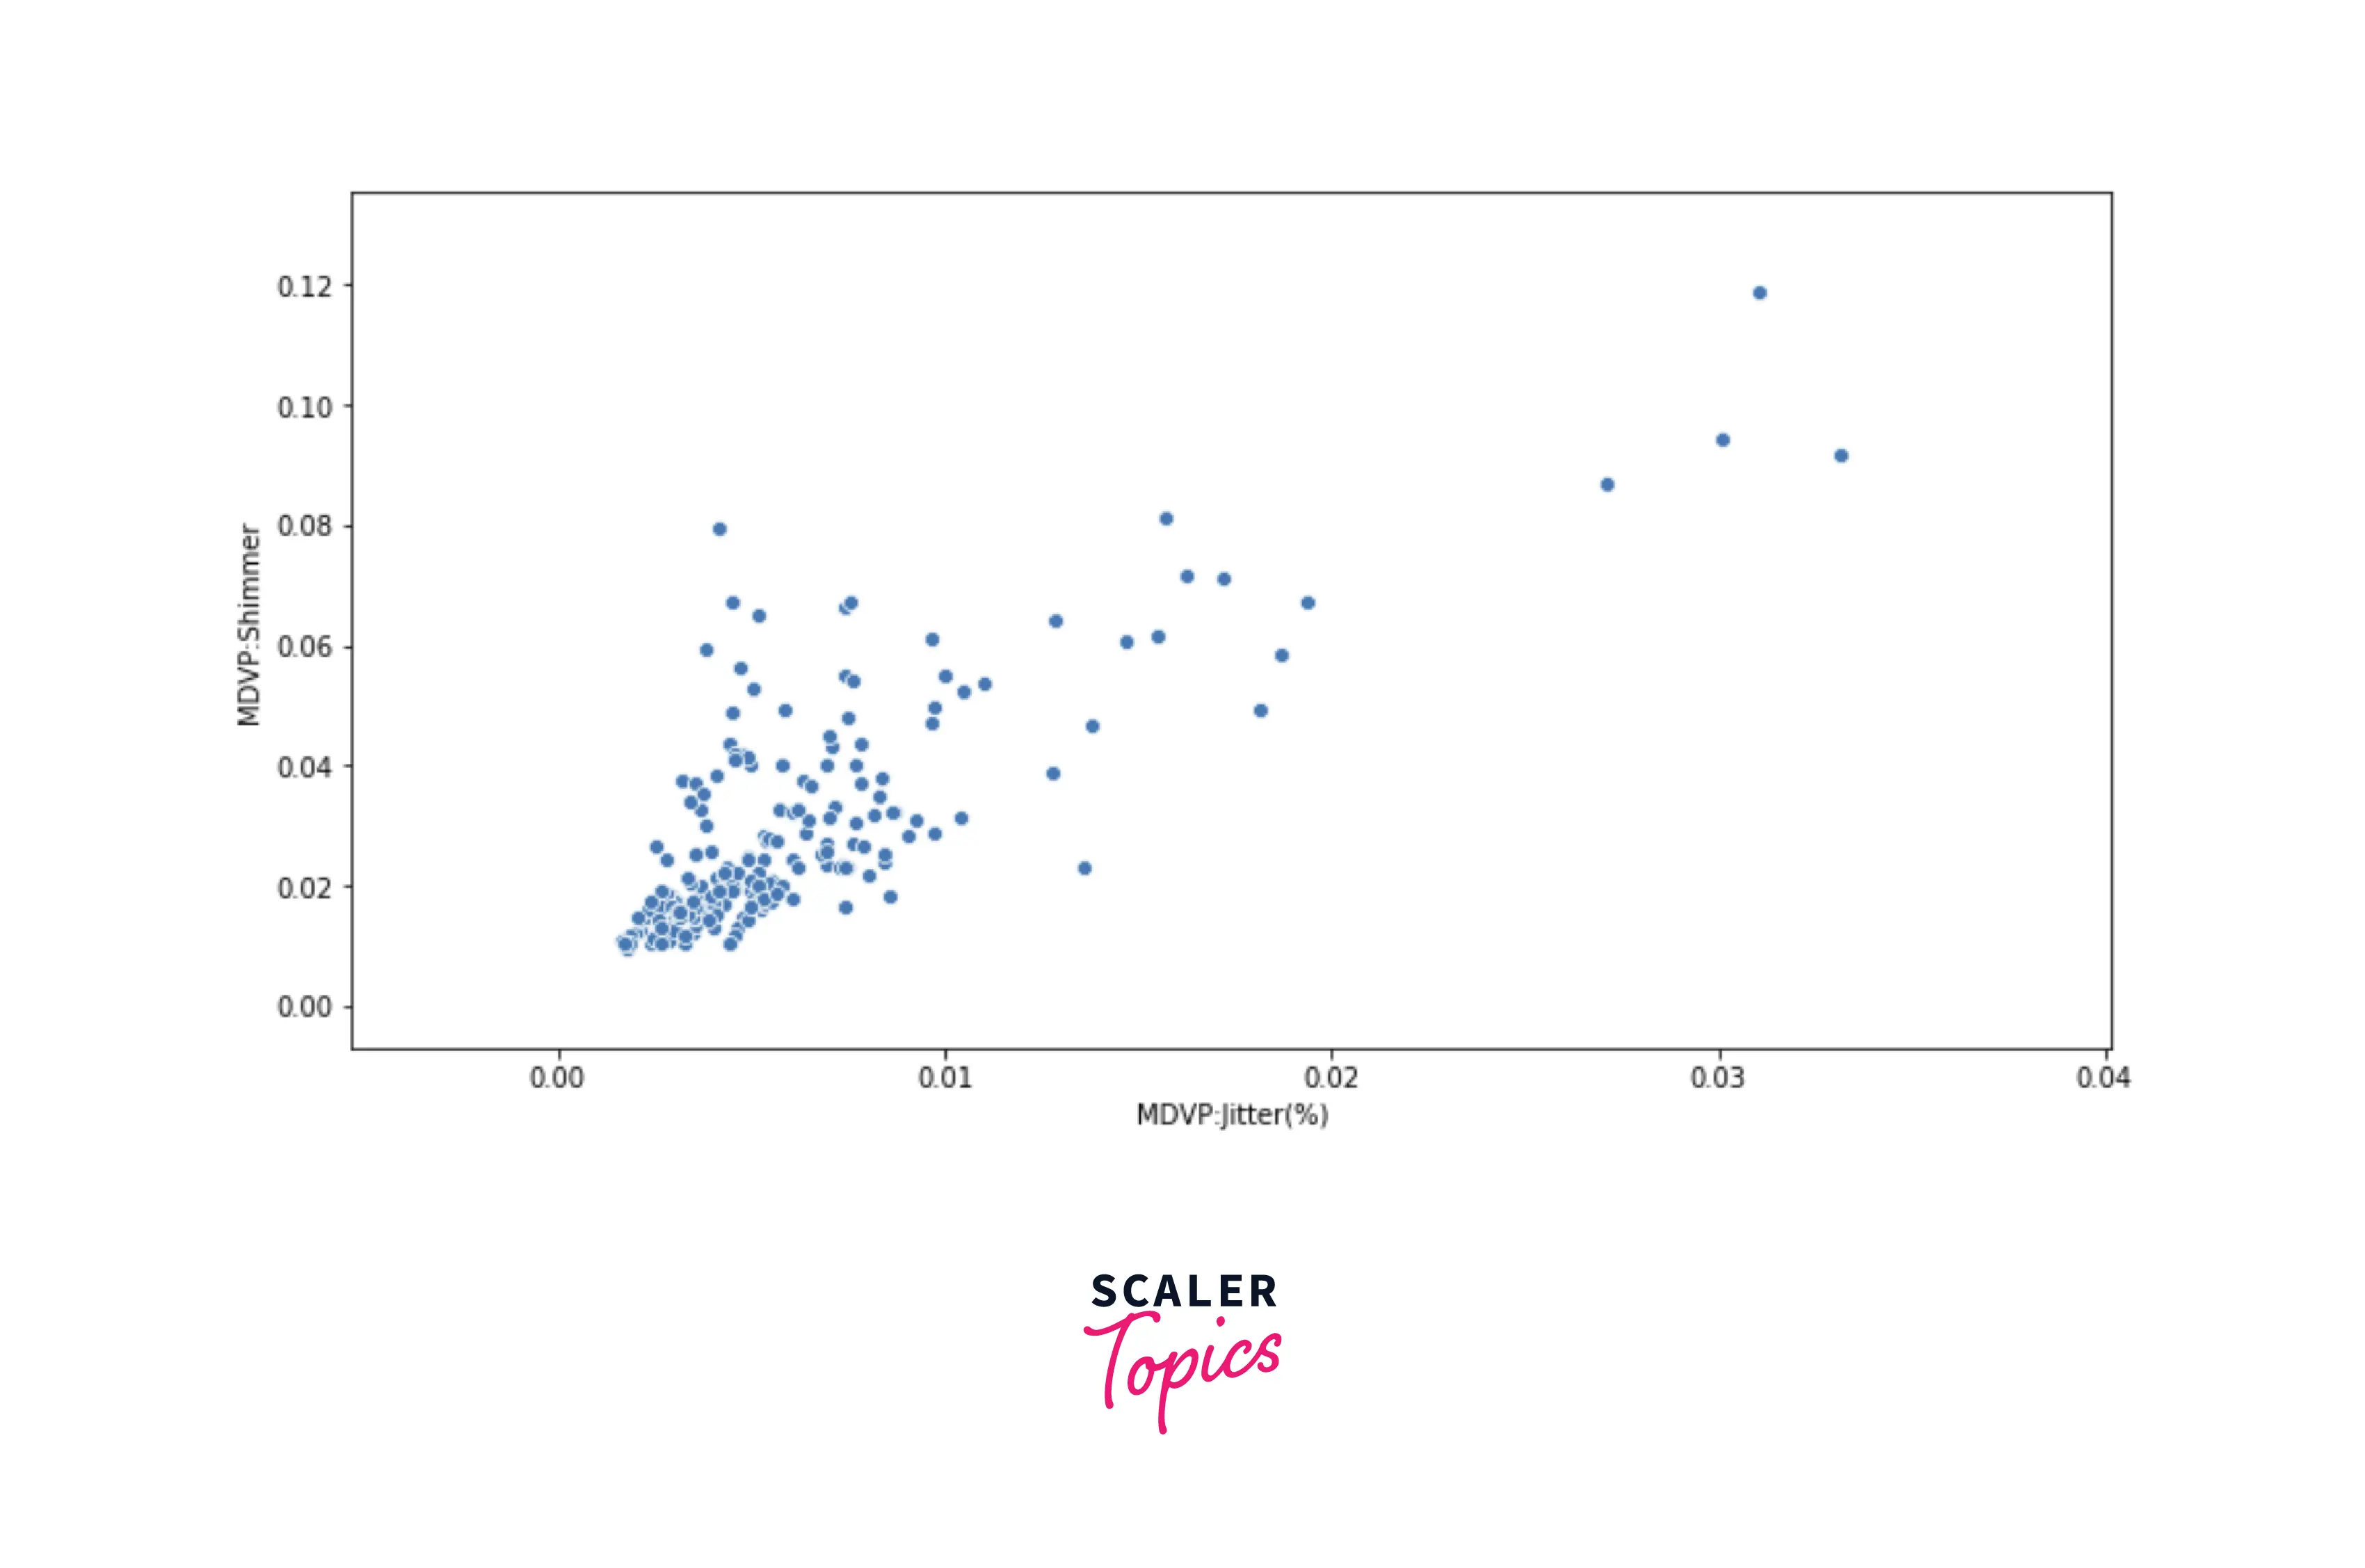
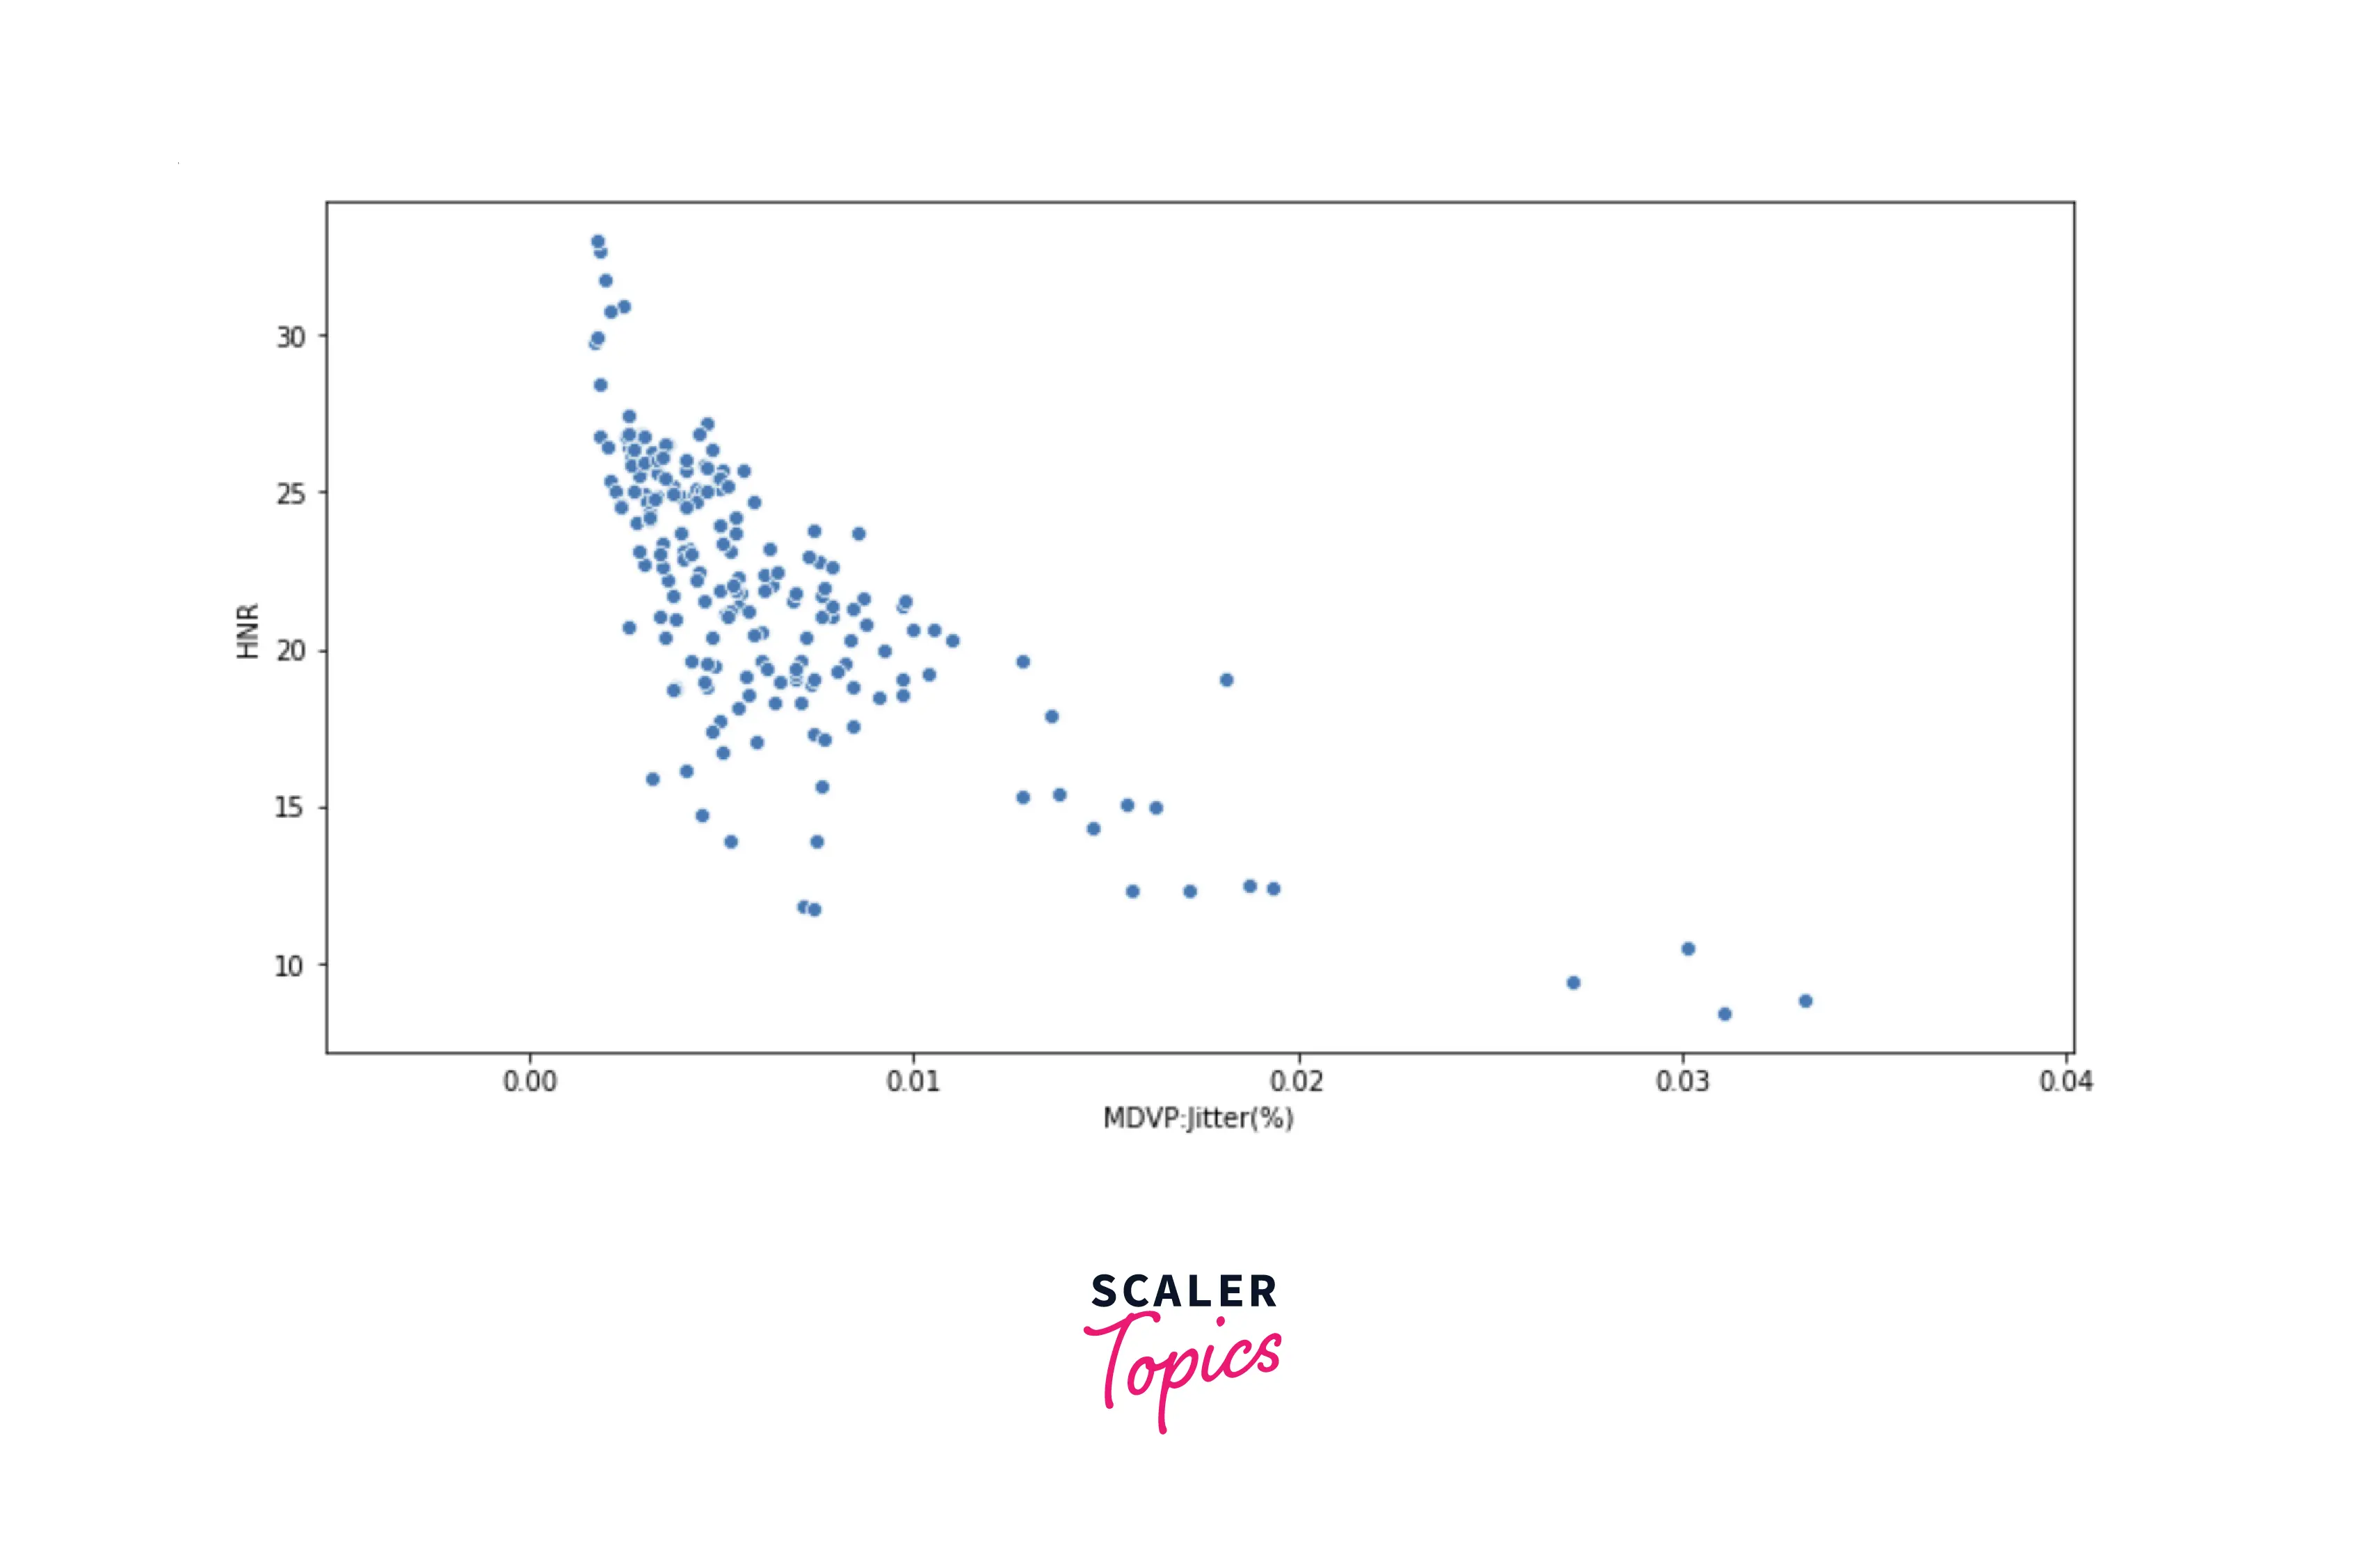
- As we can see in the above heatmap, features MDVP:Jitter(%) and MDVP:Shimmer have a strong positive correlation, and features MDVP:Jitter(%) and HNR have a strong negative correlation. Let’s plot the scatter plots to validate to visualize the correlations between these variables.
Data Preprocessing
- Before developing the ML models, let’s standardize each feature in the dataset. We will use the StandardScaler class provided by the sklearn library in Python. Further, we will split the input data into training and testing data with an 80:20 ratio.
Developing the ML Models
- Let’s first train a simple decision tree classifier and evaluate its performance. In this project, we will use accuracy and F1 score to compare and evaluate the performance of the ML models.
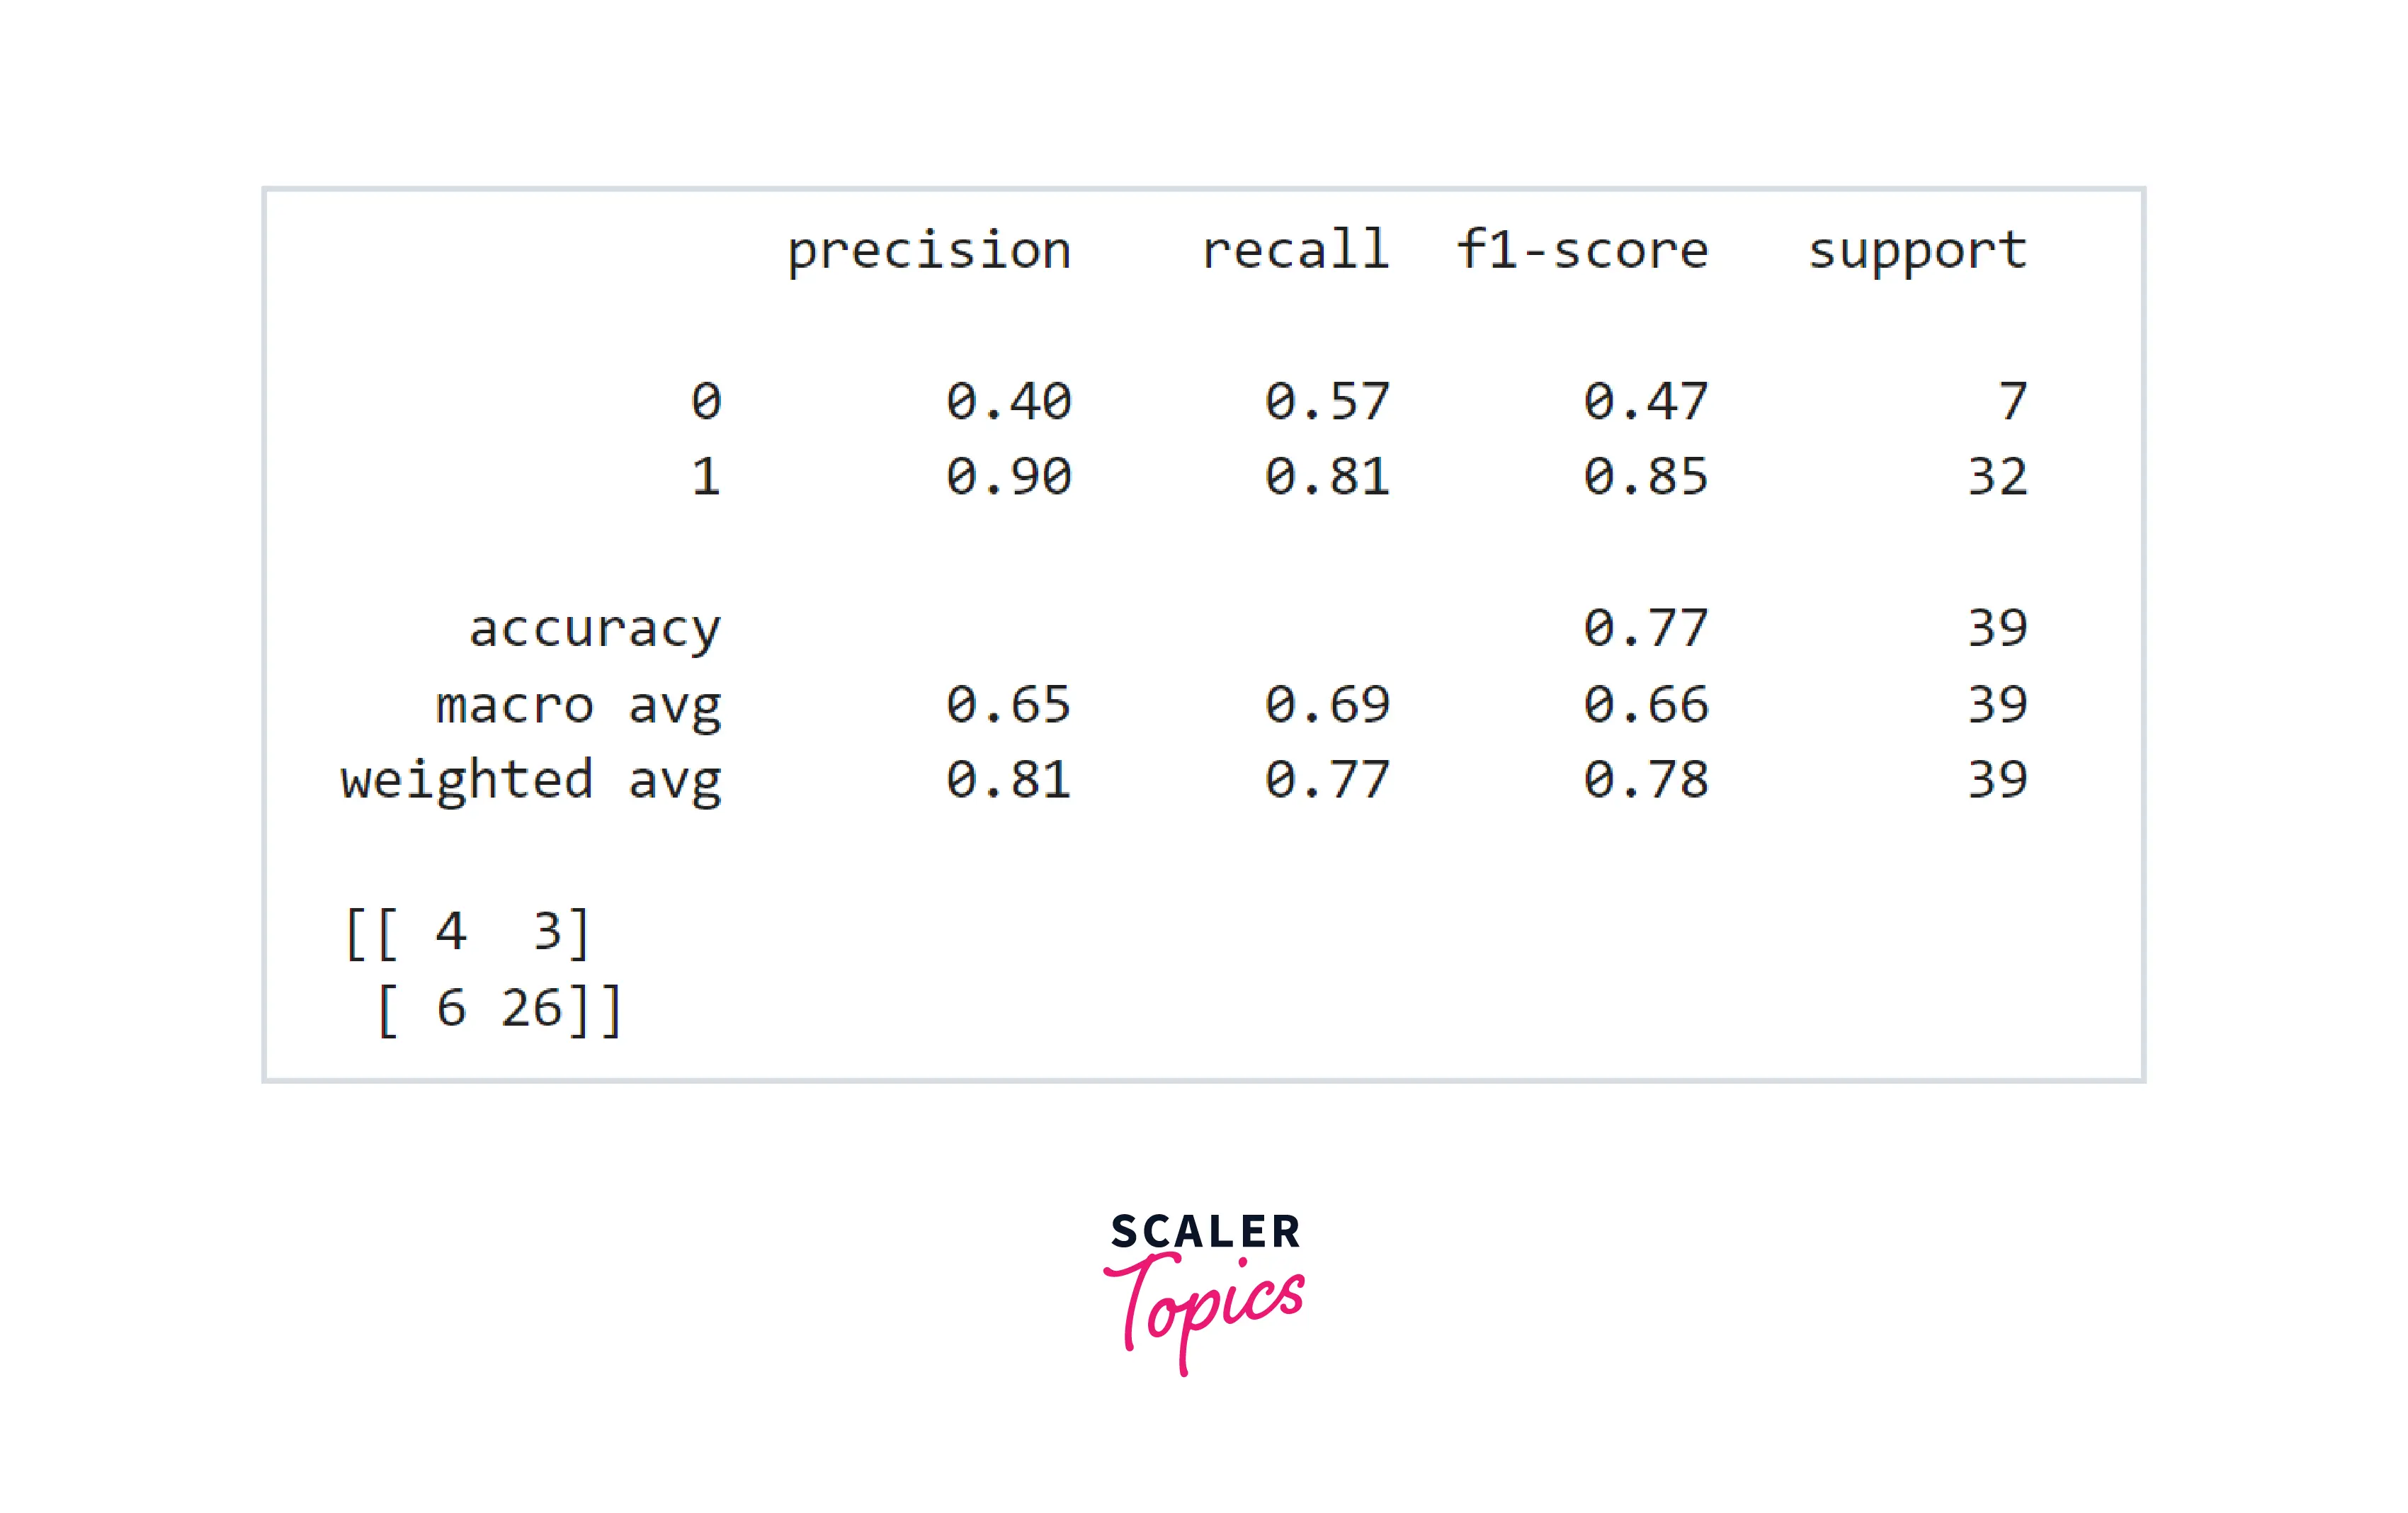
- As we can see in the above figure the accuracy is 77% and F1 Score for the positive class is 0.85. These are not good numbers, and let’s build a Random Forest classifier and check whether we get any improvement in accuracy and F1 score or not.
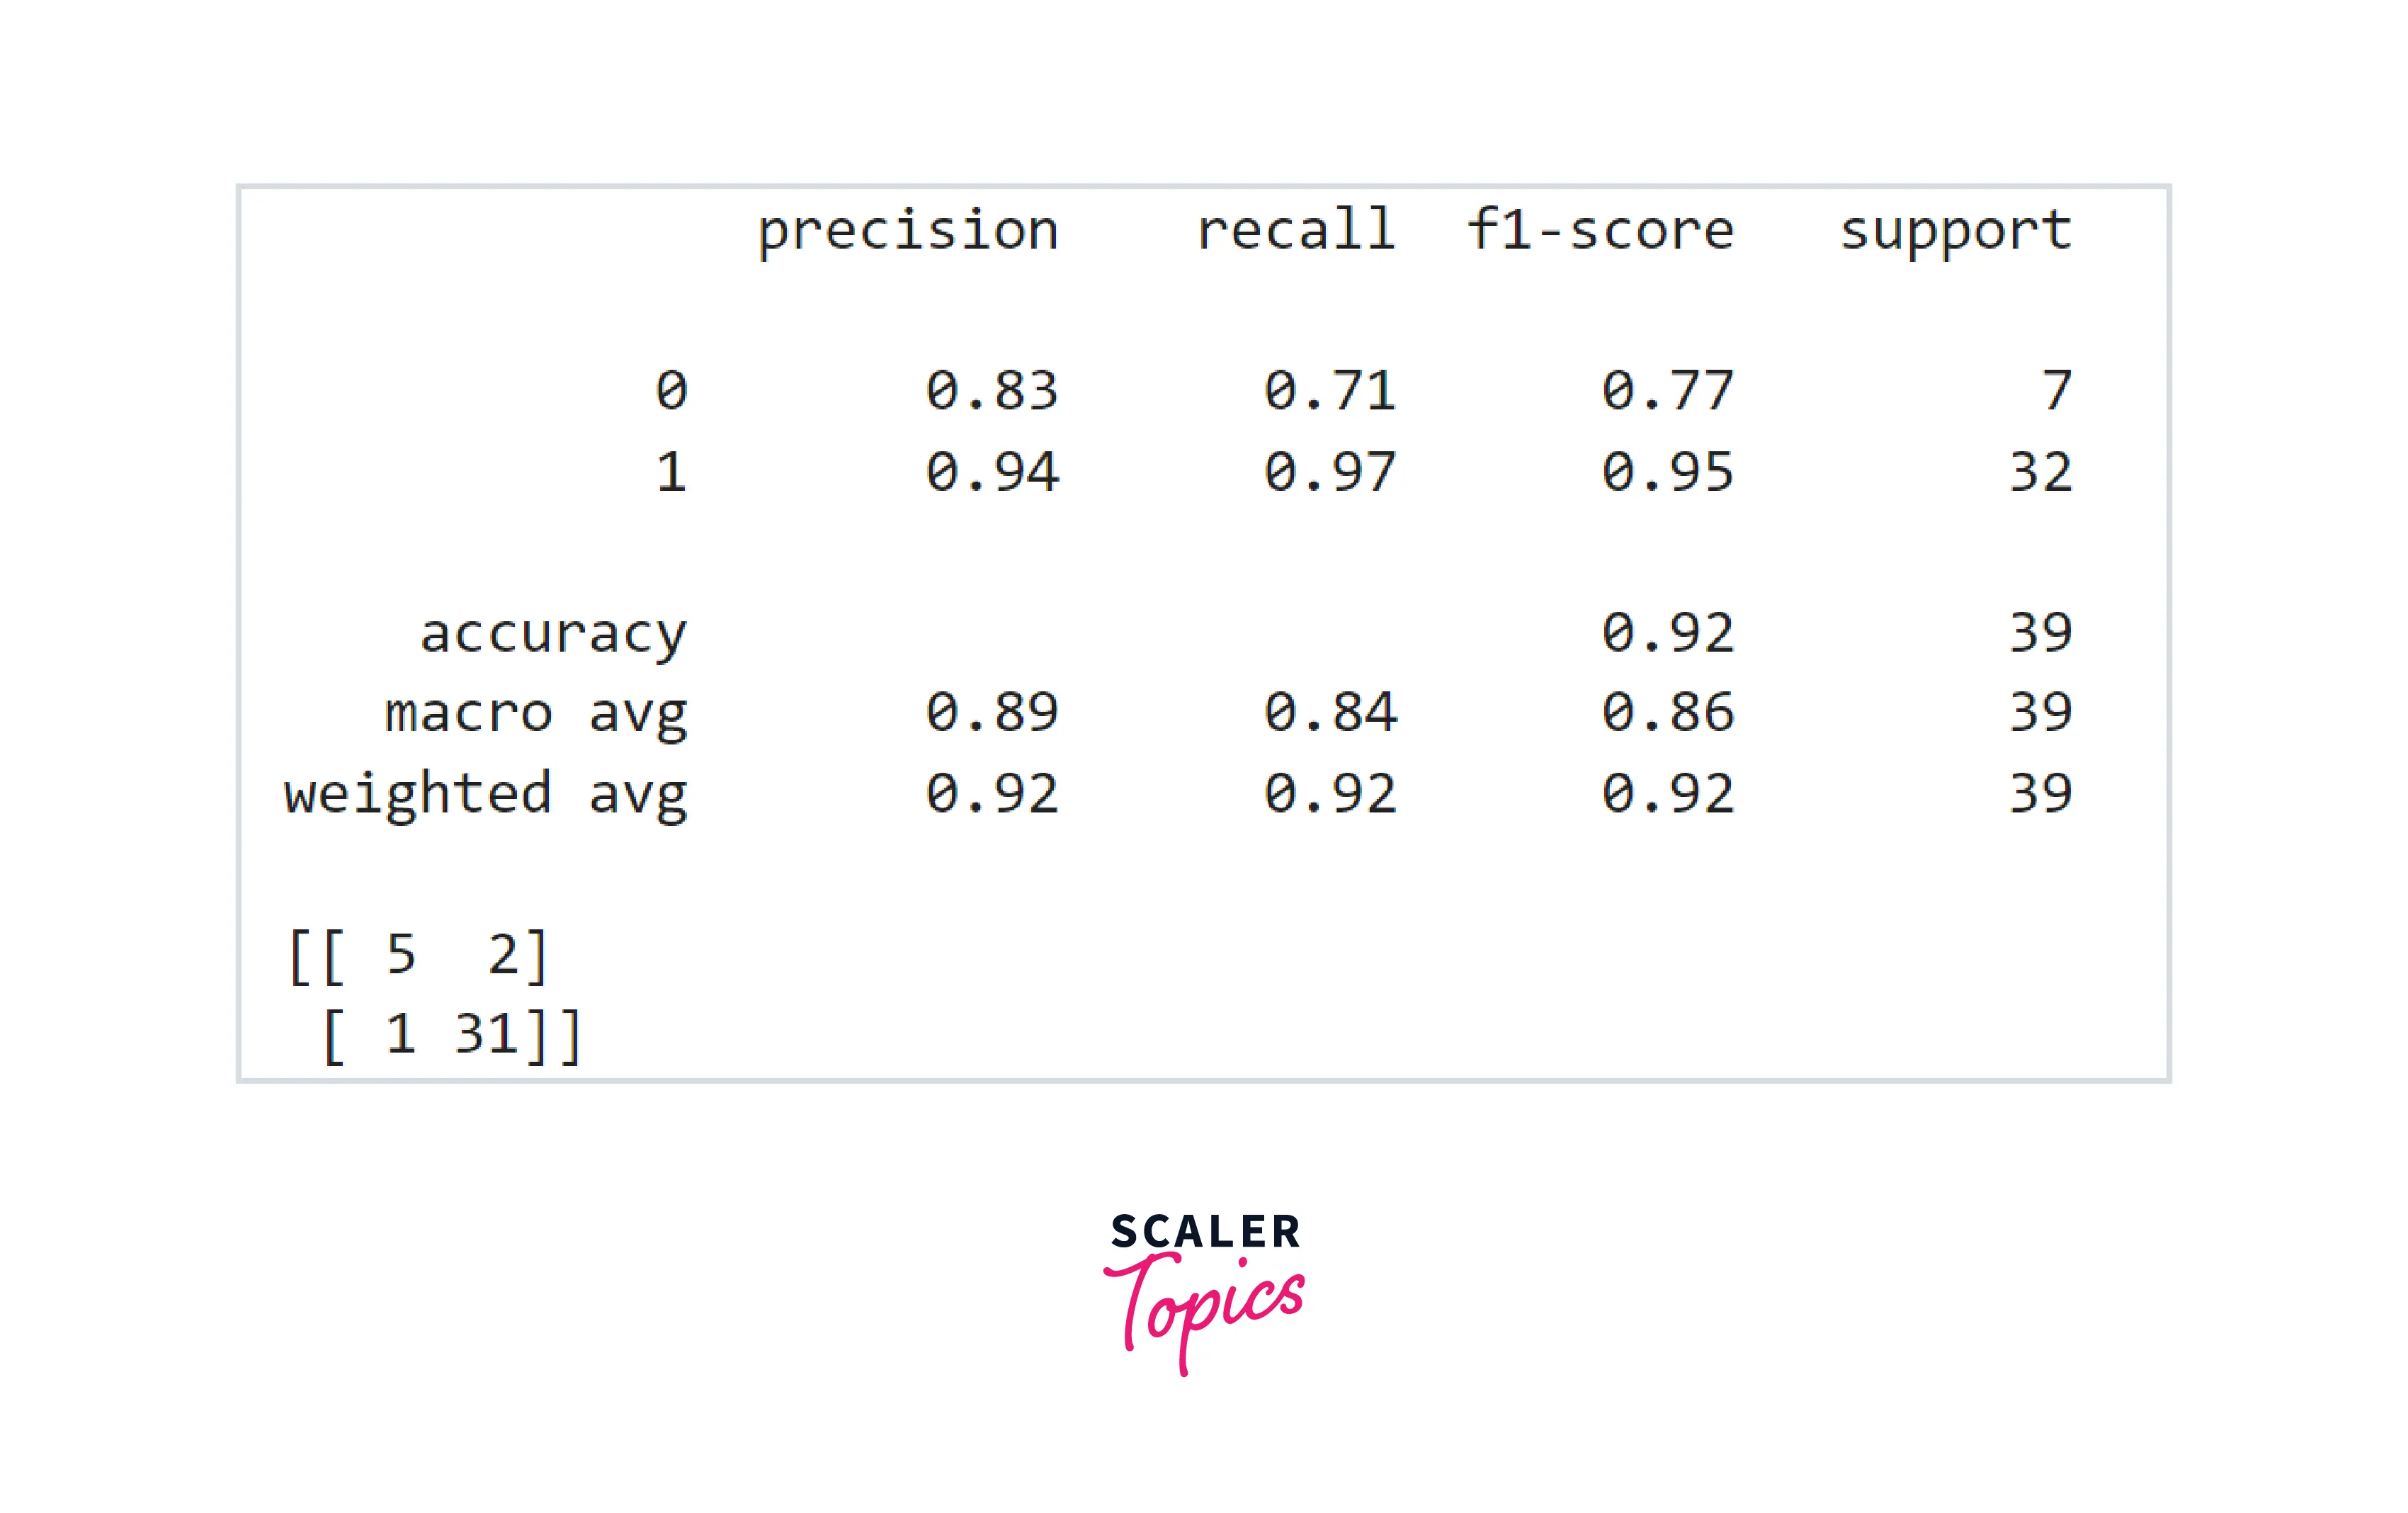
- With Random Forest, we got an accuracy of 92% and F1 score of 0.95. This is a huge improvement over a simple Decision Tree Classifier. Let's see if we get any improvement by using the XGBoost model or not.
- We did not get any improvement by using the XGBoost model. This way, we can conclude that the Random Forest model gives us the best accuracy and F1 score for this detector.
What’s Next
- You can explore whether outliers are present or not in the features. You can also explore the correlation between target variables and independent variables.
- You can perform a grid search-based hyperparameter tuning to come up with the best hyperparameter combination for a given model.
Conclusion
- We examined the UCI ML Parkinsons dataset by applying various statistical and visualization techniques.
- We trained and developed three ML models - Decision Tree, Random Forest, and XGBoost. We concluded that Random Forest works best and XGBoost does not give any further improvement in accuracy.