Handling Outliers in Data Science

Overview
Outliers are the observations in a dataset that deviate significantly from the rest of the data. In any data science project, it is essential to identify and handle outliers, as they can have a significant impact on many statistical methods, such as means, standard deviations, etc., and the performance of ML models. Outliers can sometimes indicate errors or anomalies in the data.
What are Outliers?
- In statistics, any observations or data points that deviate significantly and do not conform with the rest of the observation or data points in a dataset are called outliers. Outliers are extreme values in a feature or dataset. For example, if you have a dataset with a feature height. The majority of the values in this feature range between feet, but there is one value with 10 feet. This value would be considered an outlier, as it is not only an extreme value but an impossible height as well.
- Outliers are also called aberrations, abnormal points, anomalies, etc. It is essential to detect and handle outliers in a dataset as it can have a significant impact on many statistical methods, such as mean, variance, etc., and the performance of the ML models. It can lead to misleading, inconsistent, and inaccurate results if they are not properly accounted for.
Types of Outliers
Based on their characteristics, outliers or anomalies can be divided into three categories, as mentioned below:
Transform Your Career
Choose from our industry-leading programs designed for career success
Modern Software and AI Engineering Program
Master full-stack development with AI integration

Modern Data Science and ML with specialisation in AI
Advanced data science techniques with AI specialization
Advanced AIML with Specialisation in Agentic AI
Deep dive into AIML with focus on Agentic systems
DevOps, Cloud & AI Platform Engineering
Build and manage AI-powered cloud infrastructure
AI Engineering Advanced Certification by IIT-Roorkee
Premier AI engineering certification from IIT-Roorkee
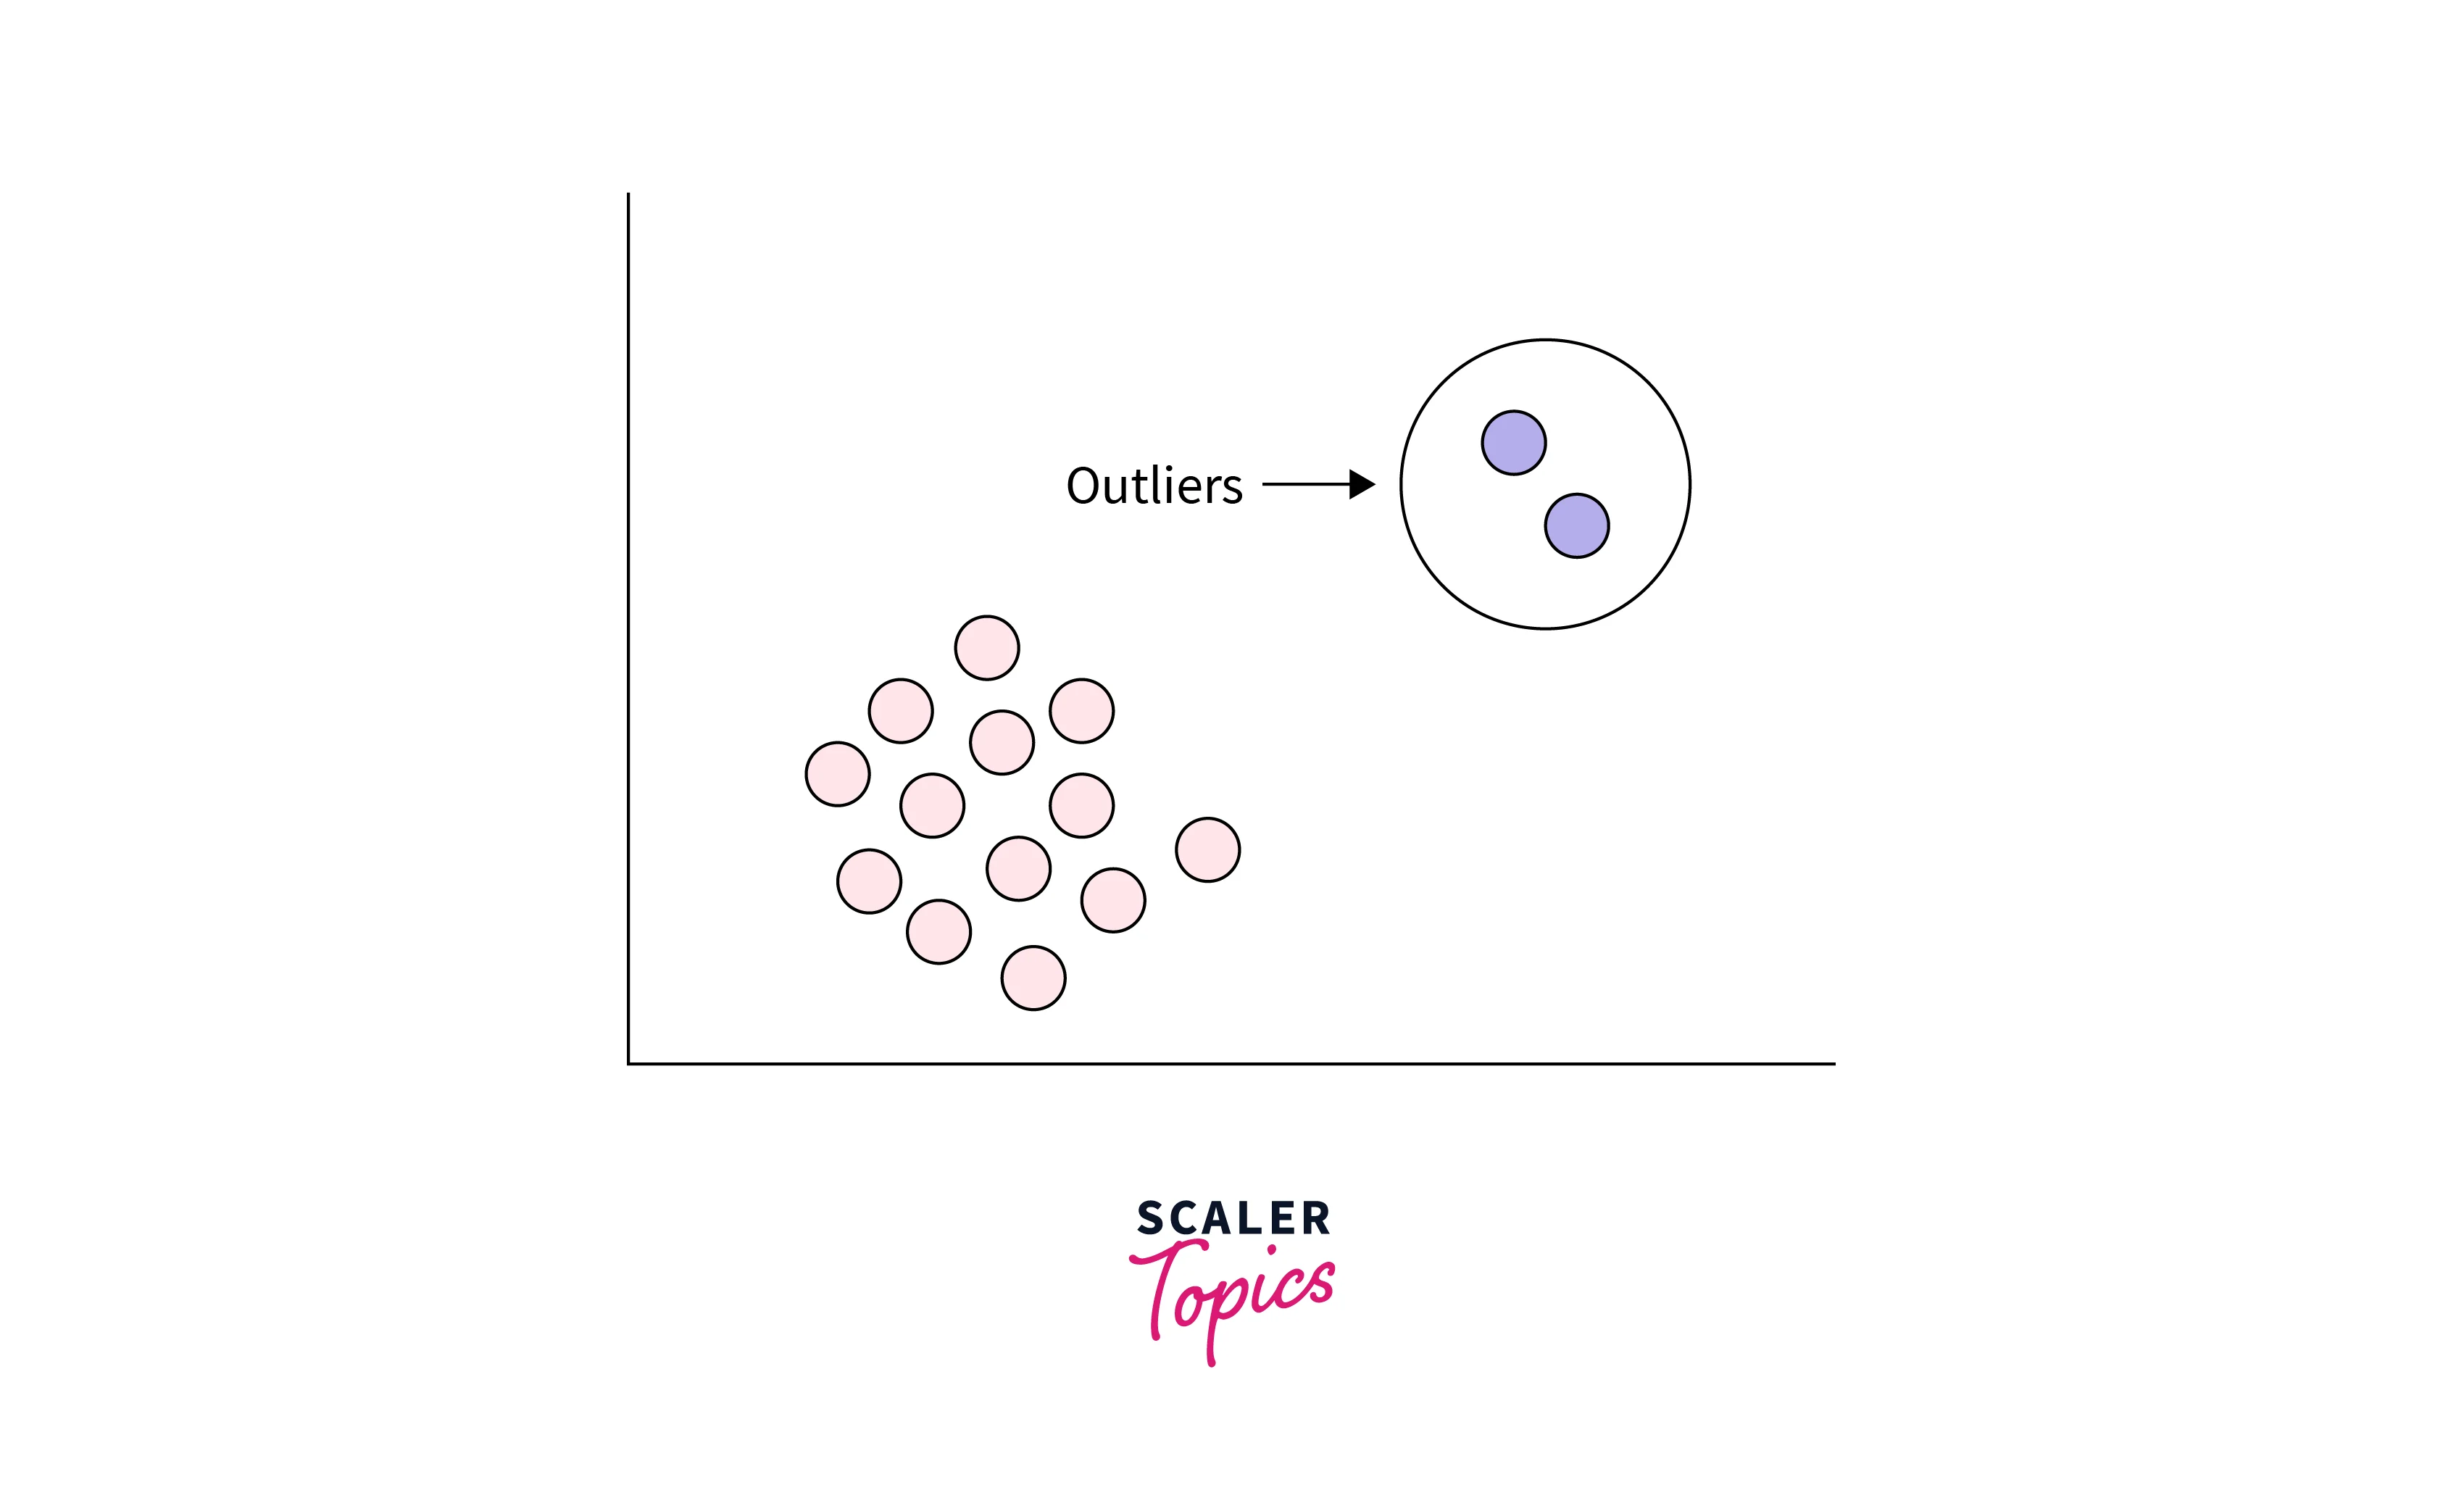
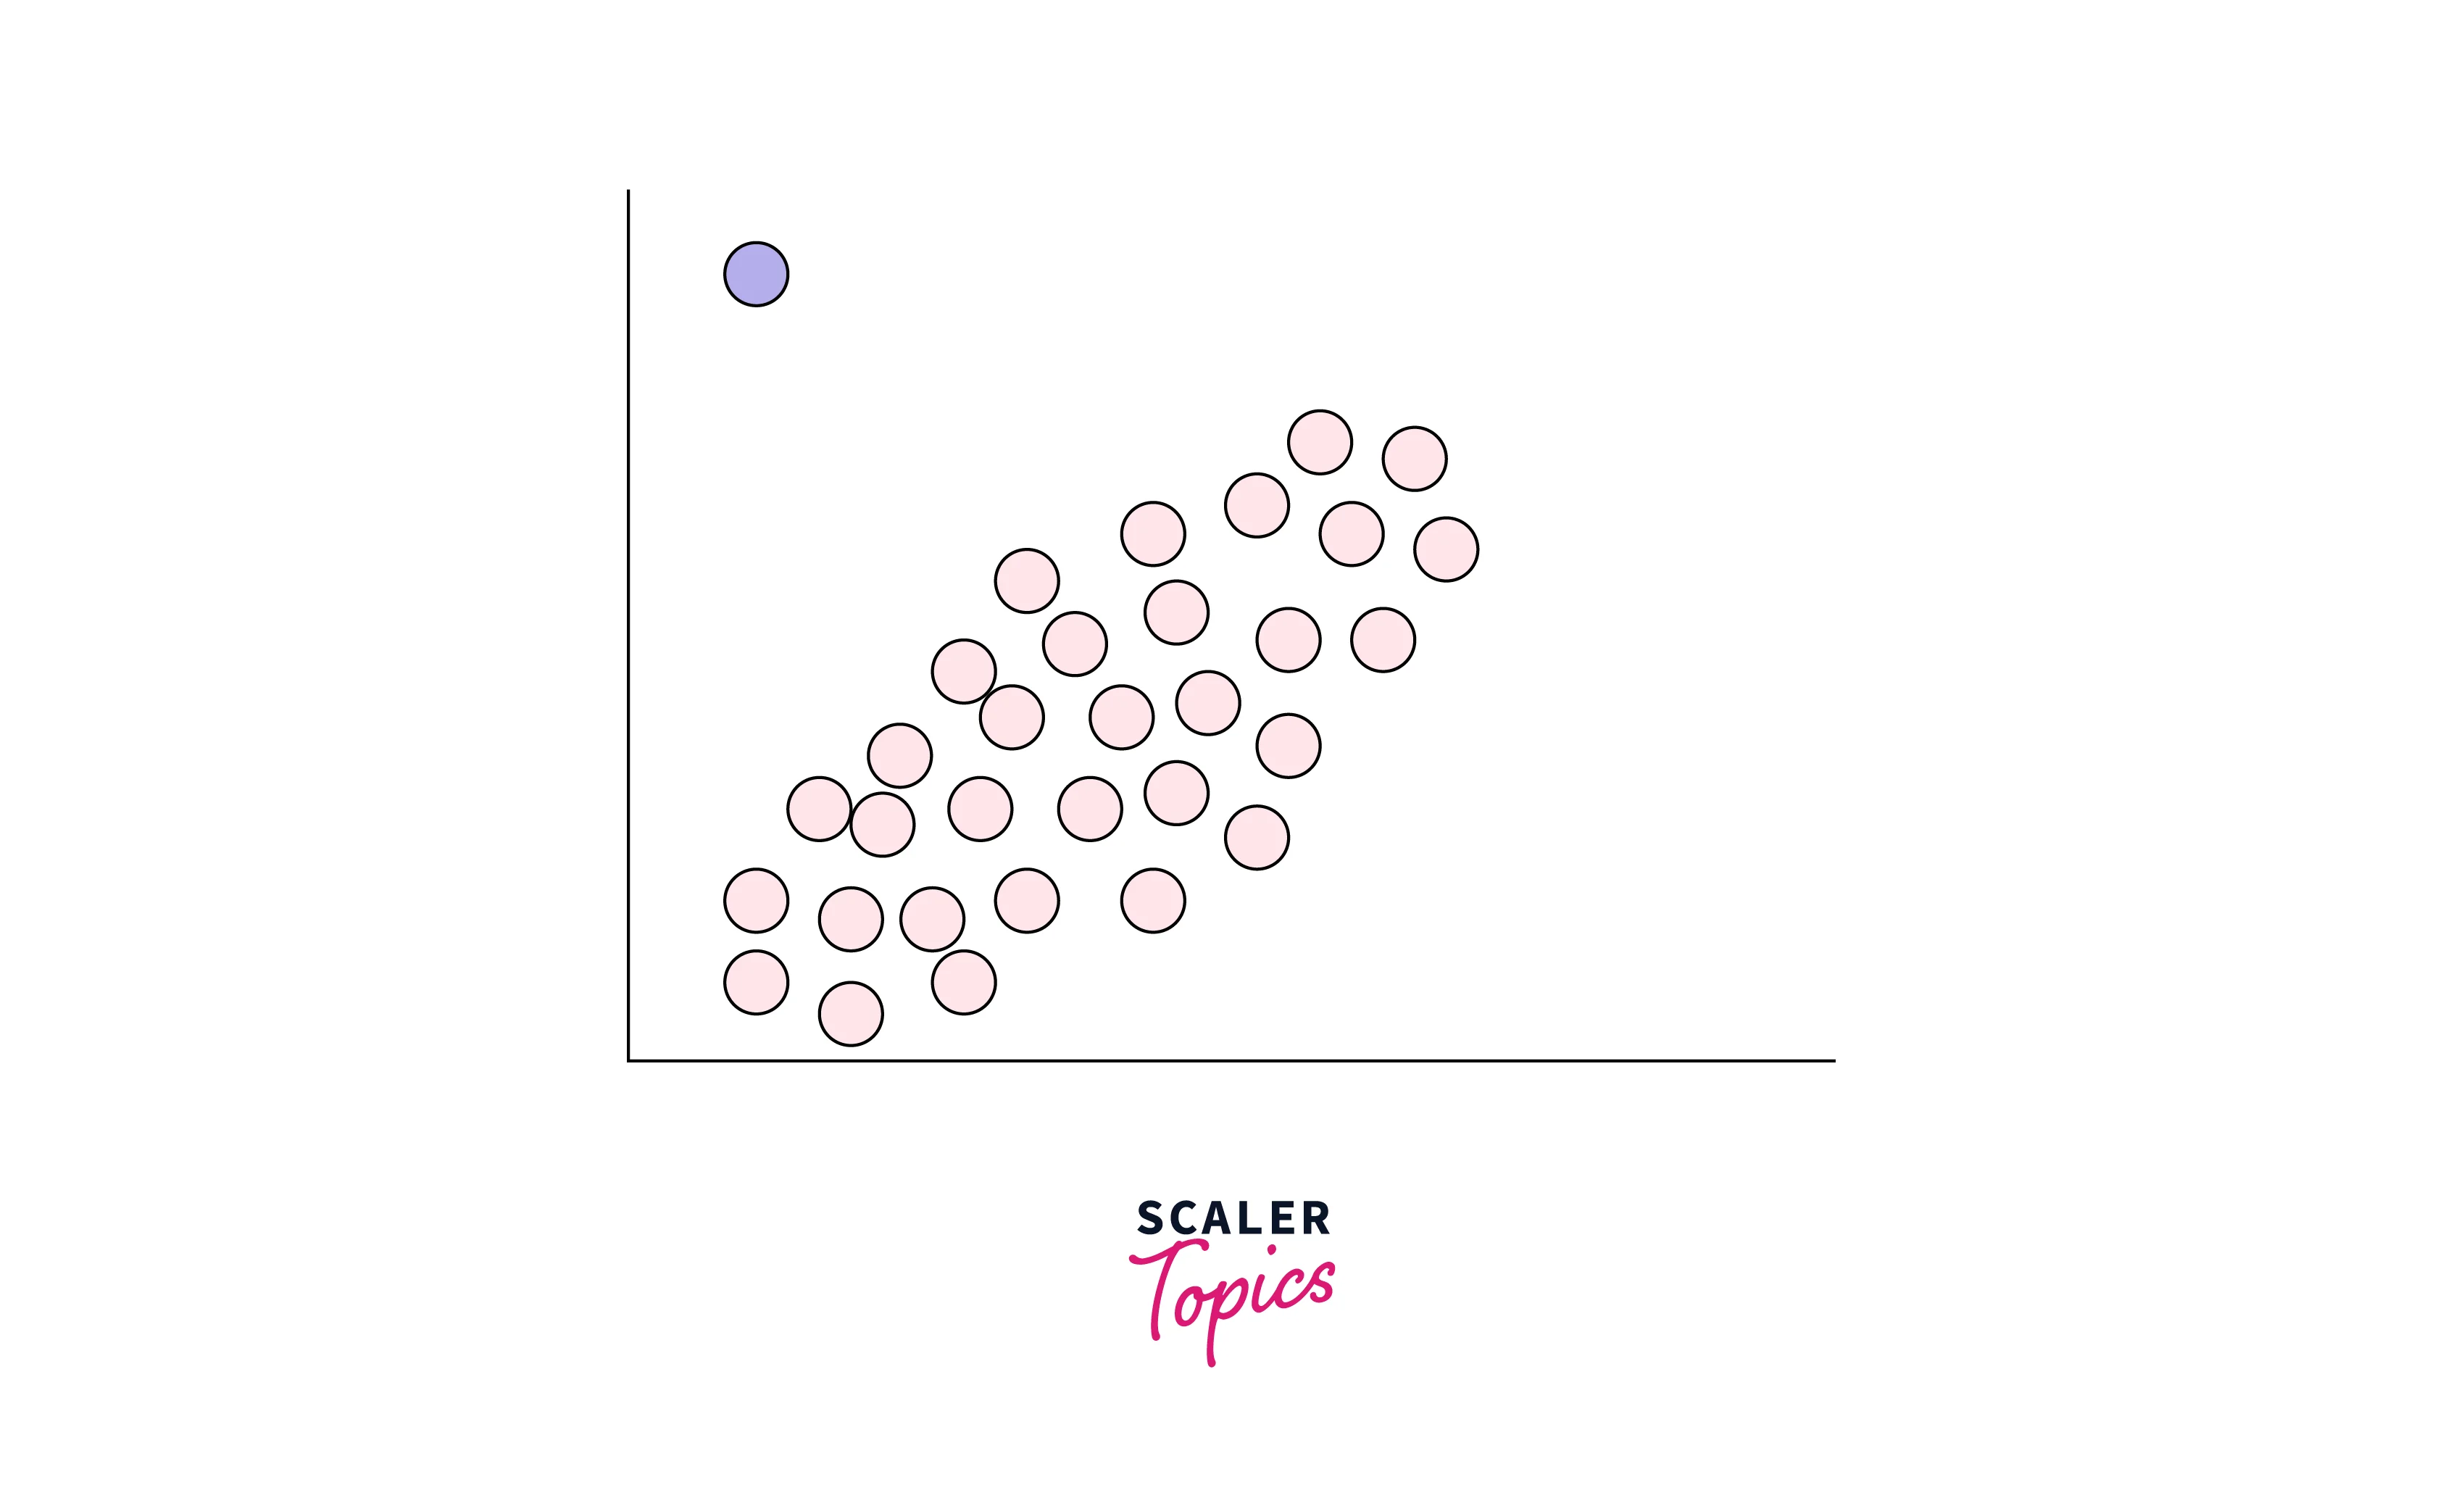
Global Outliers
It is also called point anomaly. Any observations or data points are considered as global outliers if they deviate significantly from the rest of the observations or data points in a dataset. For example, if you are collecting observations of temperatures in a city, then a value of 100 degrees would be considered an outlier, as it is an extreme as well as impossible temperature value for a city.
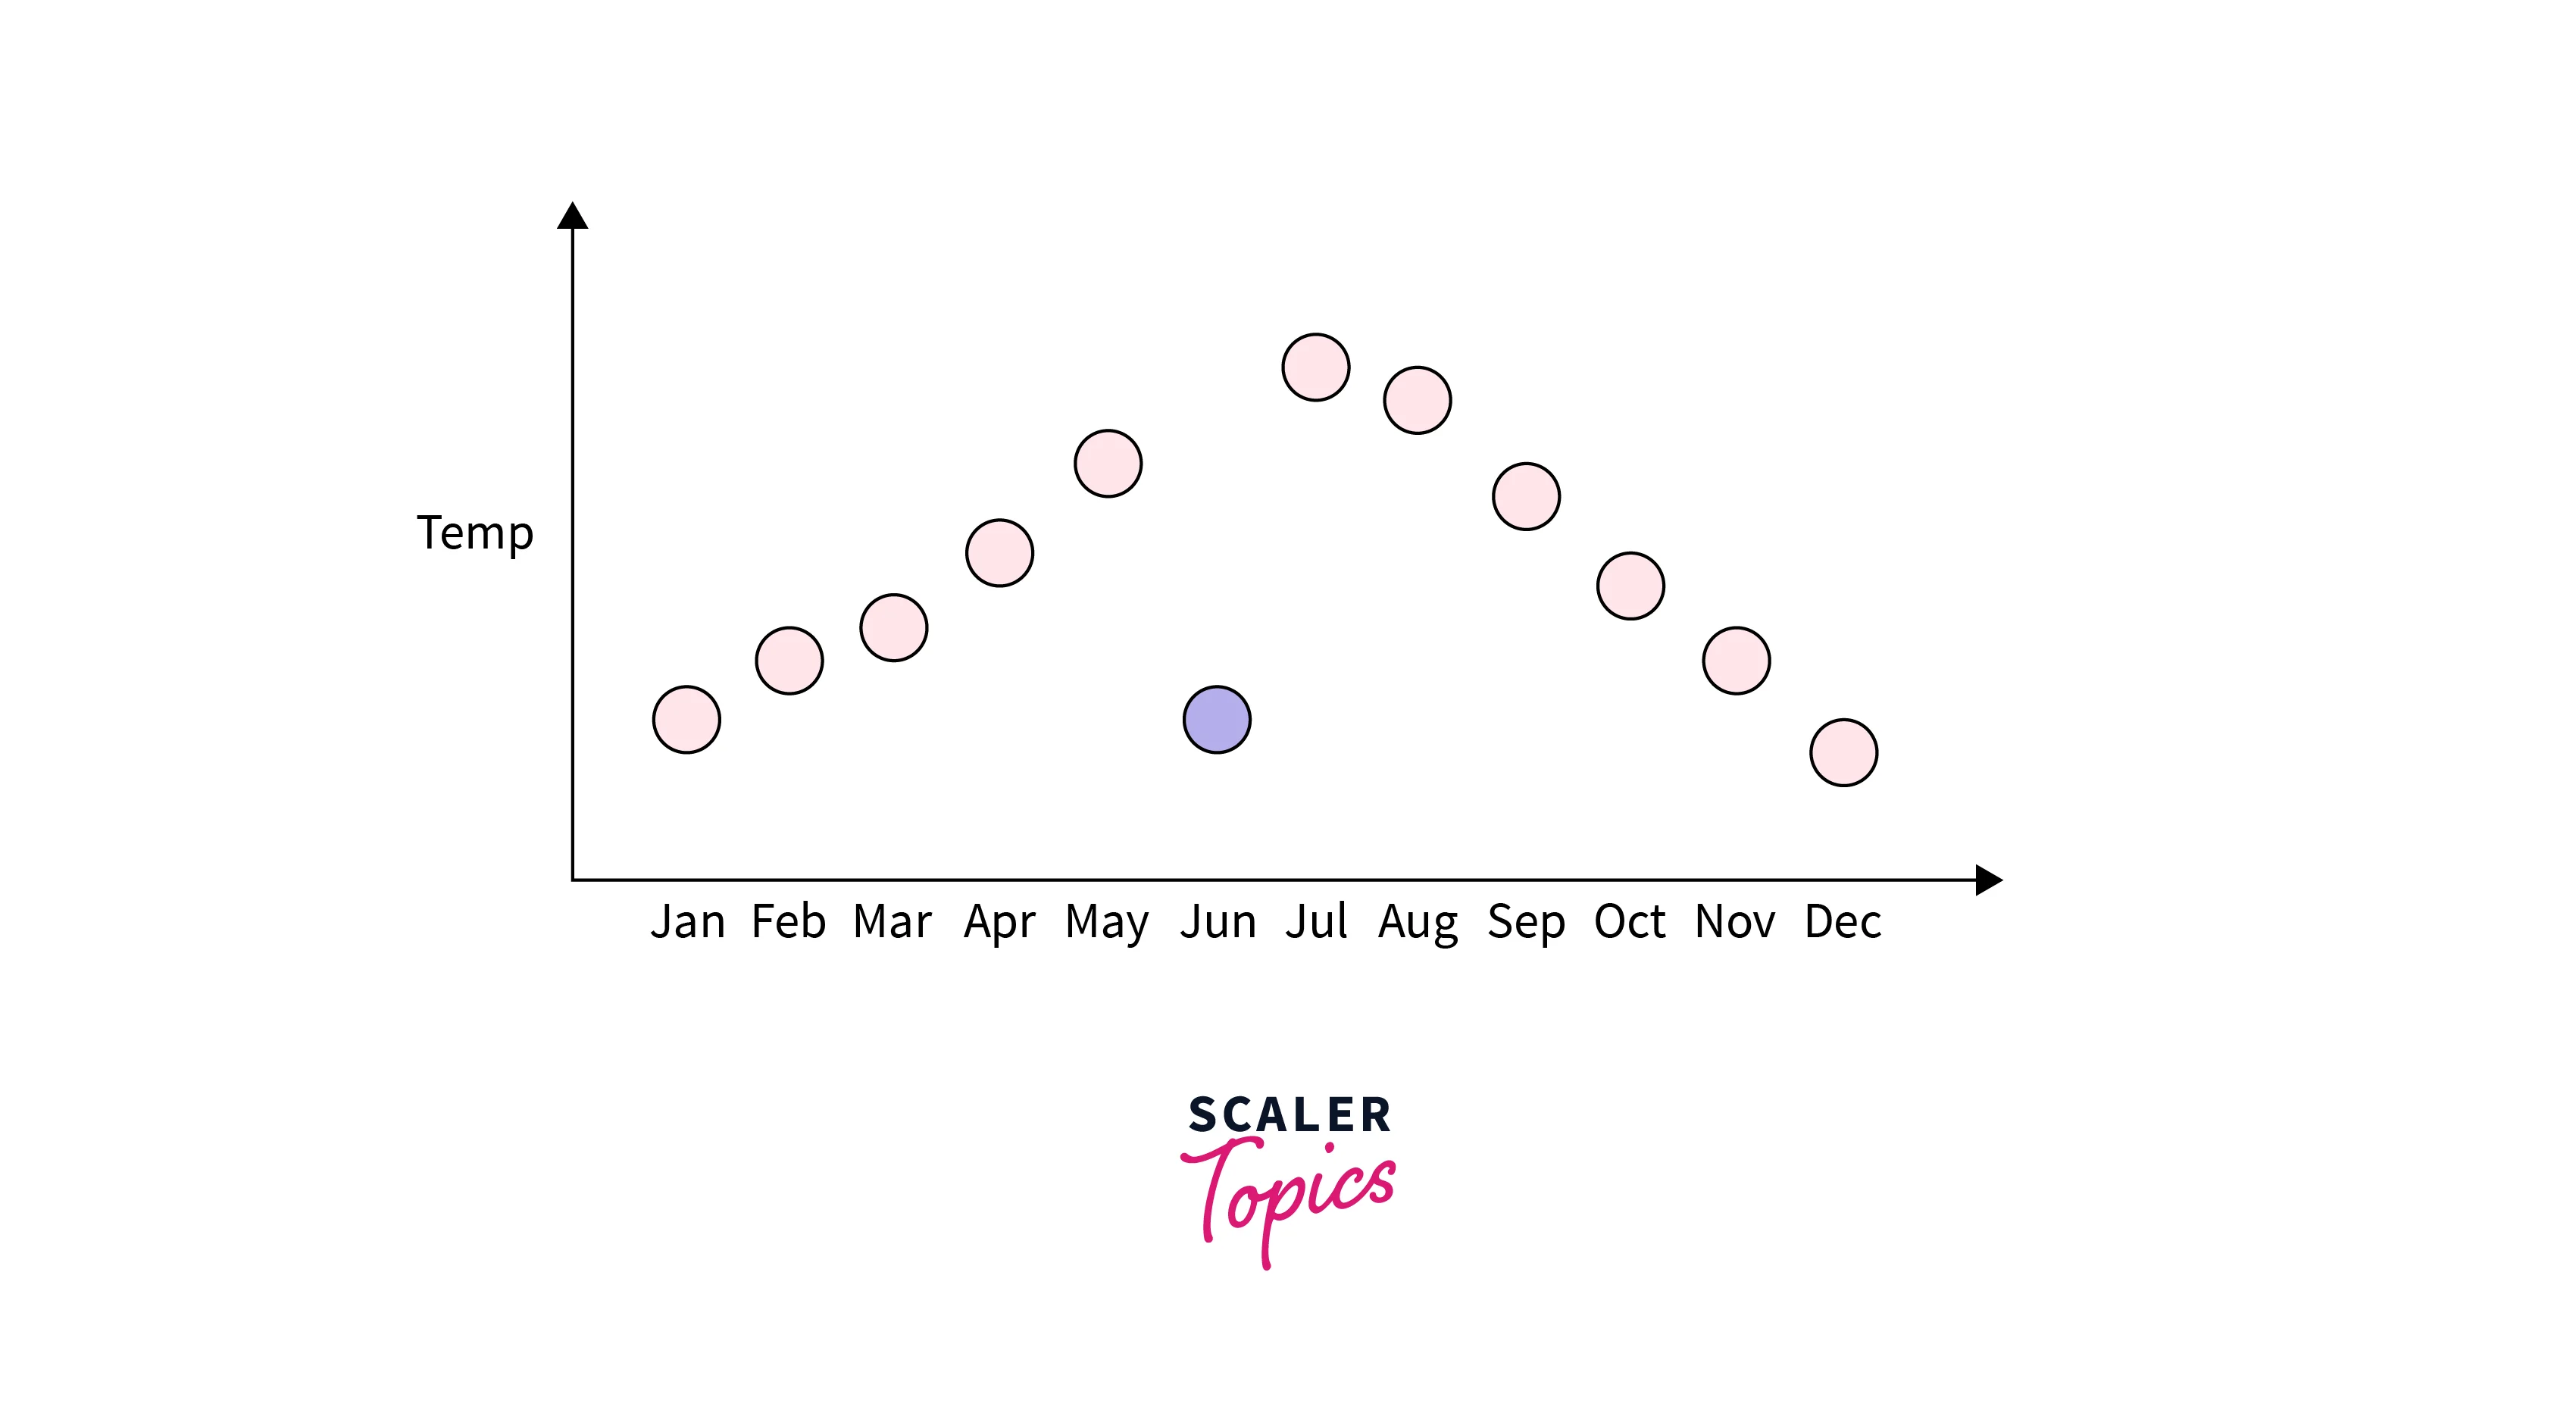
Contextual Outliers
Any data points or observations are considered as contextual outliers if their value significantly deviates from the rest of the data points in a particular context. It means that the same values may not be considered an outlier in a different context. For example, if you have observations of temperatures in a city, then a value of 40 degrees would be considered an outlier in winter, but the same value might be part of the normal observations in summer.
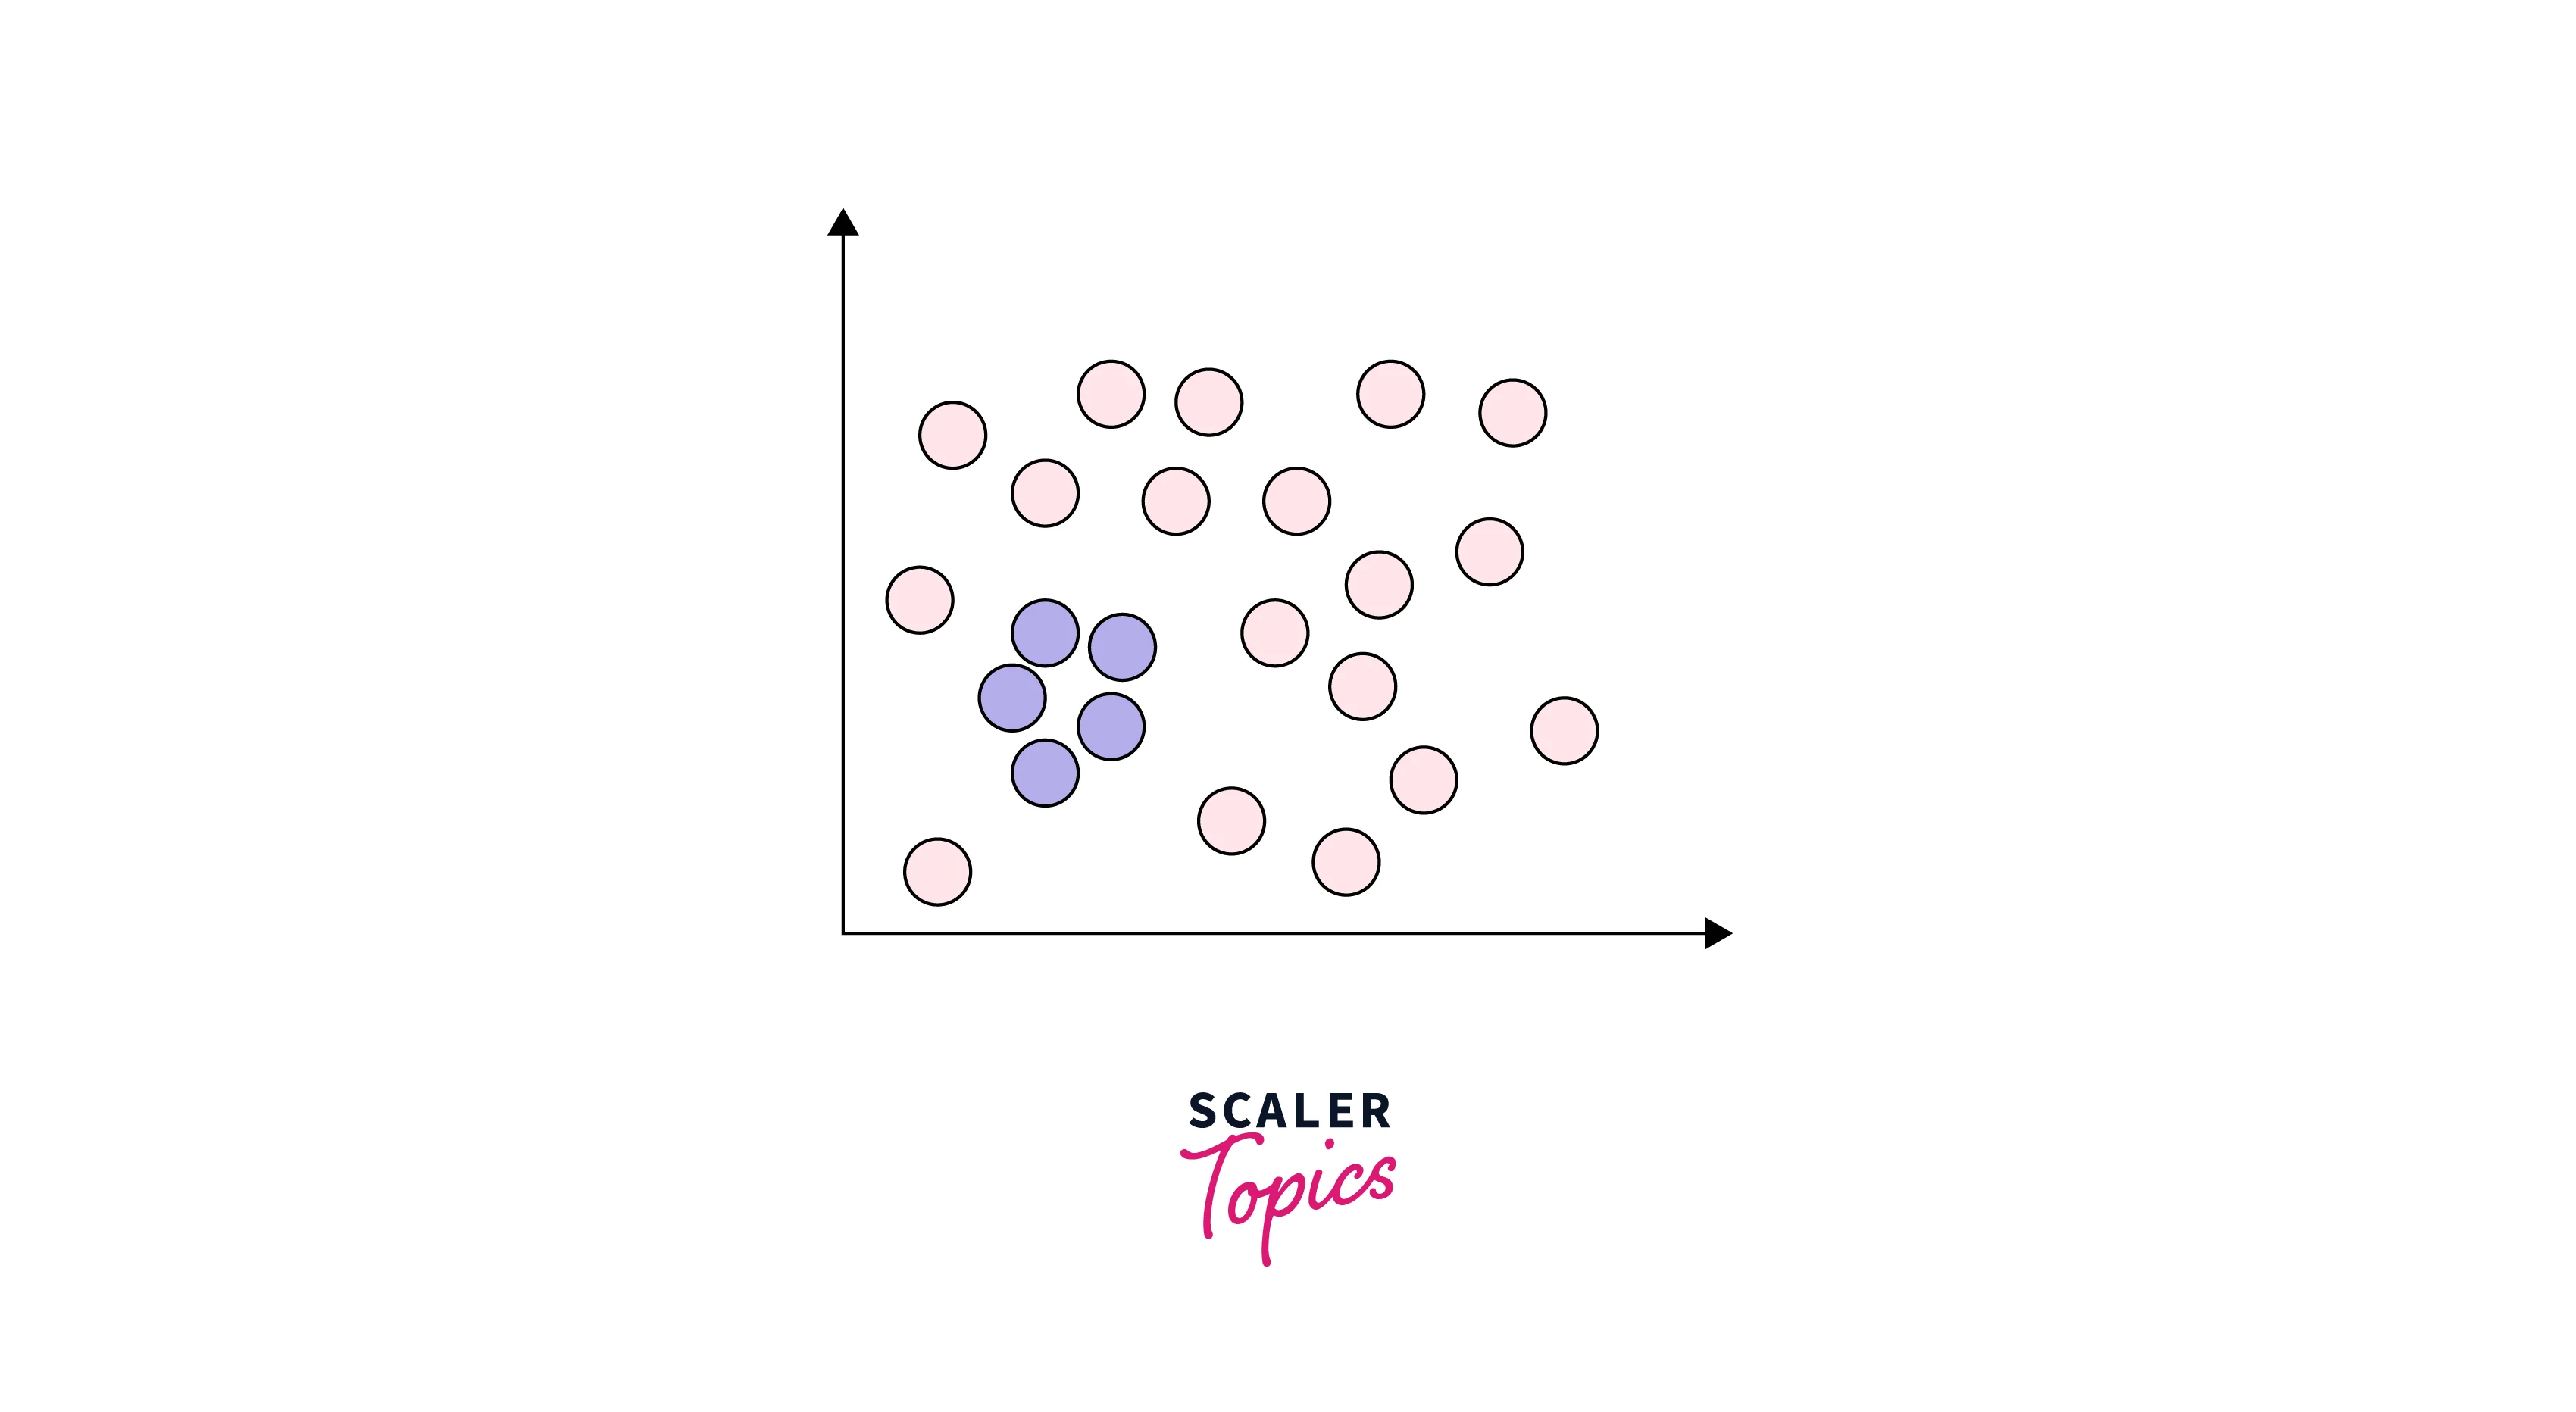
Collective Outliers
Any group of observations or data points within a data set is considered collective outliers if these observations as a collection deviate significantly from the entire data set. It means that these values, individually without collection with other data points, are not considered as either contextual or global outliers.
For example, in an Intrusion Detection System, a DOS (denial-of-service) package from one computer to another may be considered normal behavior. However, if several computers are receiving DOS packages at the same time, then this may be considered anomalous behavior, and as a collection of data points, they can be considered collective outliers.
Curious to See These Concepts in Action? Our Data Science Course Provides Practical Insights. Enroll and Transform Your Knowledge into Proficiency!
Turn Learning into Career Growth
Identifying Outliers
Let’s explore a few of the most common ways to identify and detect outliers in a dataset.
Percentile Method
- The percentile method identifies outliers in a dataset by comparing each observation to the rest of the data using percentiles.
- In this method, We first define the upper and lower bounds of a dataset using the desired percentiles. For example, we may use the 5th and 95th percentile for a dataset's lower and upper bounds, respectively. Any observations or data points that reside beyond and outside of these bounds can be considered outliers.
- This method is simple and useful for identifying outliers in symmetrical and normal distributions.
Interquartile Range (IQR) Method
-
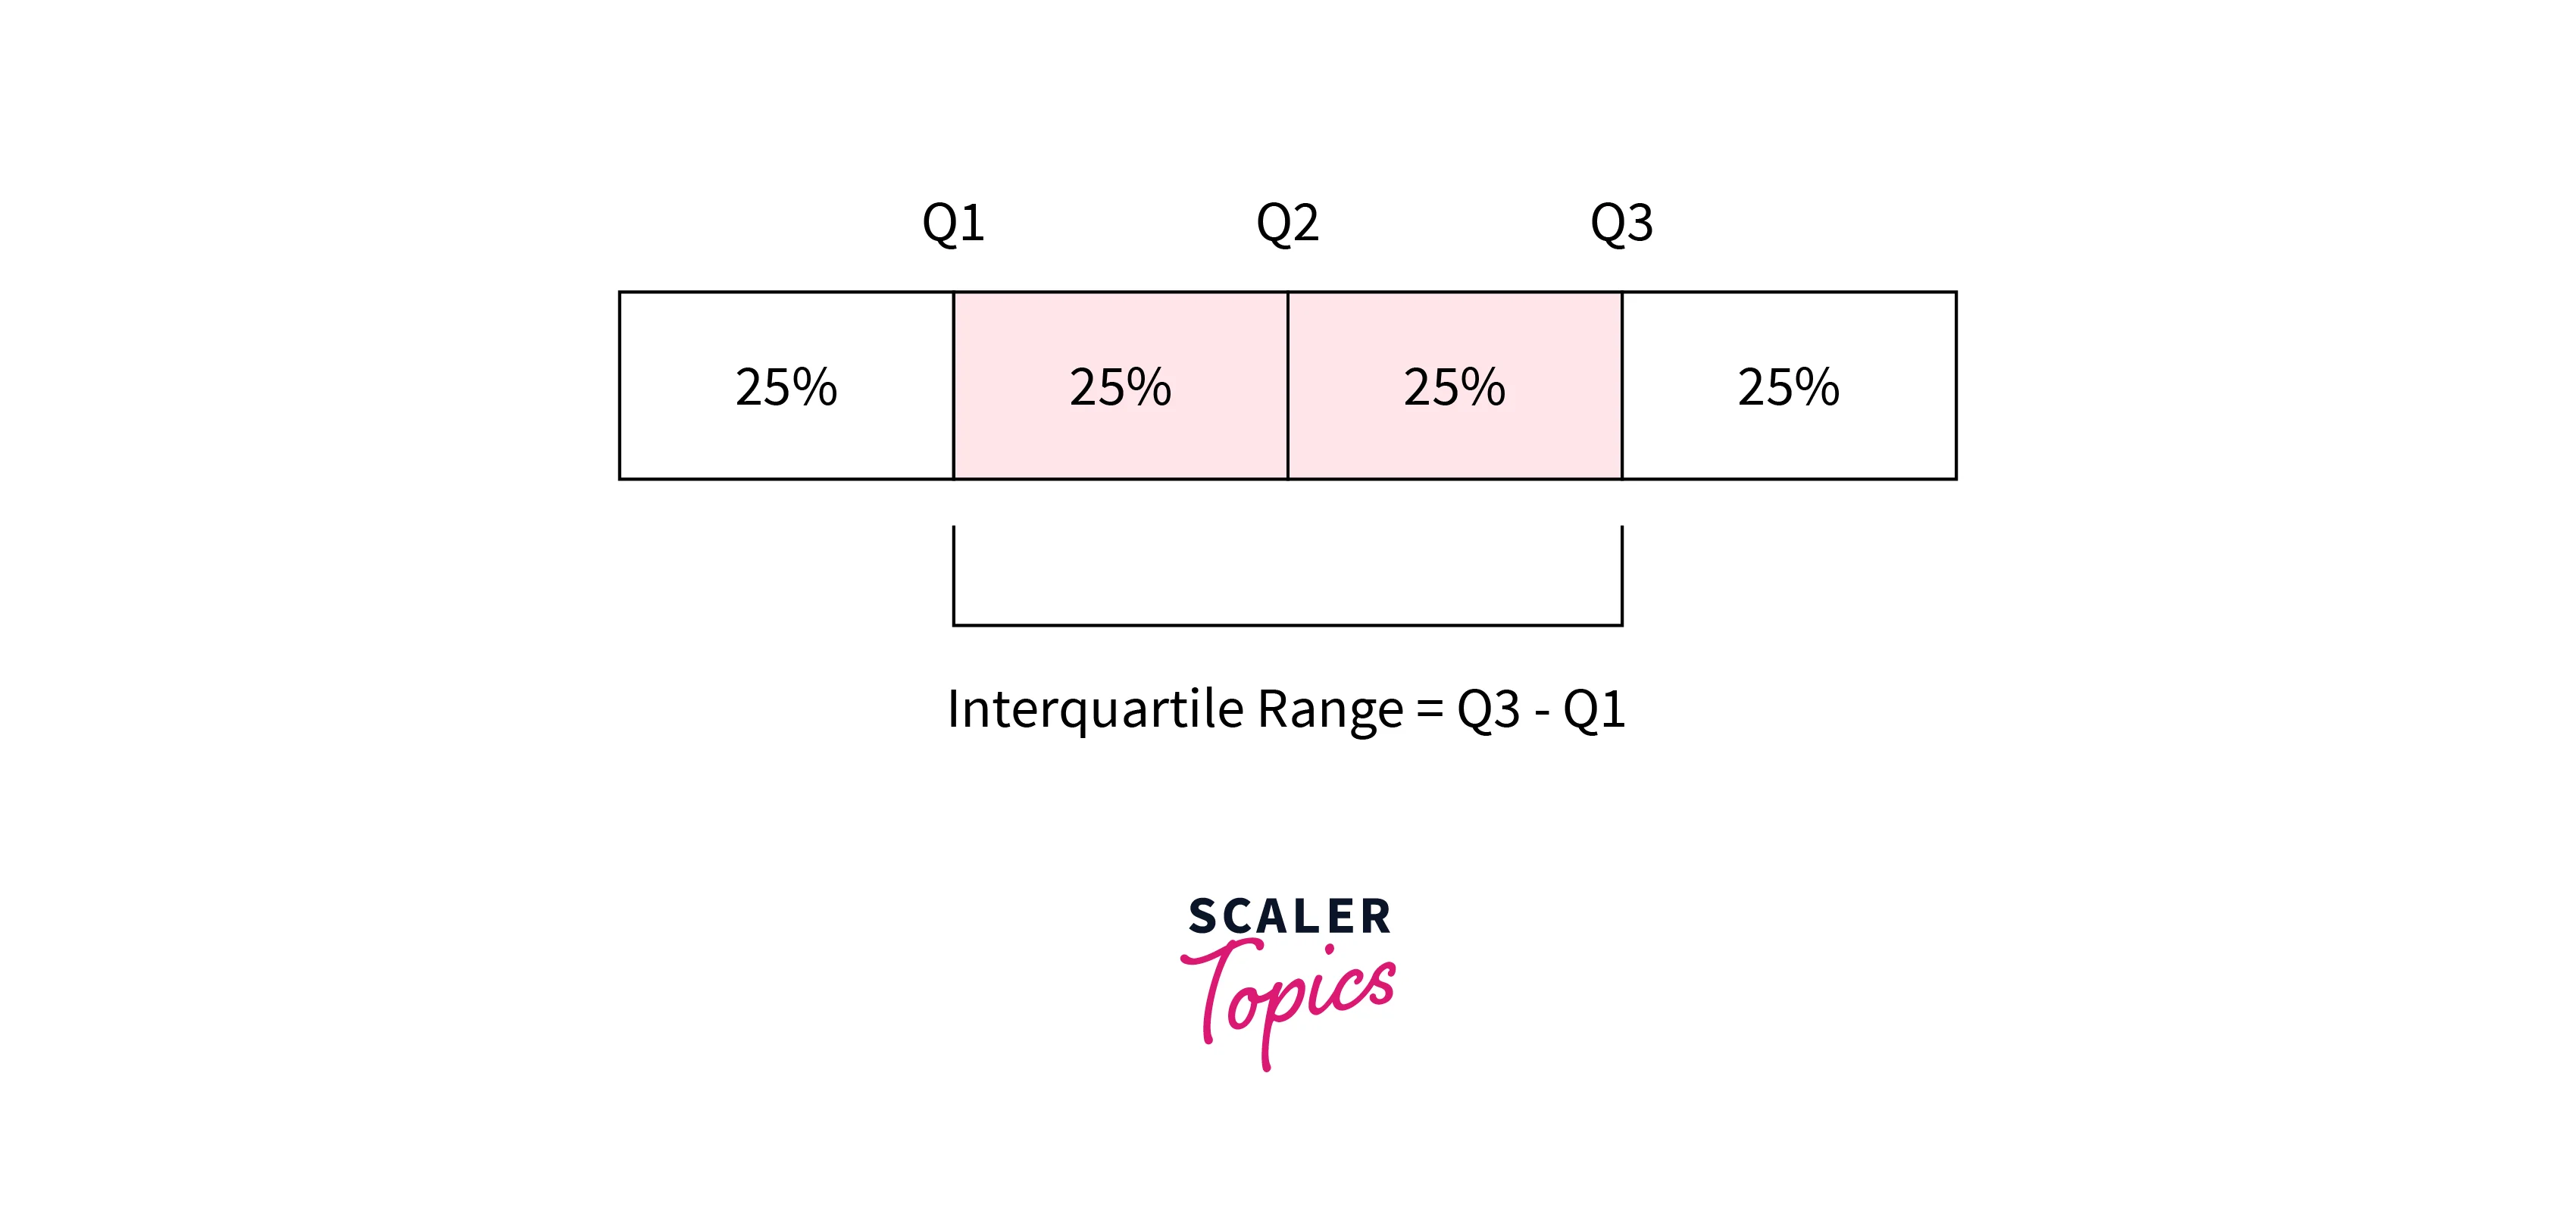
The interquartile range (IQR) is a measure of the dispersion of a dataset. It is calculated by taking the difference between the upper and lower quartiles of the dataset. Quartiles are values that divide a dataset into four equal parts or quarters. The upper quartile (Q3) is the value greater than or equal to 75% of the other values in the dataset, and the lower quartile (Q1) is the value greater than or equal to 25% of the other values. The IQR is calculated by subtracting Q1 from Q3.
-
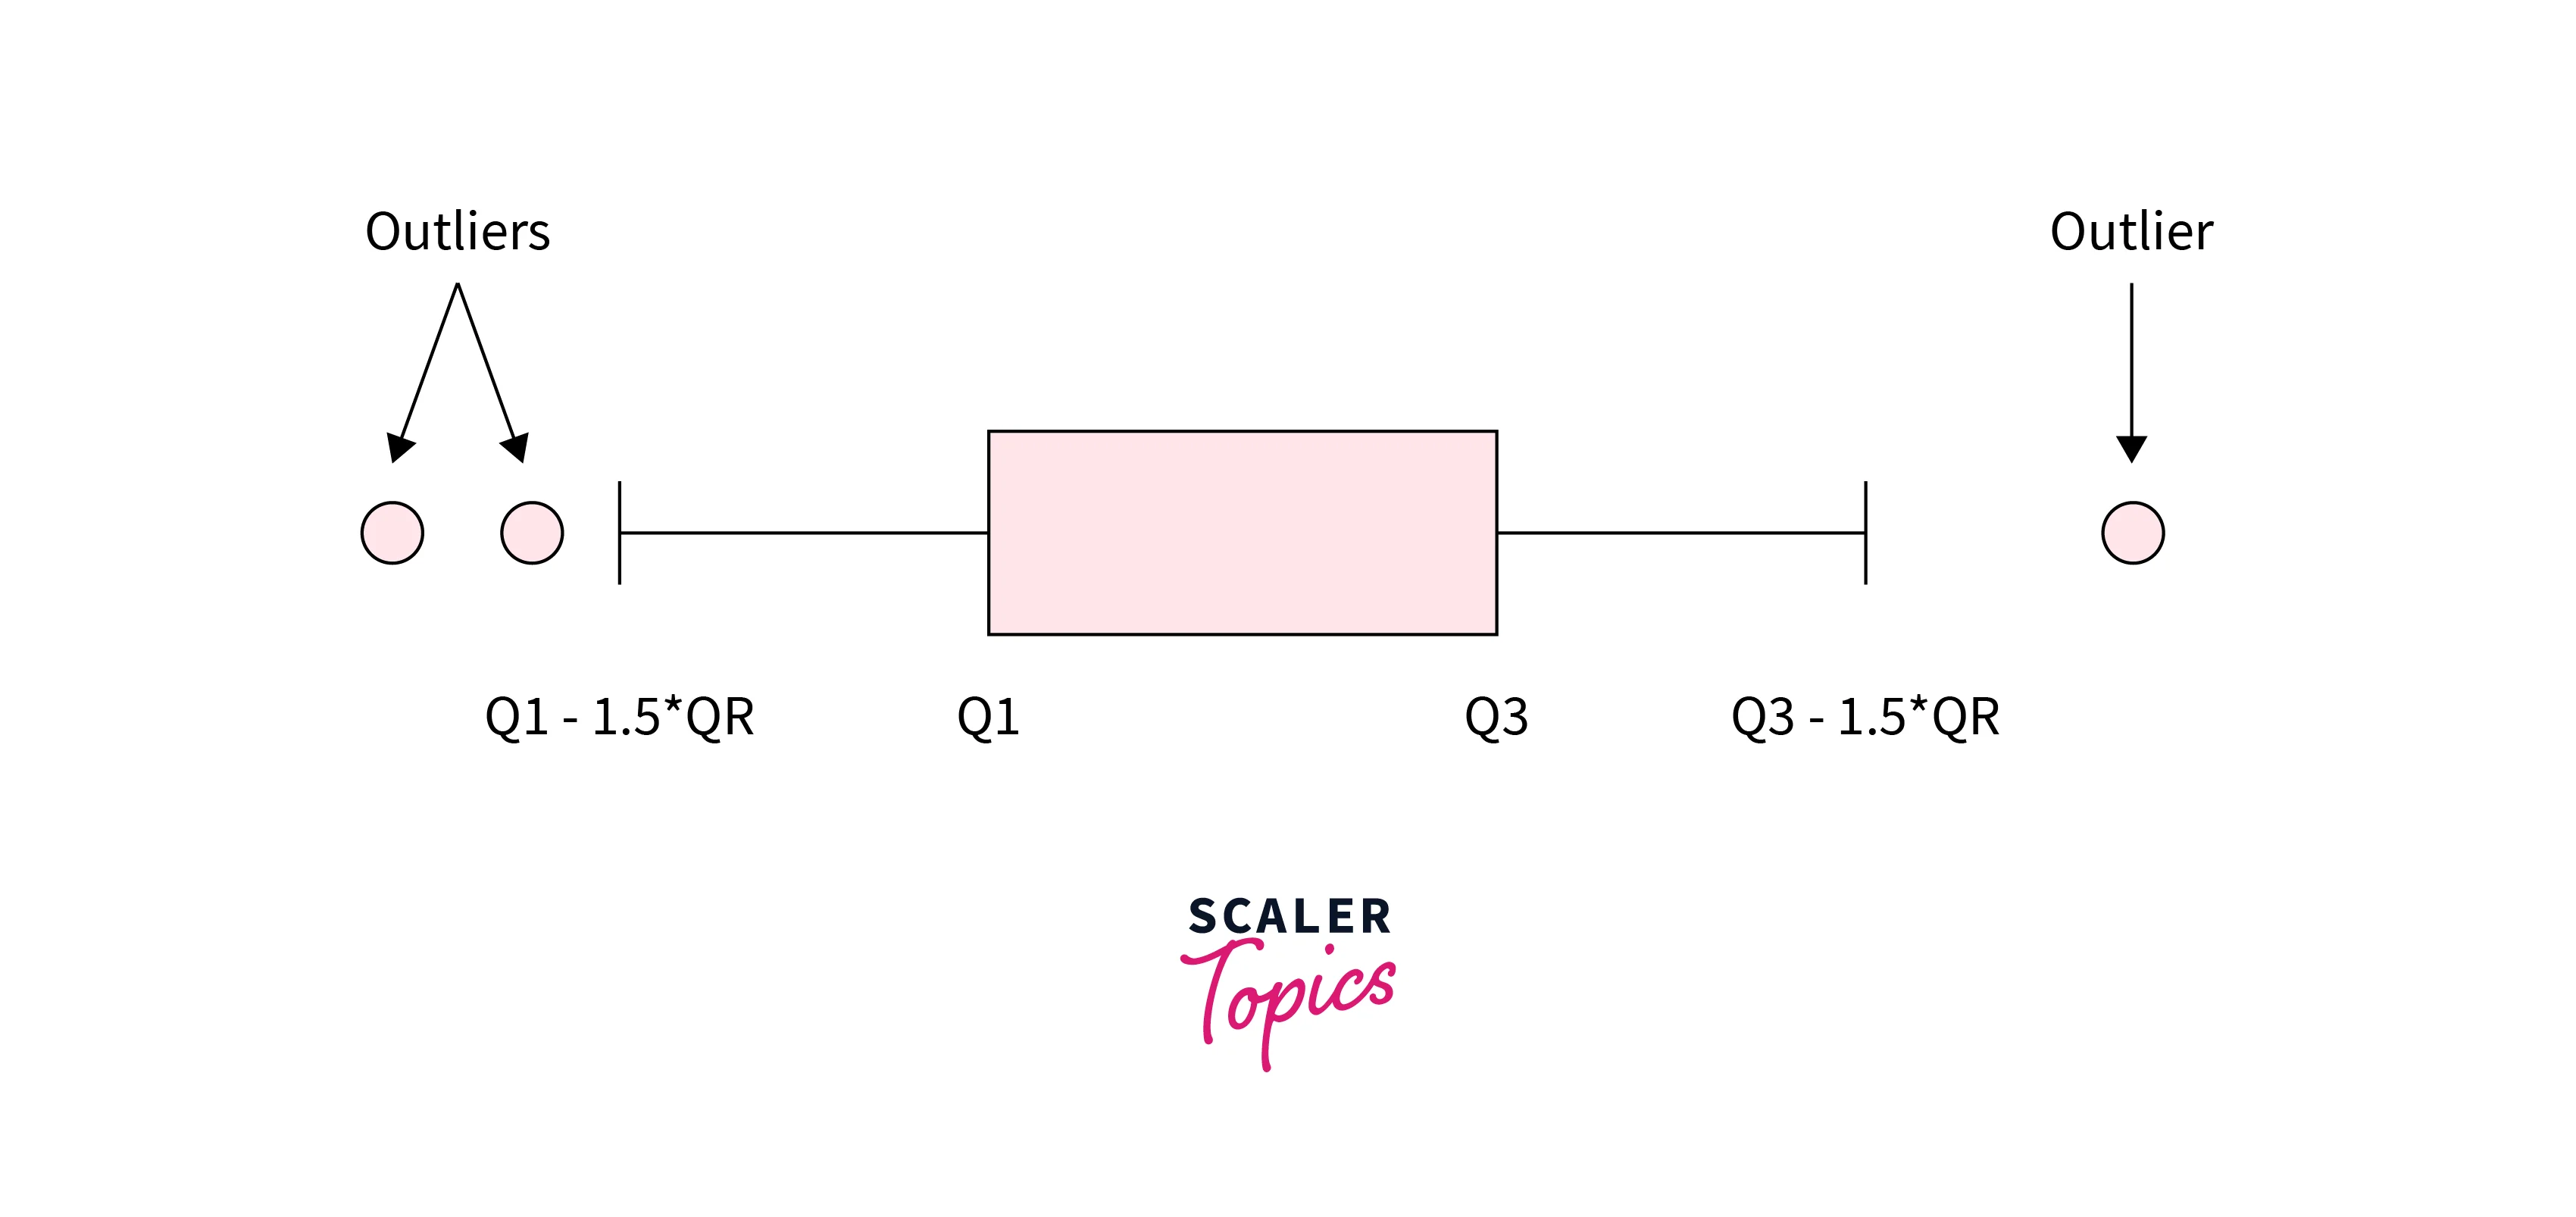
Using IQR, we can define a dataset's upper and lower bounds. The upper bound is defined as Q3 + 1.5*IQR, and the lower bound is defined as Q1 - 1.5*IQR. Any observations or data points that reside beyond and outside these bounds can be considered outliers.
Scaler Placement Report and Statistics
Scaler learners achieved 2.5x salary growth with average post-Scaler CTC reaching ₹23L.
Z-Score Method
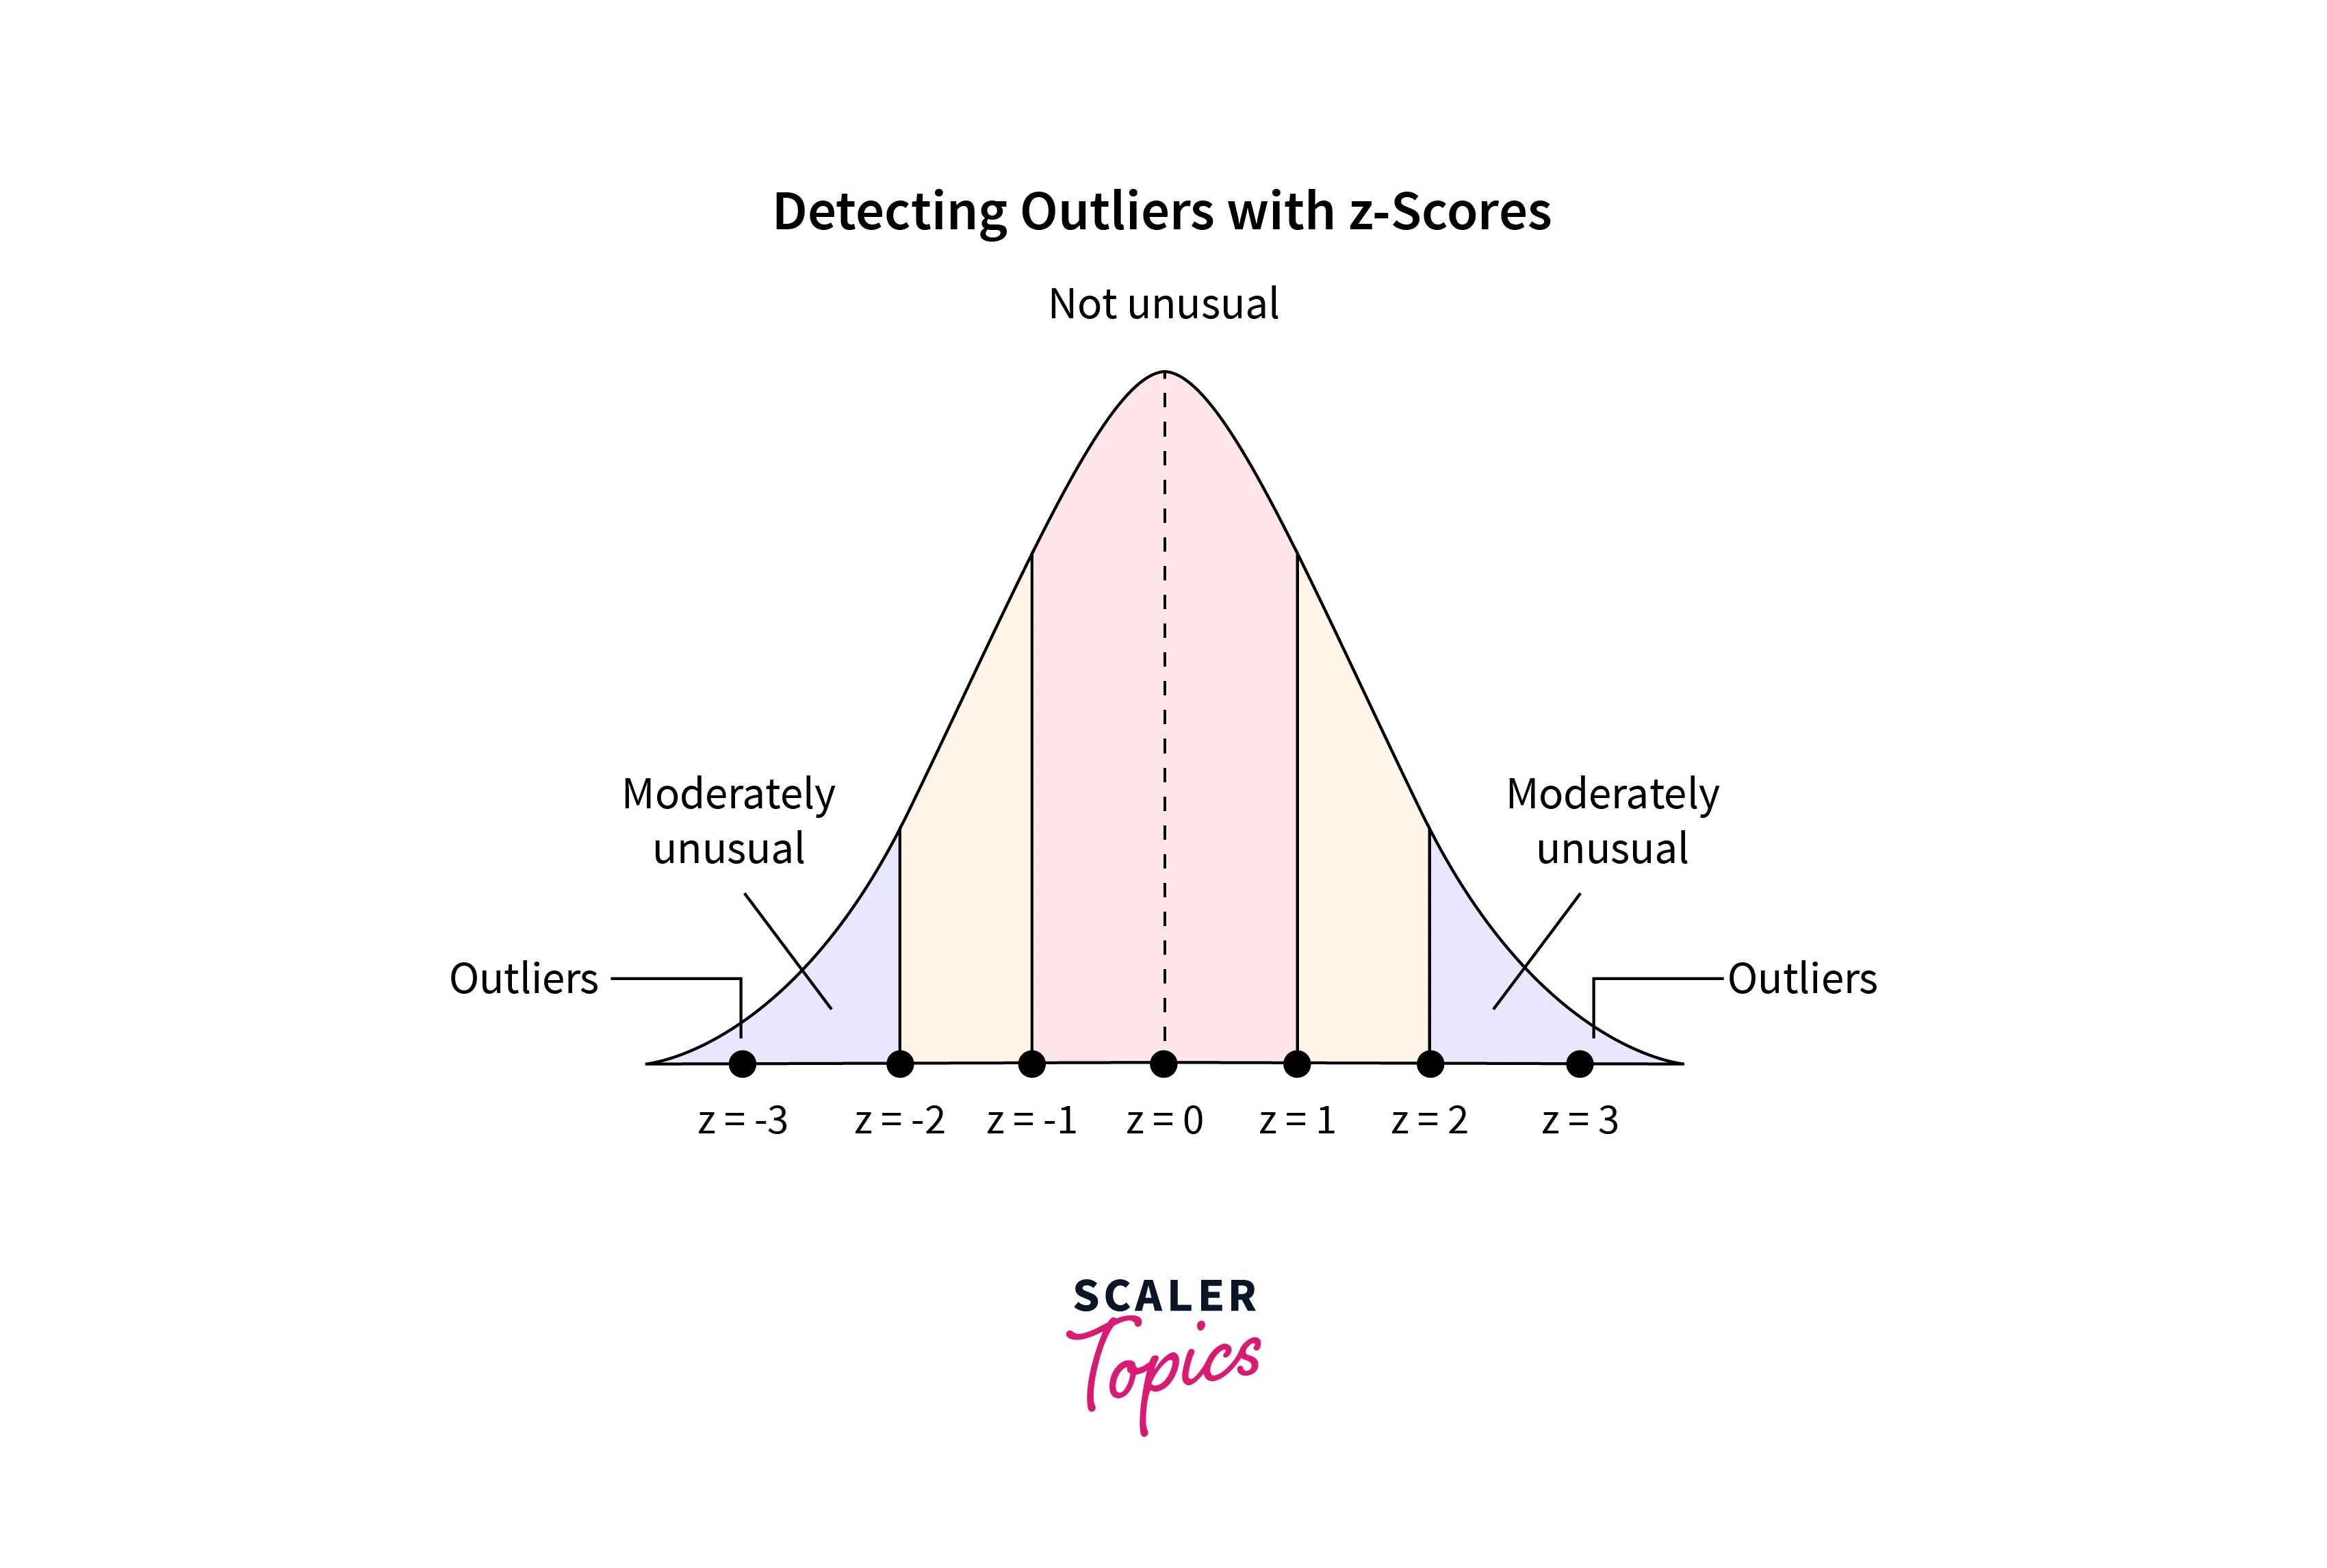
- For a given value, the respective z-score represents its distance in terms of the standard deviation. For example, a z-score of 2 represents that the data point is 2 standard deviations away from the mean. To detect the outliers using the z-score, we can define the lower and upper bounds of the dataset. The upper bound is defined as z = 3, and the lower bound is defined as z = -3. This means any value more than 3 standard deviations away from the mean will be considered an outlier.
Let’s see below how you can implement these methods to detect outliers using Python.
How Should the Outliers Be Handled?
Depending on the specific characteristics of the data, there are several ways to handle outliers in a dataset. Let’s review a few of the most common approaches to handle outliers below:
- Remove outliers:
In some cases, it may be appropriate to simply remove the observations that contain outliers. This can be particularly useful if you have a large number of observations and the outliers are not true representatives of the underlying population. - Transform outliers:
The impact of outliers can be reduced or eliminated by transforming the feature. For example, a log transformation of a feature can reduce the skewness in the data, reducing the impact of outliers. - Impute outliers:
In this case, outliers are simply considered as missing values. You can employ various imputation techniques for missing values, such as mean, median, mode, nearest neighbor, etc., to impute the values for outliers. - Use robust statistical methods:
Some of the statistical methods are less sensitive to outliers and can provide more reliable results when outliers are present in the data. For example, we can use median and IQR for the statistical analysis as they are not affected by the outlier’s presence. This way we can minimize the impact of outliers in statistical analysis.
Transform raw data into actionable knowledge with our free data science course. Enroll today and learn core data science skills from industry experts.
Conclusion
- Outliers are observations in a dataset that differ significantly from the rest of the data points. They can occur due to errors or anomalies in the data collection process, or they may be legitimate observations that are simply rare or extreme.
- Outliers can sometimes lead to misleading, inconsistent, and inaccurate results if they are not properly accounted for. Therefore, it is essential to identify and deal with outliers to obtain accurate and meaningful results from the data analysis.
- There are several ways to detect outliers, such as the percentile method, IQR method, and z-score method. Outliers, once detected, can be handled in several ways, such as removal, transformation, imputation, etc.