How to Obtain Error in Estimation?

Overview
Error estimation is the process of using various statistical methods to determine the error or uncertainty of the developed statistical or ML model.
Error estimation is an important part of data science and statistics, as it helps measure the accuracy and efficiency of the developed statistical and machine learning models.
What is Error?
- In statistics, an error is defined as the difference between a predicted or measured value and the true or observed value.
- In data science, error estimation is an important step in the process of developing and evaluating ML models. A training dataset is used to train the ML model, and a test dataset is further used to evaluate the model's performance. The difference between the predicted values from the model and the true values from the test set can be used to estimate the error or uncertainty in the model.
- This can be done using a variety of statistical methods, such as mean squared error or mean absolute error are the popular metrics to measure the performance of regression models.
Types of Errors
Let’s explore the most common types of errors you may encounter during your data science or statistics project/research.
Random Errors
- Random errors result from the limitation of data collection tools and mechanisms. Random errors are unpredictable and arise from random fluctuations or chance.
- If you encounter random errors in your research, a larger sample size can help in reducing the impact of this error. It can also be reduced by taking multiple measurements of the same quantity and using statistical methods to average or combine the results.
Systematic Errors
- This is a type of error that occurs consistently during data collection. It can be in only one direction, either high or low, and cannot be accounted for by random fluctuations or chance.
- Systematic errors can arise from various sources, such as faulty instruments or a flawed experimental design.
Transform Your Career
Choose from our industry-leading programs designed for career success
Modern Software and AI Engineering Program
Master full-stack development with AI integration

Modern Data Science and ML with specialisation in AI
Advanced data science techniques with AI specialization
Advanced AIML with Specialisation in Agentic AI
Deep dive into AIML with focus on Agentic systems
DevOps, Cloud & AI Platform Engineering
Build and manage AI-powered cloud infrastructure
AI Engineering Advanced Certification by IIT-Roorkee
Premier AI engineering certification from IIT-Roorkee
Calibration Errors
- Calibration error can occur due to miscalibration of the measuring instrument or device or when the standard or reference used for calibration is inaccurate.
- To reduce calibration error, it is essential to calibrate measuring instruments and devices regularly and to use accurate and reliable standards for calibration.
Environmental Factors
- environmental factors are external to the measurement being performed, but they can affect the result in some ways. For example, environmental factors, such as temperature, humidity, air pressure, etc., can cause errors by affecting the accuracy or precision of a measurement.
Zero Offset
- Zero offset error is also known as zero error or zero drift. It is the difference between the true zero point of a measurement scale and the reading measured on the scale.
- This type of error can arise when the zero point of the measurement scale is not accurately set or when the zero point of the scale changes over time due to some external factors such as temperature, age, or mechanical wear.
Human Error
- Human error is a type of error that occurs due to mistakes or errors that people make. There could be several reasons for this error, such as poor training, lack of attention, poor judgment, etc.
- Human error is one of the most common sources of errors and can significantly impact the accuracy and reliability of the results.
Standard Error
- The standard error is a metric that is used to measure errors or uncertainty in a sample statistic. Standard error estimation can help us understand how different a population is likely to be from the collected sample or how well your sample data represents the whole population.
- You can decrease standard error by increasing the sample size. A large and random sample is the best way to minimize sampling bias and reduce standard error.
- The standard error is typically denoted by SE. The standard error of the mean (SEM) is one of the most common types of standard error used in statistics.
Standard Error of the Mean
- The standard error of the mean (SEM) describes how different the sample mean is likely to be from the population mean. In other words, it is a measurement of how far the sample mean is likely to be from the population mean.
- The standard error of the mean (SEM) is defined as the standard deviation of the sampling distribution of the mean. It can be computed using below formula -

Estimated Standard Errors and Nuisance Parameters
- The exact value of the SEM depends on the true standard deviation of the sample σ, but this value is generally not known in many real-life cases.
- In this case, we can estimate it using the sample standard deviation σ^. We can use sample standard deviation σ^ to calculate the estimated standard deviation to produce an estimated standard error σ^/n.
- Here, a quantity like σ that is not of direct interest but needed to conduct uncertainty analysis on our quantity of direct interest (i.e., the mean) is called a nuisance parameter.
Turn Learning into Career Growth
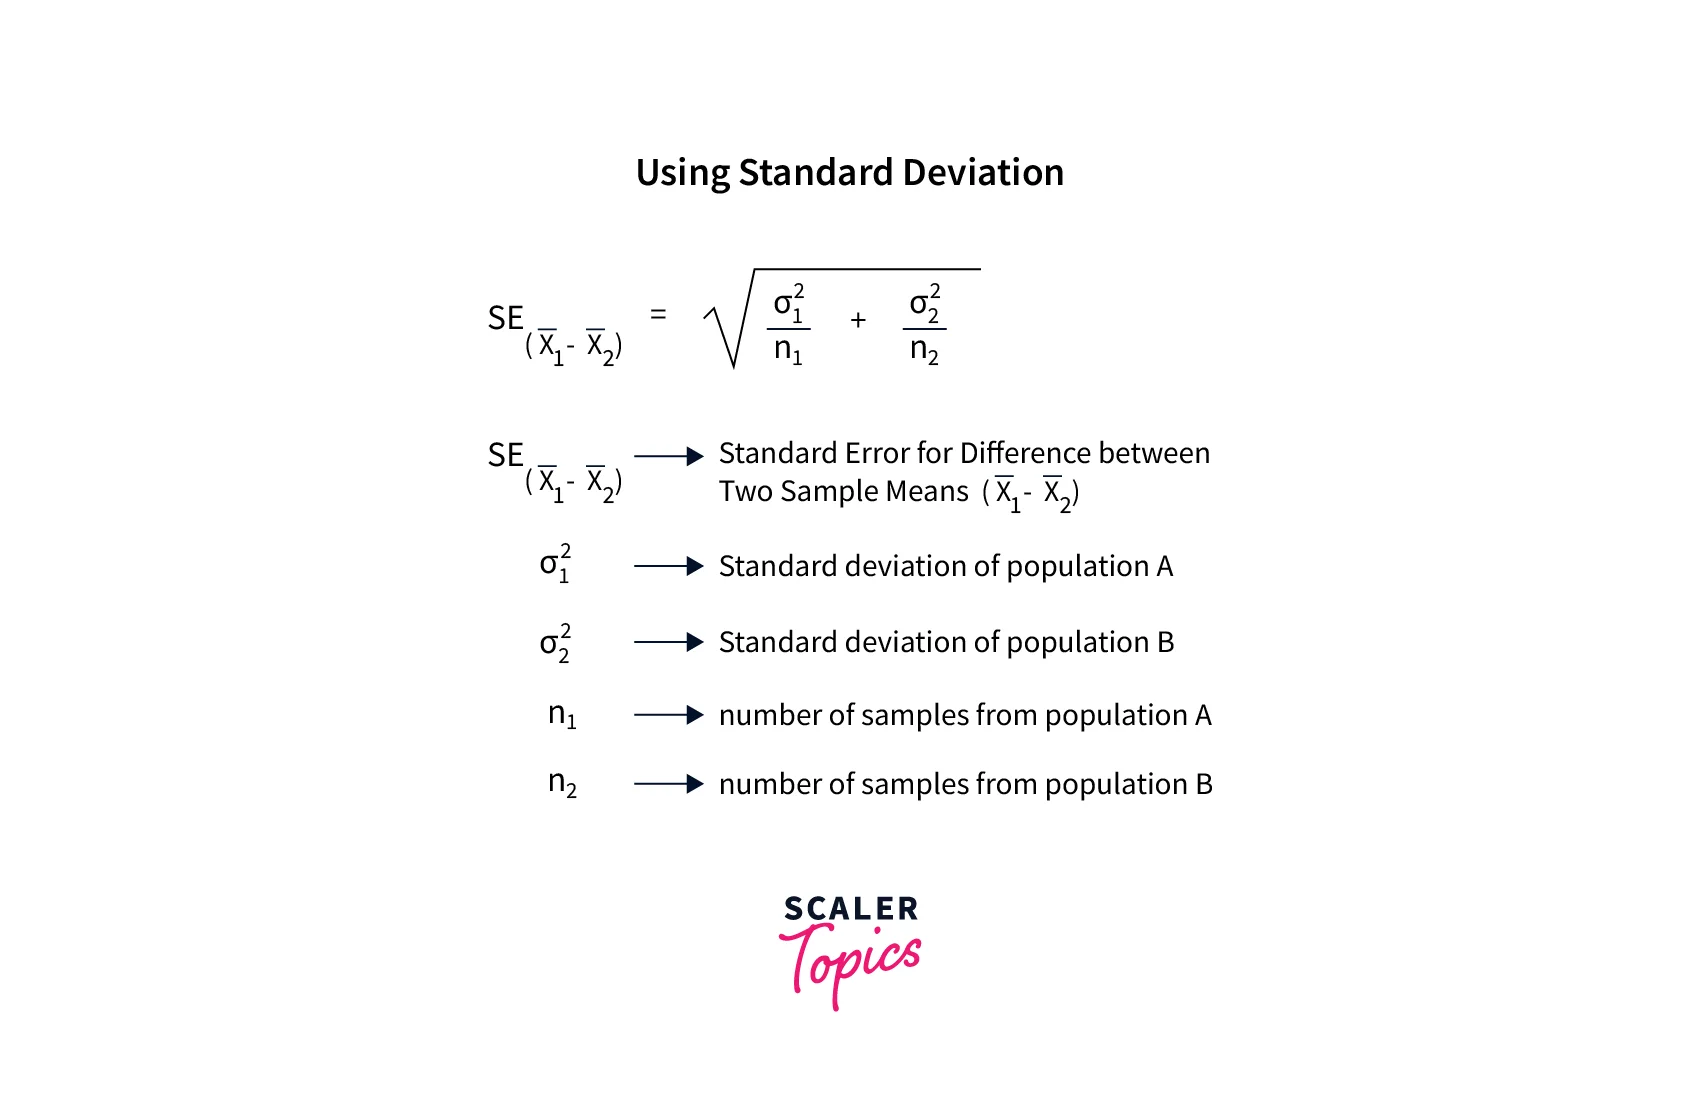
Standard Errors for Differences
- The standard errors for differences are used to estimate the uncertainty or error in the difference between two sample statistics. Generally, the difference between the means or proportions of two samples is used in this case.
- Standard errors for differences between means is the most popular metrics to compare the two sample statistics. The sample difference between the two means is modeled using the t-distribution, and the below formula gives a standard error for the difference between the two means.
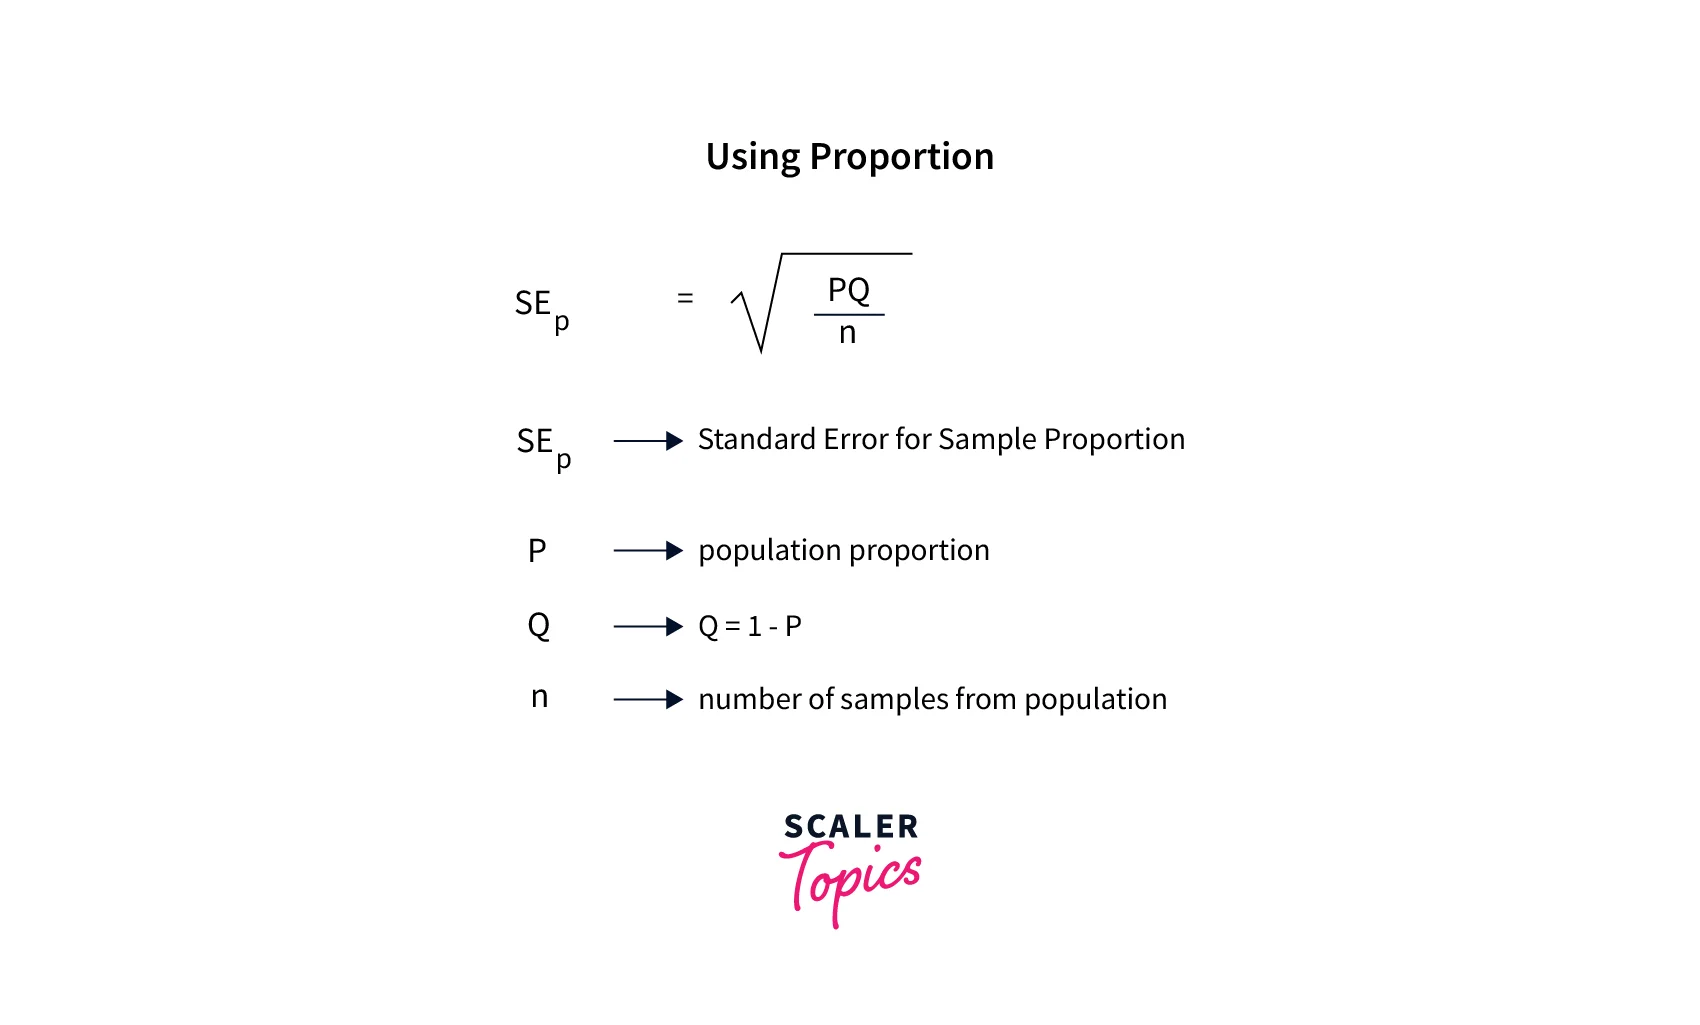
Standard Errors for Proportions
-
In statistics, we’re often interested in estimating the proportion of individuals in a larger population with a certain characteristic. For example, we might be interested in estimating gender proportions in newborn babies.
-
In this estimation, the standard error for proportions describes how different the sample proportions are likely to be from the whole population. It can be calculated using below formula:
Scaler Placement Report and Statistics
Scaler learners achieved 2.5x salary growth with average post-Scaler CTC reaching ₹23L.
Standard Errors for Other Statistics
- Apart from mean and proportions, standard errors can also be calculated for other various metrics, such as median, mode, range, etc.
- The formula for calculating the standard error of a statistic will depend on the specific statistic being used, and it is essential to use the right formula to accurately quantify the uncertainty or error in the estimate of the statistic.
Scaler Placement Report and Statistics
Scaler learners achieved 2.5x salary growth with average post-Scaler CTC reaching ₹23L.
Different Measures of Error
Let’s explore some of the most common metrics to estimate or measure error for the regression ML models in data science.
Mean Absolute Error (MAE)
- The mean absolute error (MAE) is defined as the average of all absolute errors between observed and predicted values.
- The MAE is a commonly used error measure as it is easy to interpret and is not sensitive to outliers in the data. However, it does not provide much information about the distribution of the errors as some other measures of error, such as mean squared error or root mean squared error, do.
MAE = mean absolute error prediction true value total number of data points
Mean Absolute Percentage Error (MAPE)
-
The mean absolute percentage error (MAPE), also called as the mean absolute percentage deviation (MAPD), is used to measure the accuracy of regression models.
-
It measures this error or accuracy as a percentage which can be calculated using the below formula:
- is the actual value
- is the forecast value
- n is the total number of observations
Mean Squared Error (MSE)
- The mean squared error (MSE) helps you estimate how close a regression line is to actual observed values.
- MSE is calculated by taking the average of squared differences between predicted and observed values. The squaring is required to remove any negative signs. MSE can be calculated using the below formula:

Root Mean Square Error (RMSE)
-
Root Mean Square Error (RMSE) is the most popular error measure used to estimate the accuracy of regression models. It is defined as the square root of the means squared error (MSE).
-
A benefit of using RMSE over MSE is that its output metrics are on the same scale as the target variable. For example, for a house price prediction model, RMSE would give the error in the unit of house price only, which can help users easily understand the model performance.
-
RMSE can be calculated using the below formula:
Conclusion
- Error estimation is defined as the process of using various statistical methods to determine the error or uncertainty of the developed statistical or ML model. It can help measure the accuracy or performance of the ML models.
- Errors can be of several types, such as random error, systematic error, human error, zero offset error, etc.
- The most popular techniques to measure error include - standard error, RMSE, MSE, etc.