Hypothesis Testing in Data Science

Overview
Statistics is a branch of mathematics discipline that is related to the collection, analysis, interpretation, and presentation of data. Statistics is a powerful tool for understanding, interpreting data, and making informed decisions.
Hypothesis Testing is one of the most important concepts in Statistics. In Statistics, Hypothesis Testing is to ascertain whether a hypothesis about a population is true. Let’s explore Hypothesis Testing in detail in this article.
What is Hypothesis Testing?
- In Data Science and Statistics, Hypothesis Testing is used to determine whether a certain set of hypotheses about a larger population is true or not. Hypothesis Testing generally includes below steps:
- Formulate a specific assumption or hypothesis about a larger population.
- Collect data from a sample of the population.
- Use various statistical methods to determine whether the data supports the hypothesis or not.
- Hypothesis Testing allows Data Scientists and Analysts to derive inferences about a population based on the data collected from a sample, and to determine whether their initial assumptions or hypotheses were correct.
- There are two types of hypotheses used in Hypothesis Testing, as mentioned below:
- Null Hypothesis:
The Null Hypothesis assumes no significant relationship exists between the variables being studied (one variable does not affect the other). In other words, it assumes that any observed effects in the sample are due to chance and are not real. The Null Hypothesis is typically denoted as H0. - Alternative Hypothesis:
It is the opposite of the Null Hypothesis. It assumes that there is a significant relationship between the variables. In other words, it assumes that the observed effects in the sample are real and are not due to chance. The Alternative Hypothesis is typically denoted as H1 or Ha.
- Null Hypothesis:
- Let’s understand how Hypothesis Testing is used in real-world scenarios :
- Hypothesis Testing is used to test a new drug's effectiveness in treating a certain disease. In this case, the Null Hypothesis will be that the drug is not effective at treating the disease, and the Alternative Hypothesis will be that the drug is effective.
- It is also used to ascertain the effectiveness of a marketing campaign. In this case, the Null Hypothesis will be that the marketing campaign has no effect on sales and revenue, and the Alternative Hypothesis will be that the campaign is effective at increasing sales.
- Various statistical methods are further used to reject or fail to reject the Null Hypothesis.
Significance Level and P-Value
Transform Your Career
Choose from our industry-leading programs designed for career success
Modern Software and AI Engineering Program
Master full-stack development with AI integration

Modern Data Science and ML with specialisation in AI
Advanced data science techniques with AI specialization
Advanced AIML with Specialisation in Agentic AI
Deep dive into AIML with focus on Agentic systems
DevOps, Cloud & AI Platform Engineering
Build and manage AI-powered cloud infrastructure
AI Engineering Advanced Certification by IIT-Roorkee
Premier AI engineering certification from IIT-Roorkee
Significance Level
- The significance level is a probability threshold used in hypothesis testing to determine whether a study's results are statistically significant.
- It is essentially the probability threshold of the case when we reject the null hypothesis, but in reality, it is true. For example, a 0.05 significance level means that the probability of observing data/results must be less than 0.05 for the results to be statistically significant. It is denoted by alpha (α).
- Generally, the lower the significance level, the more stringent the criteria for determining statistical significance.
P-Value
- A p-value, or probability value, describes the likelihood of the occurrence of the observed data by random chance (Null Hypothesis is true).
- For example, suppose the statistical significance is set at 0.05 and the p-value of the results is less than 0.05. In that case, the results are considered statistically significant, and the null hypothesis is rejected. If the p-value > 0.05, then we can not reject the null hypothesis.
Scaler Placement Report and Statistics
Scaler learners achieved 2.5x salary growth with average post-Scaler CTC reaching ₹23L.
Comparison of Means
- Comparison of Means is a method that is used to determine whether the means of two or more groups are significantly different from each other or not. It is used to determine whether the observed difference between two means is due to chance or not.
- In this test, the null hypothesis is that there is no difference between the two means, and the alternative hypothesis is that the two means are significantly different.
- Several tests, such as z-test, t-test, ANOVA, etc., are used to perform this method.
Z-Test
-
Z-Test is used to compare the means of two groups when the population's standard deviation is known, and the number of samples is large.
-
It is calculated by dividing the difference between the two means by the standard error of the mean. The resulting z-score is then compared to a normal distribution to determine whether the difference is statistically significant or not.
-
Z-score for two groups (sample and population) can be calculated using the below formula:
Turn Learning into Career Growth
T-Test
-
The T-Test is similar to z-tests, but they are used when the populations’ standard deviation is unknown and the number of samples is small (n <= 30).
-
The t-test calculates the difference between the two means and compares it to a t-distribution to determine whether the difference is statistically significant.
-
There are several types of t-tests used to compare the means of two groups, such as one-sample t-test, two-sample t-test, independent sample t-test, etc.
-
The formula to calculate t-test statistic is shown below, where is the mean of the sample, is the mean of the population, is the standard deviation, and is the total number of observations in the sample.
Test of Proportions
- A test of proportions is used to compare the proportion/percentage of individuals in two groups exhibiting a certain characteristic. This method is useful to determine whether the proportions of individuals in a sample differ significantly with a larger population.
- For example, the test of proportions can be used to compare the proportion/percentage of males and females with a certain medical condition, it can be used to compare the percentage of genders in newborn babies, etc. A test of proportions aims to determine whether the observed differences in the ratios are significant or if they are simply due to chance.
- In Data Science, tests of proportions can be used to compare two variables when one variable is categorical and the other is numerical. Several techniques are used to perform proportions tests, such as the chi-square goodness of fit test, one proportion z-test, two proportion z-test, etc.
Chi-Square Goodness of Fit Test
-
In the Chi-Square Goodness of Fit Test, we evaluate whether the proportions of a categorical variable in the sample follow the population distribution with hypothesized proportions.
-
The null and alternative hypotheses in the chi-square goodness of fit test are defined as follows:
- Null Hypothesis:
The sample data follow the population distribution with the hypothesized distribution. - Alternative Hypothesis:
The sample data do not follow the population distribution with the hypothesized distribution.
- Null Hypothesis:
-
The formula for the chi-squared goodness of fit test is shown O is the observed frequency for each category, and E is the expected frequency for each category under the hypothesized distribution.
-
The resulting chi-squared statistic is then compared to a critical value from a chi-squared distribution table to determine the p-value.
-
The null hypothesis is rejected if the p-value is less than the predetermined significance level (usually 0.05).
Test of Independence
- The test of independence is a statistical method that is used to determine whether there is any association or correlation between two categorical variables or whether both variables are independent of each other.
- The chi-squared test of independence is one of the most popular methods to perform the test of independence.
Type I and Type II Error
-
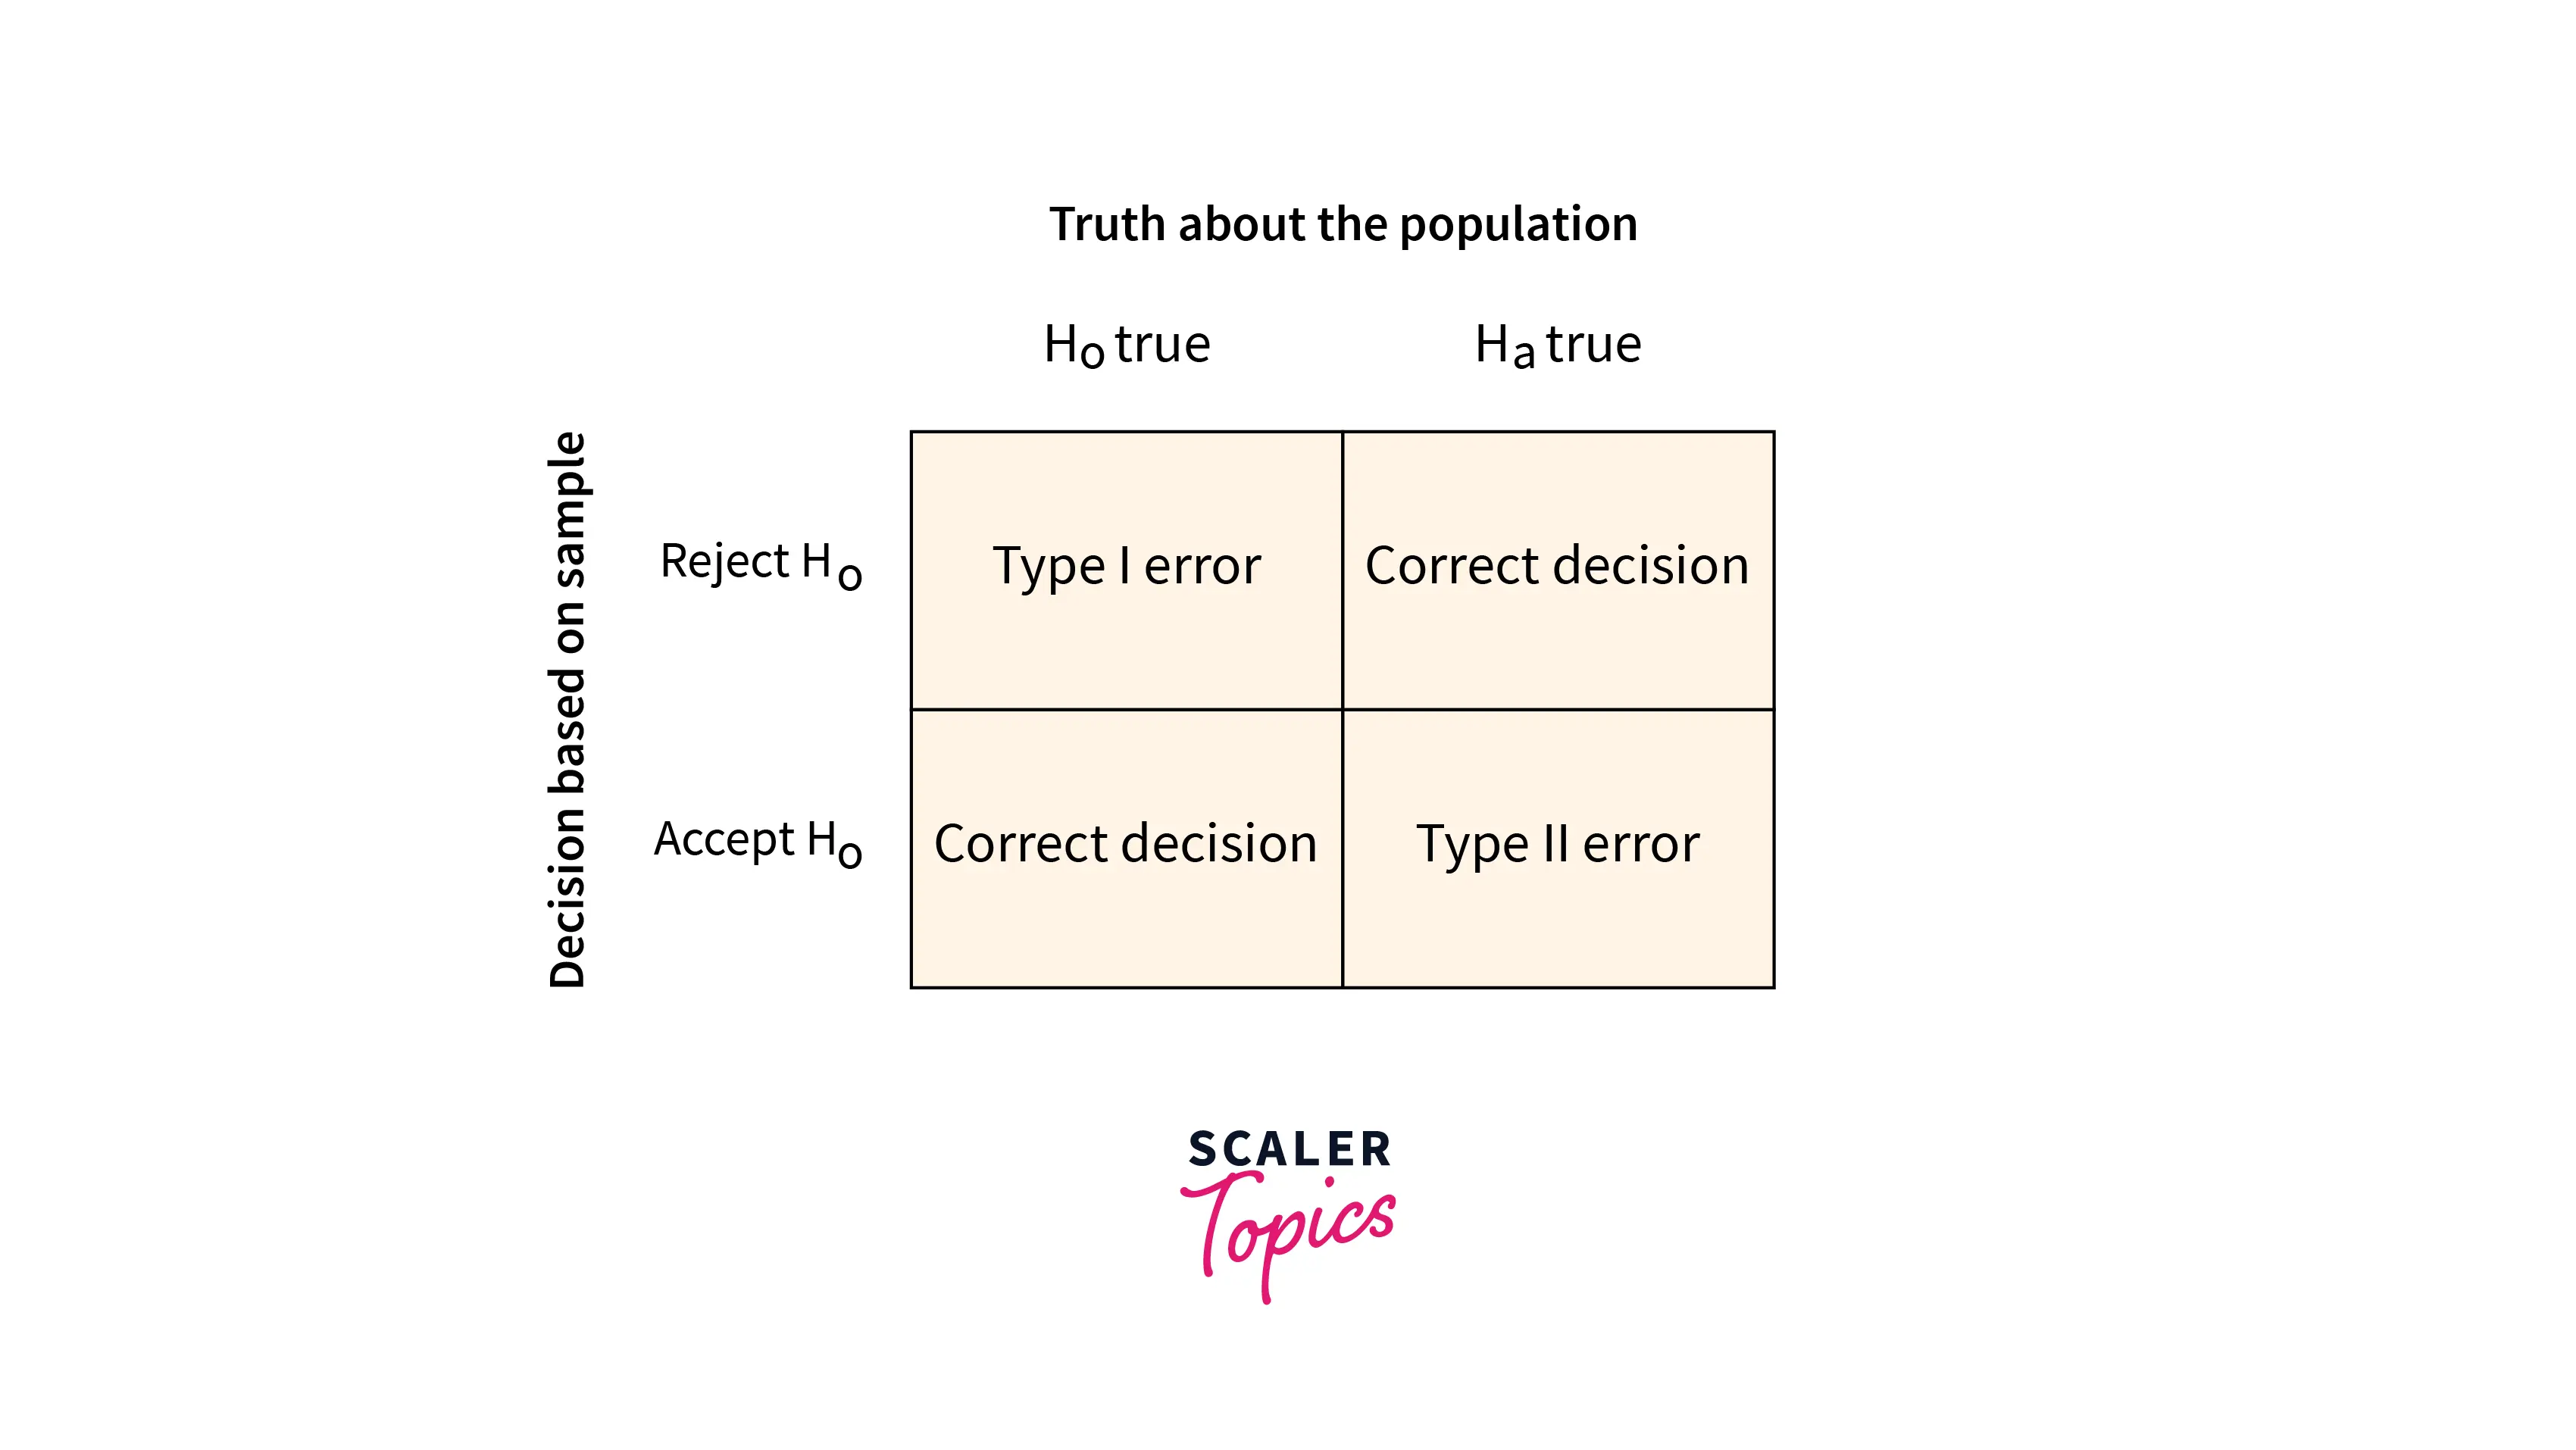
During performing Hypothesis Testing, there might be some errors. Two types of errors are generally encountered while performing Hypothesis Testing.
- Type I Error:
Type I error is the case when we reject the null hypothesis, but in reality, it is true. The probability of having a Type-I error is called significance level alpha(α). It is the case of False Positive or incorrect rejection of the null hypothesis. - Type II Error:
Type II error is the case when we fail to reject the null hypothesis, but it is false. The probability of having a type-II error is called beta(β). It is the case of False Negative or incorrect acceptance of the null hypothesis.
- Type I Error:
ANOVA
-
ANOVA stands for Analysis of Variance. In statistics, the ANOVA test is generally used to determine whether multiple groups have statistically significant different means or not.
-
This method is advantageous for comparing the means of groups when you have more than two groups to study. T-tests on multiple groups result in a higher error rate, while ANOVA keeps it lower.
-
Below are the steps to perform the ANOVA test to compare the means of multiple groups:
- Hypothesis Generation
- Calculate within the group and between groups variability and other metrics
- Calculate F-Ratio
- Calculate probability (p-value) by comparing F-Ration to F-table
- Use p-value to reject/fail to reject the null hypothesis
-
ANOVA test can be performed using the formulas mentioned below figure:
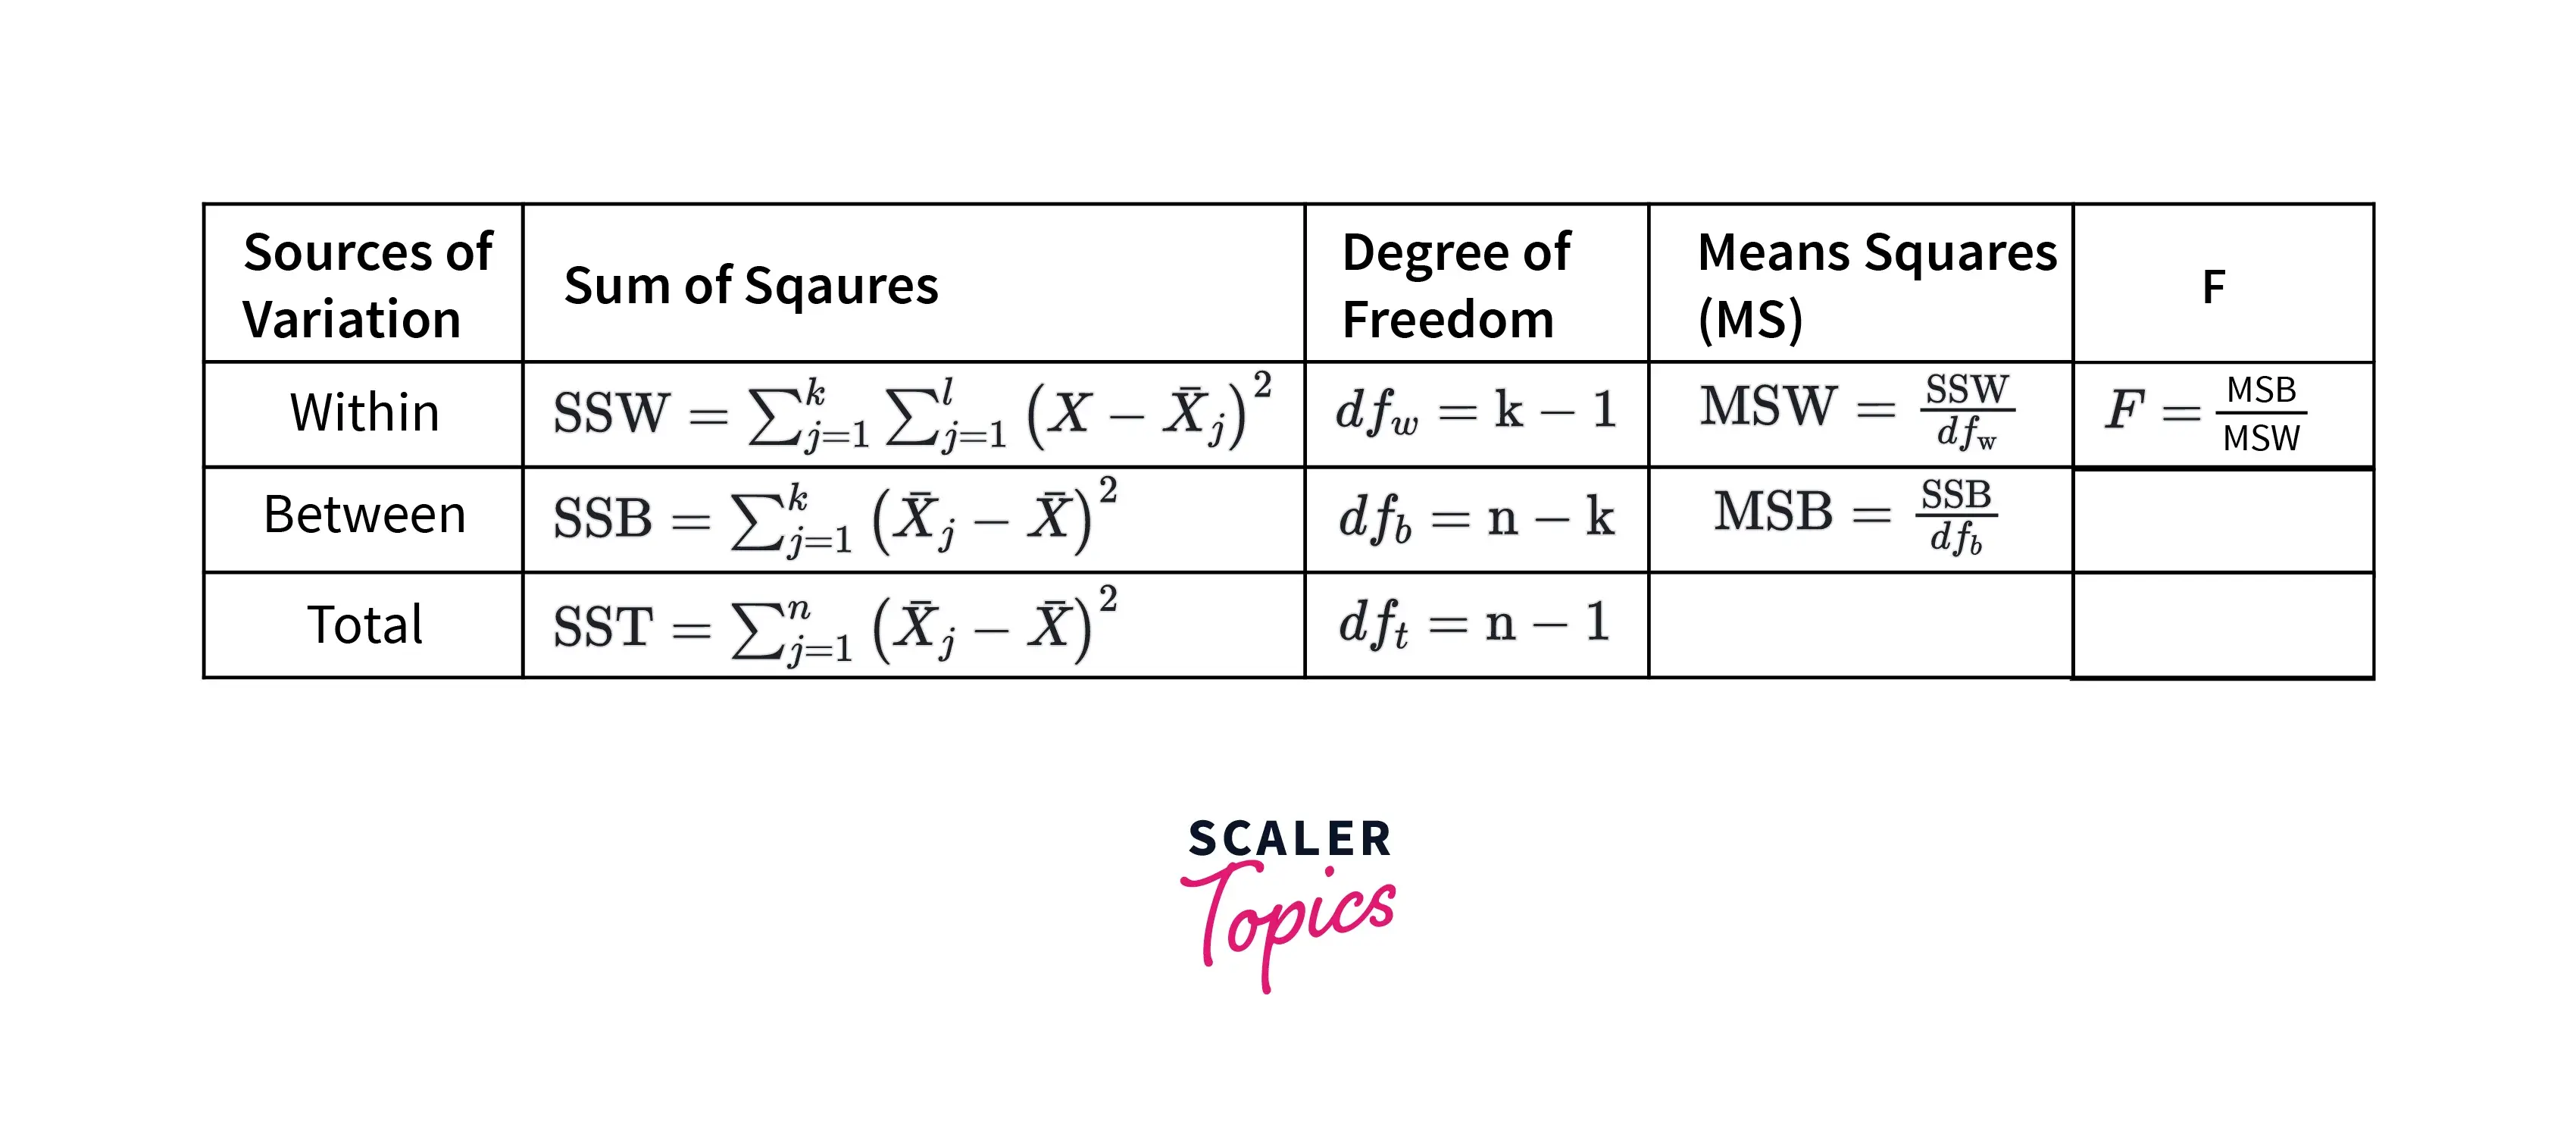
Where,
- The Sum of Squares is the squared mean differences between groups and within the group.
- For between groups, the degree of freedom is defined as , where k is the total number of groups to study. For within groups, it is , where n is the total observations.
Conclusion
- Hypothesis Testing is used to determine whether a certain set of hypotheses about a larger population is true or not.
- In Data Science, it is frequently used to compare two variables, whether they are statistically significant or independent of each other. A few of the most common methods to perform Hypothesis Testing include - the z-test, t-test, chi-squared test, ANOVA, etc.