Residual Analysis

Overview
One of the most important aspects of a Machine Learning Development Lifecycle is validating and evaluating the ML model’s performance. For regression ML models, several techniques, such as R squared score, etc., are available to measure the fitness and accuracy of the model.
Residual analysis is a technique used to assess a regression model's validity by examining the differences between observed values and predicted values by the model.
What are Residuals?
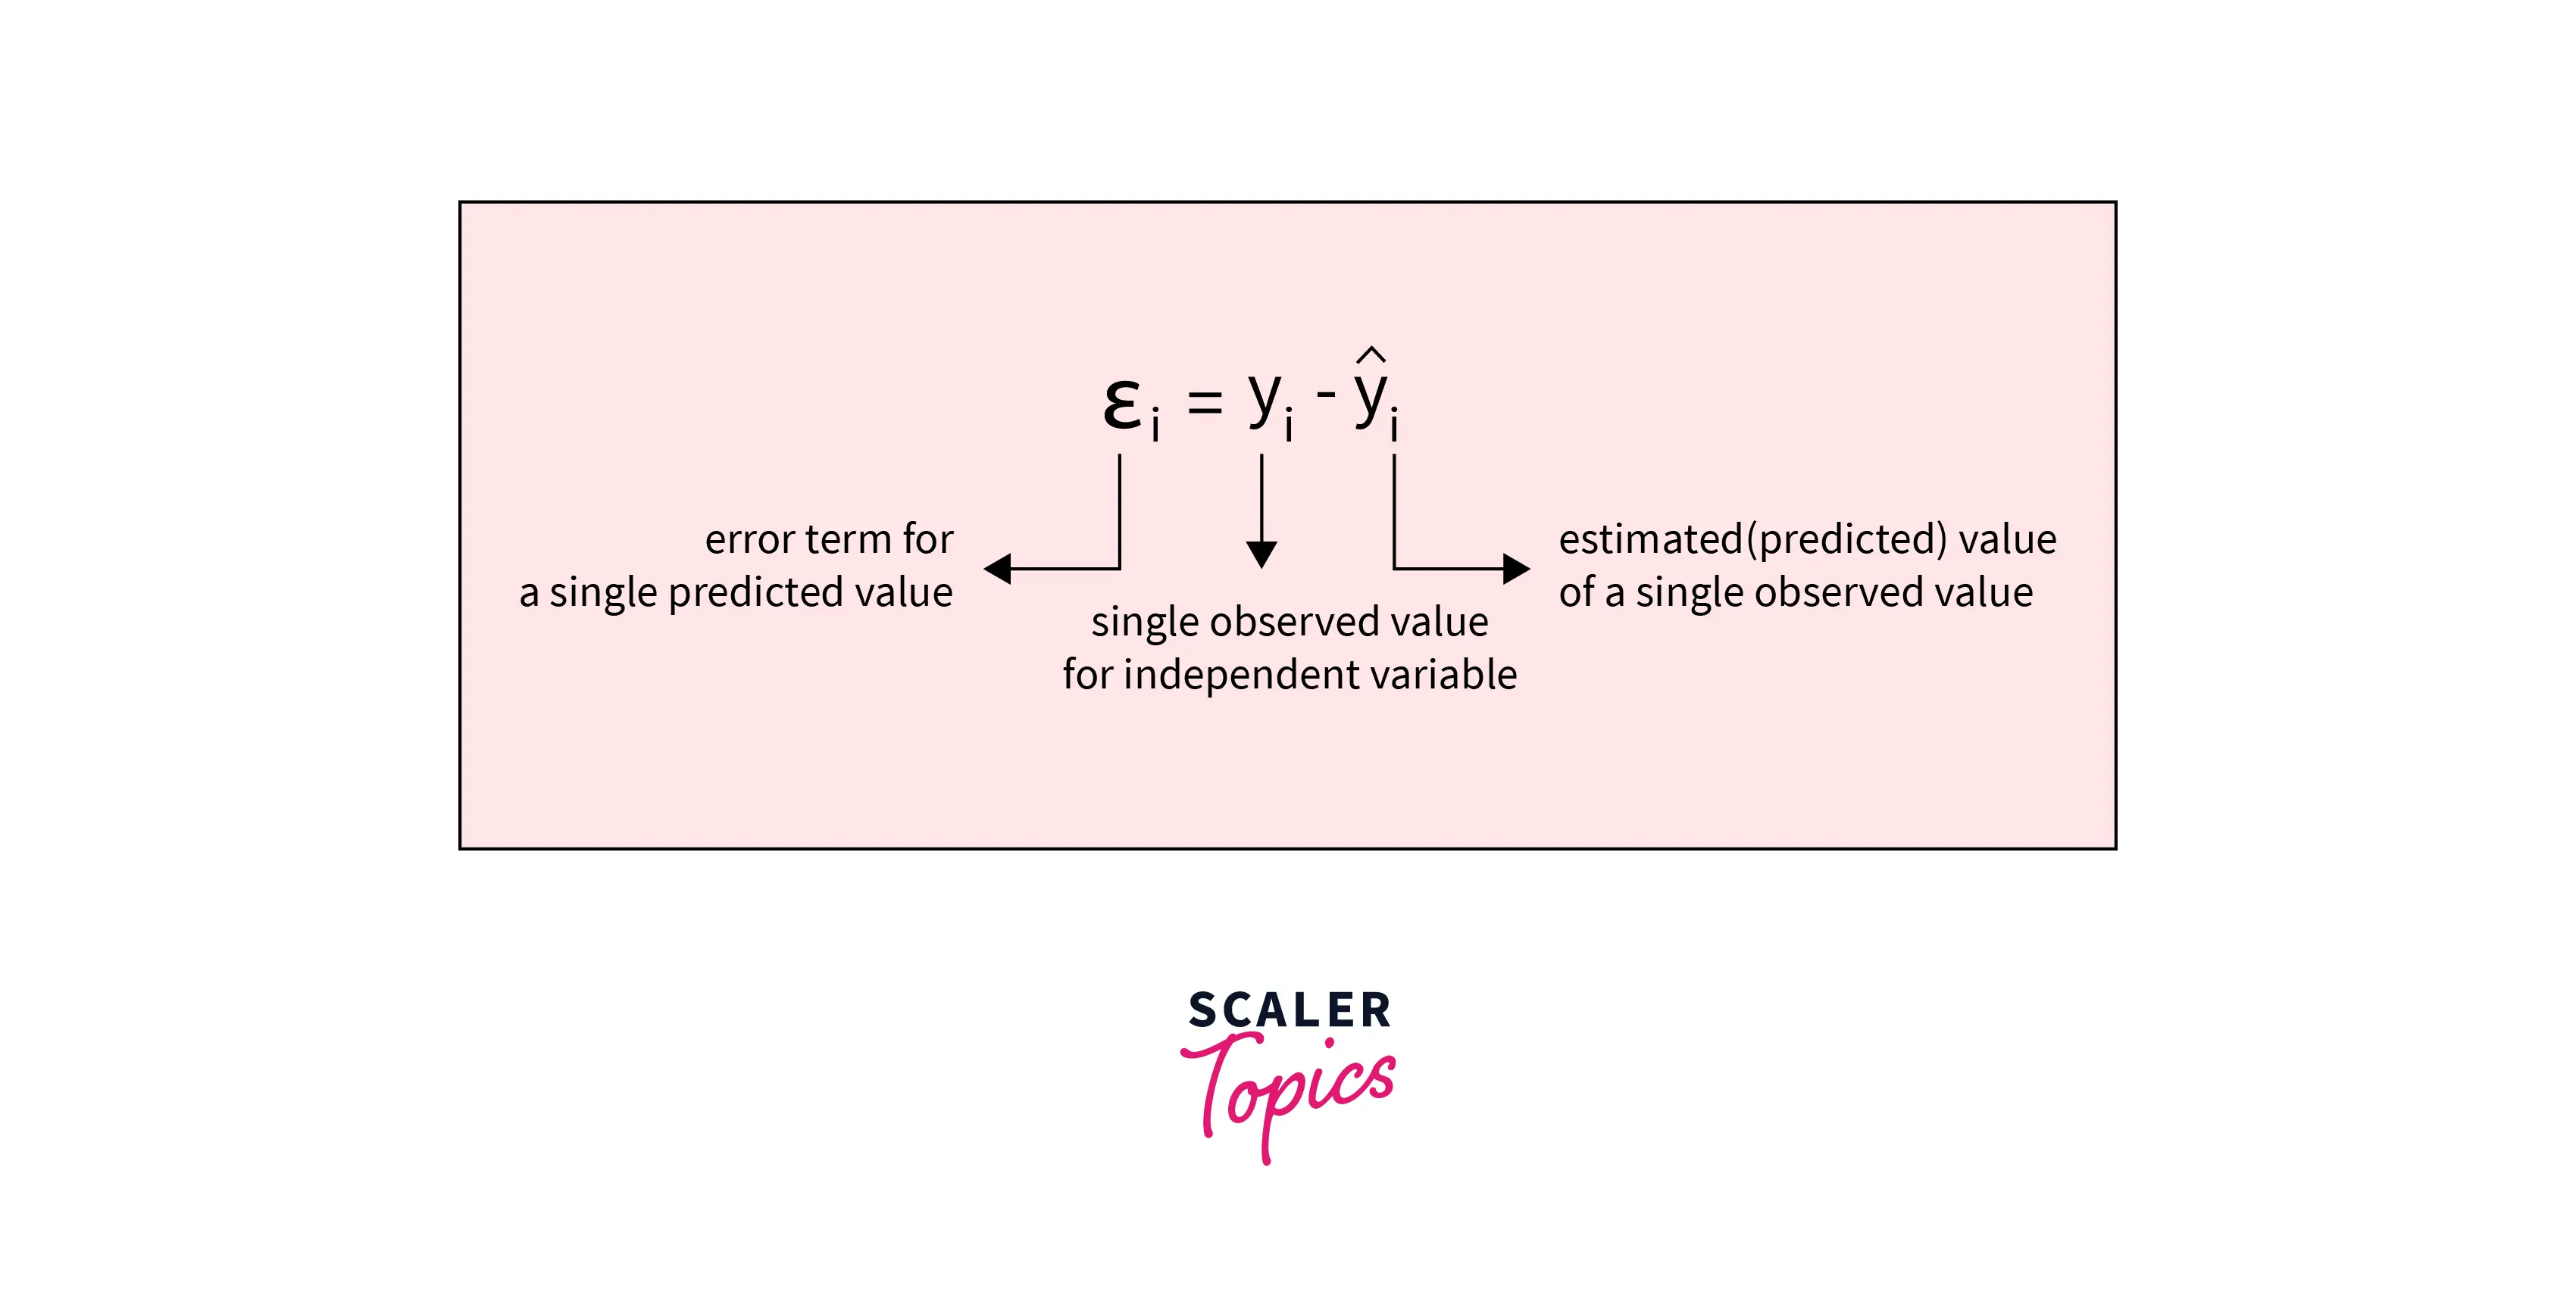
- In statistics, a residual is the difference between a variable's observed value and the variable's predicted value based on a statistical or ML model. In other words, in regression models, a residual measures how far away a point is from the regression line.
- In a residual analysis, residuals are used to assess the validity of a statistical or ML model. The model is considered a good fit if the residuals are randomly distributed. If there are patterns in the residuals, then the model is not accurately capturing the relationship between the variables. It may need to be improved, or another model may need to be selected.
Transform Your Career
Choose from our industry-leading programs designed for career success
Modern Software and AI Engineering Program
Master full-stack development with AI integration

Modern Data Science and ML with specialisation in AI
Advanced data science techniques with AI specialization
Advanced AIML with Specialisation in Agentic AI
Deep dive into AIML with focus on Agentic systems
DevOps, Cloud & AI Platform Engineering
Build and manage AI-powered cloud infrastructure
AI Engineering Advanced Certification by IIT-Roorkee
Premier AI engineering certification from IIT-Roorkee
Residual Plot
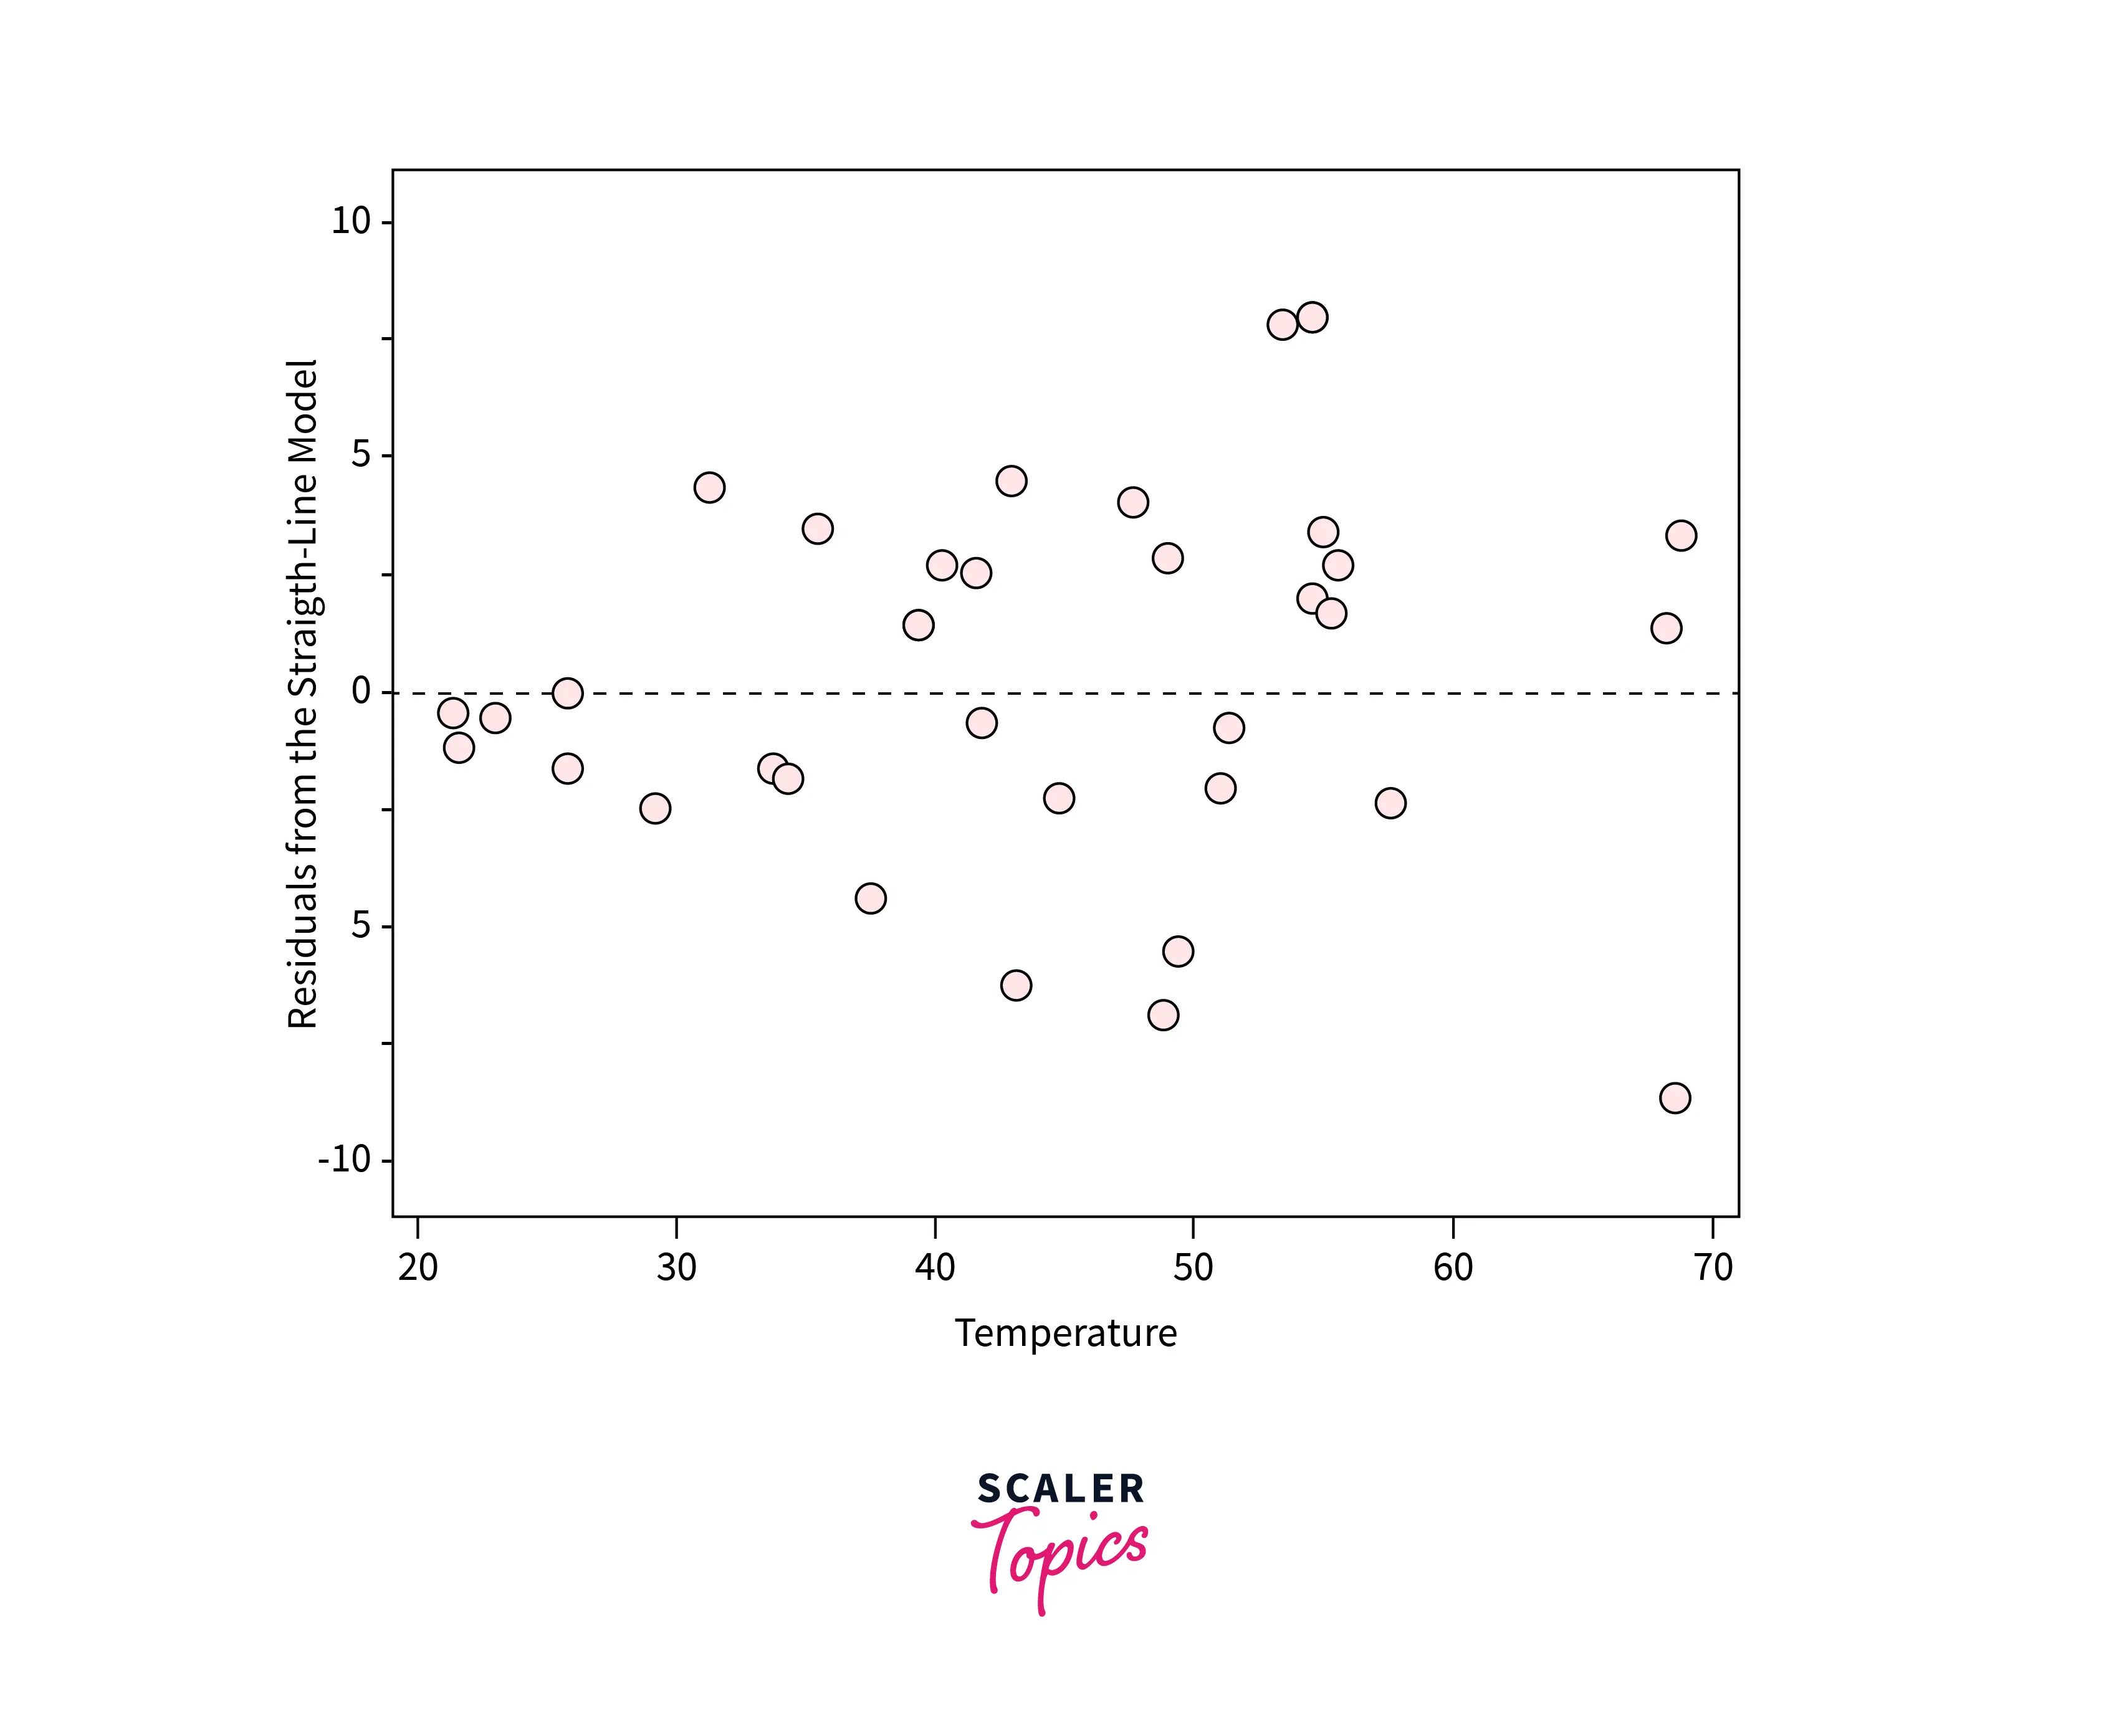
- A residual plot is a scatterplot in which X-axis represents the independent or target variable, and Y-axis represents residual values based on the ML model.
- A residual plot is used to identify the underlying patterns in the residual values. We can assess the ML model's validity based on the observed patterns.
Types of Residual Plots
Based on patterns observed in residual values, there are several types of residual plots, as mentioned below :
Random Pattern
-
In this category of residual plots, residual values are randomly distributed, and there is no visible pattern in the values. In this case, the developed ML model is considered a good fit.
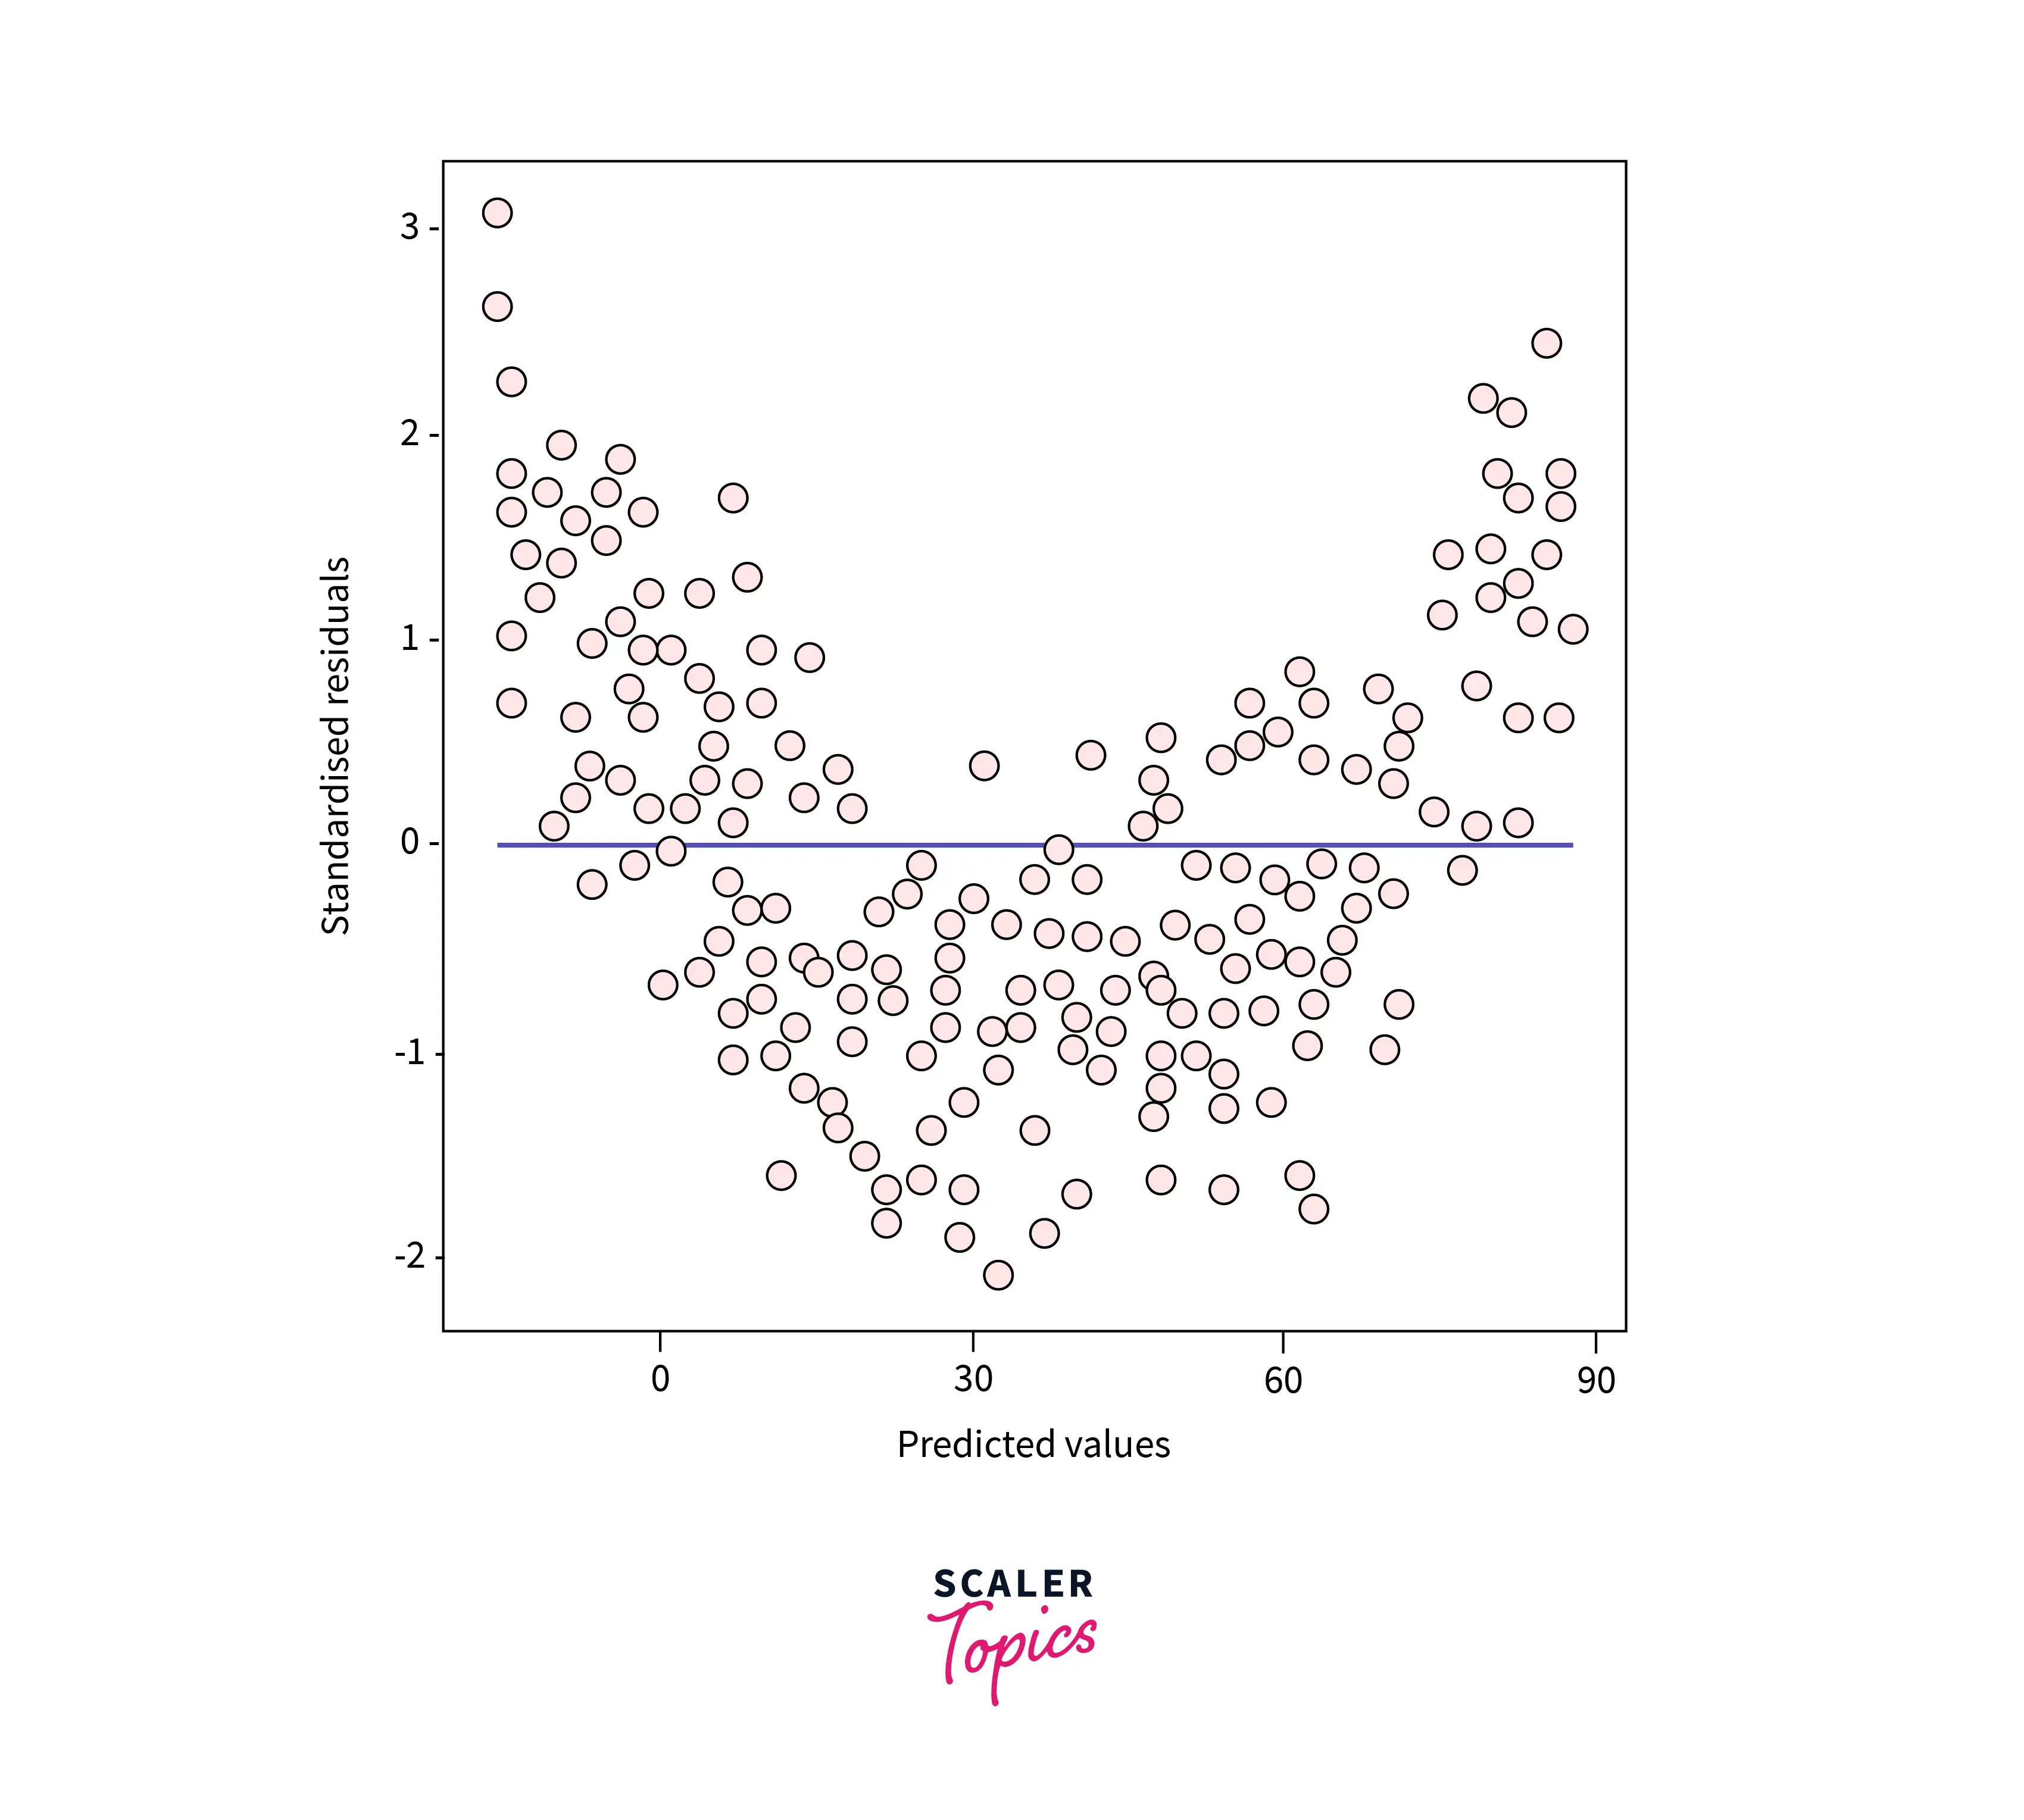
U-Shaped Pattern
-
In this category, the residual plot follows a U-shaped curve, as mentioned in the below figure. In this case, the model is not considered a good fit, and a non-linear model might be required.
Assumptions Regarding Residuals in Linear Regression
Before evaluating the linear regression models using residual plot analysis, let’s first understand three basic assumptions of linear regression models regarding residuals.
Independence
-
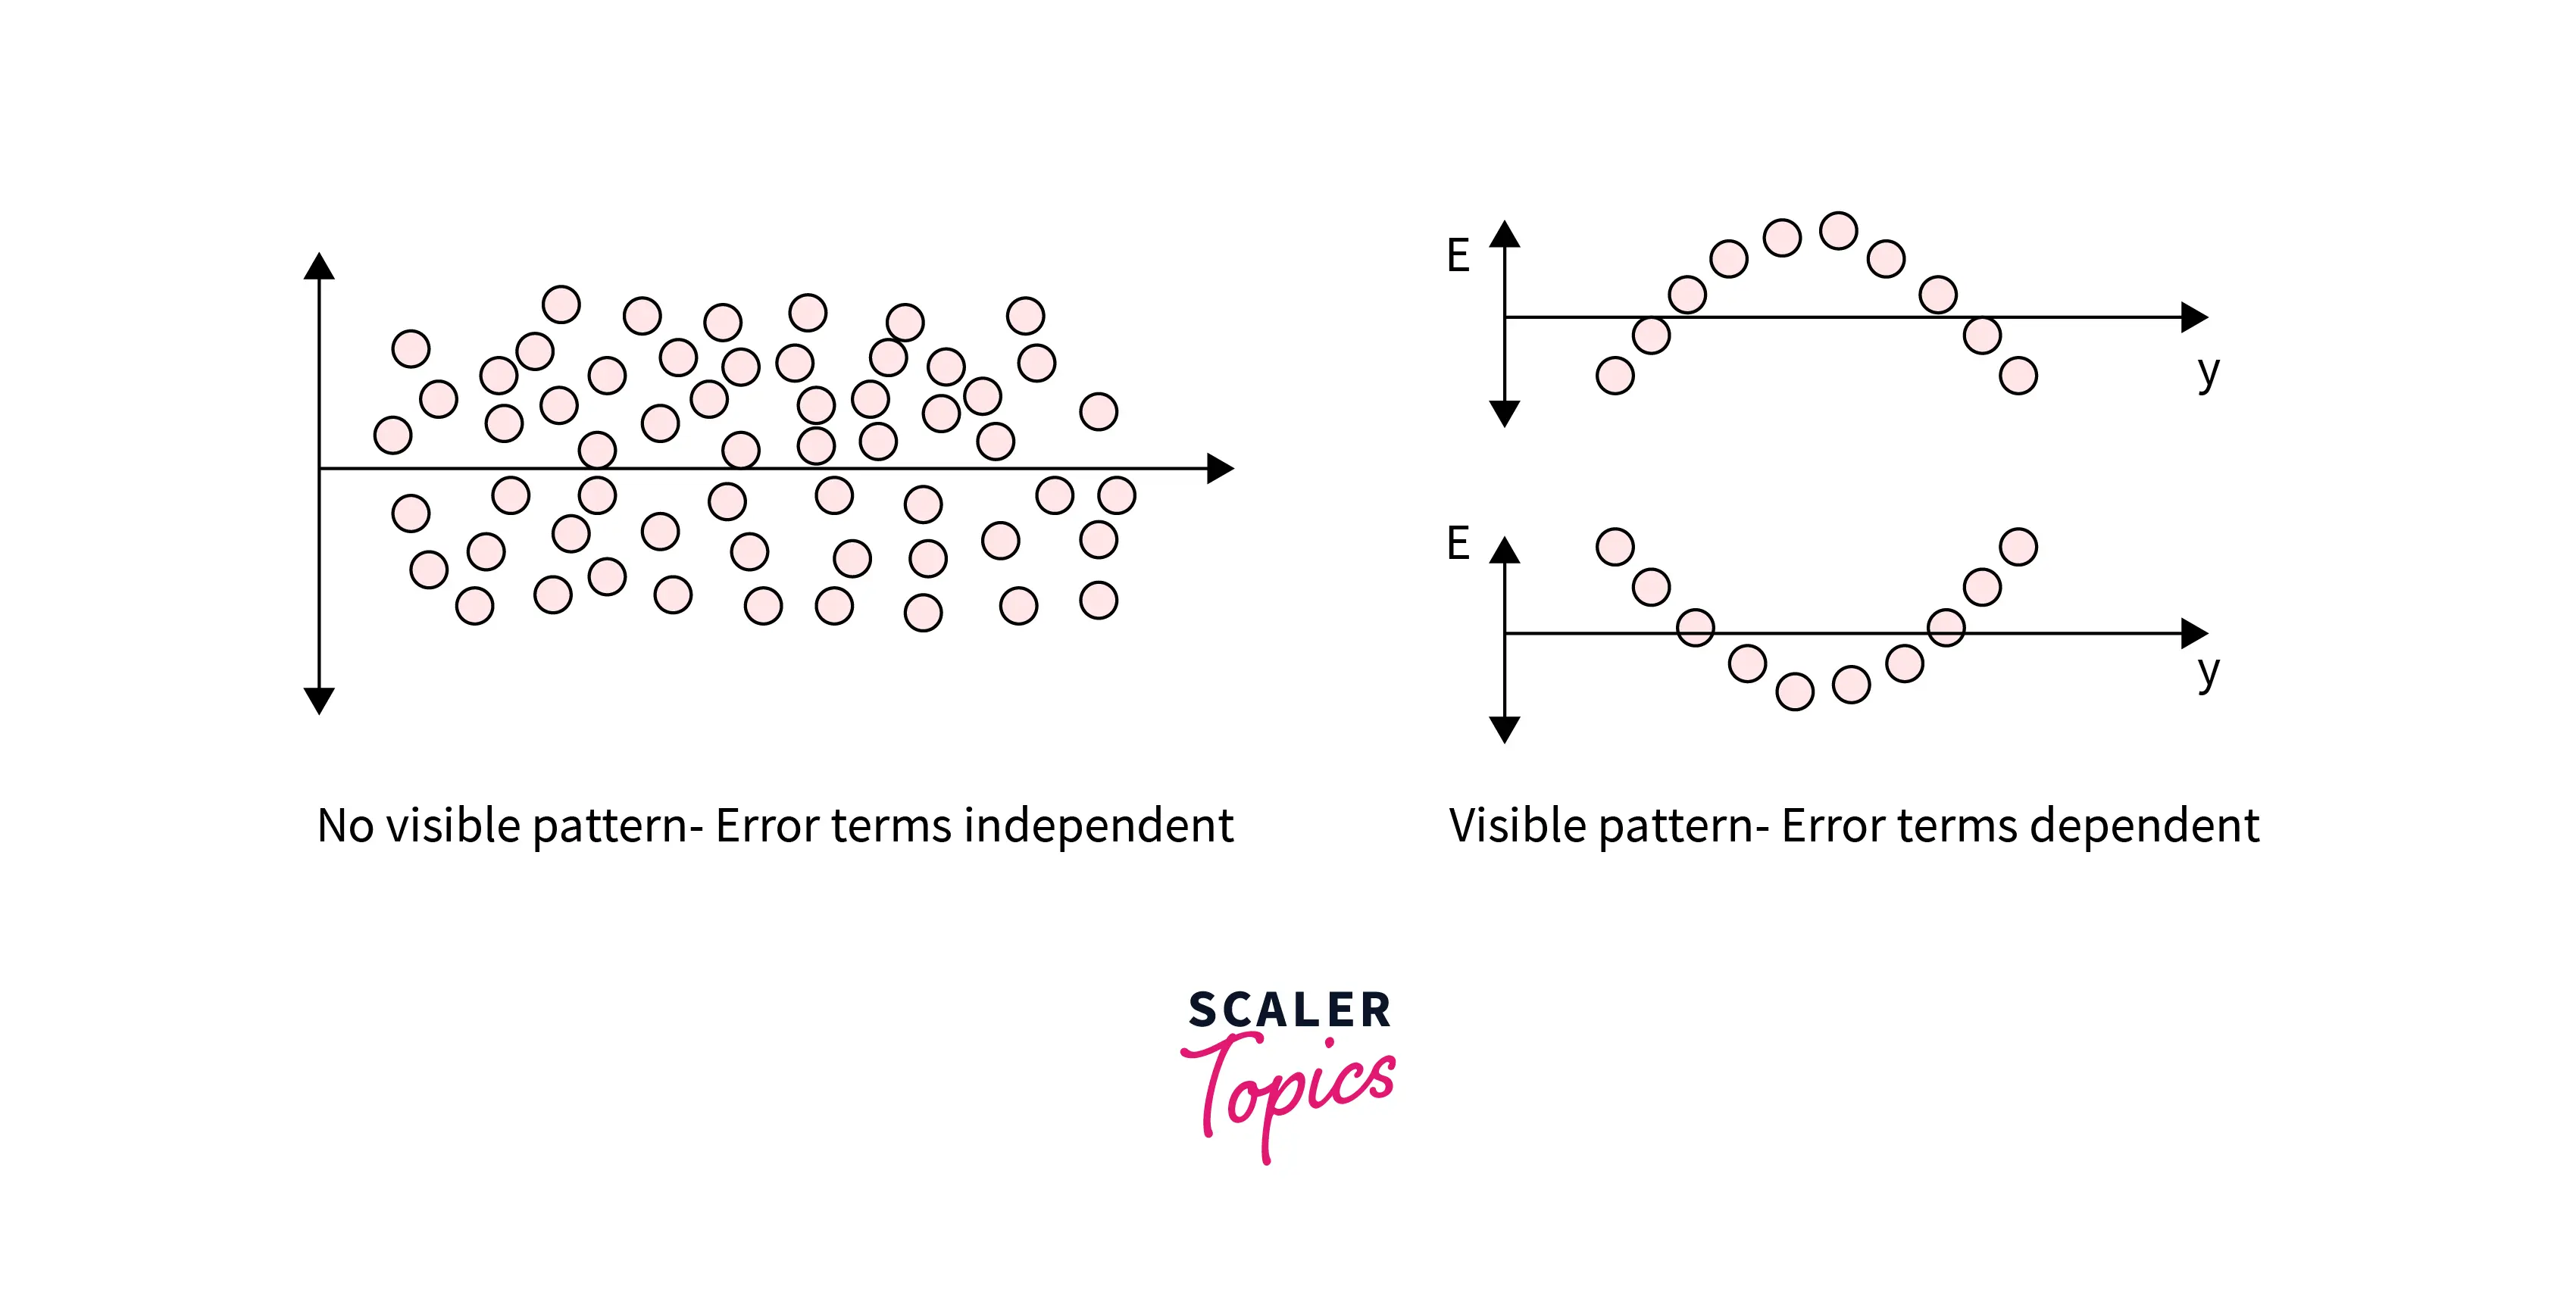
The linear regression model assumes that residuals or error terms are independent and that no visible pattern exists. It means that their pairwise covariance is zero.
-
If the error terms are not independent, then the uniqueness of the least square’s solution is lost, and the model is not considered a good fit.
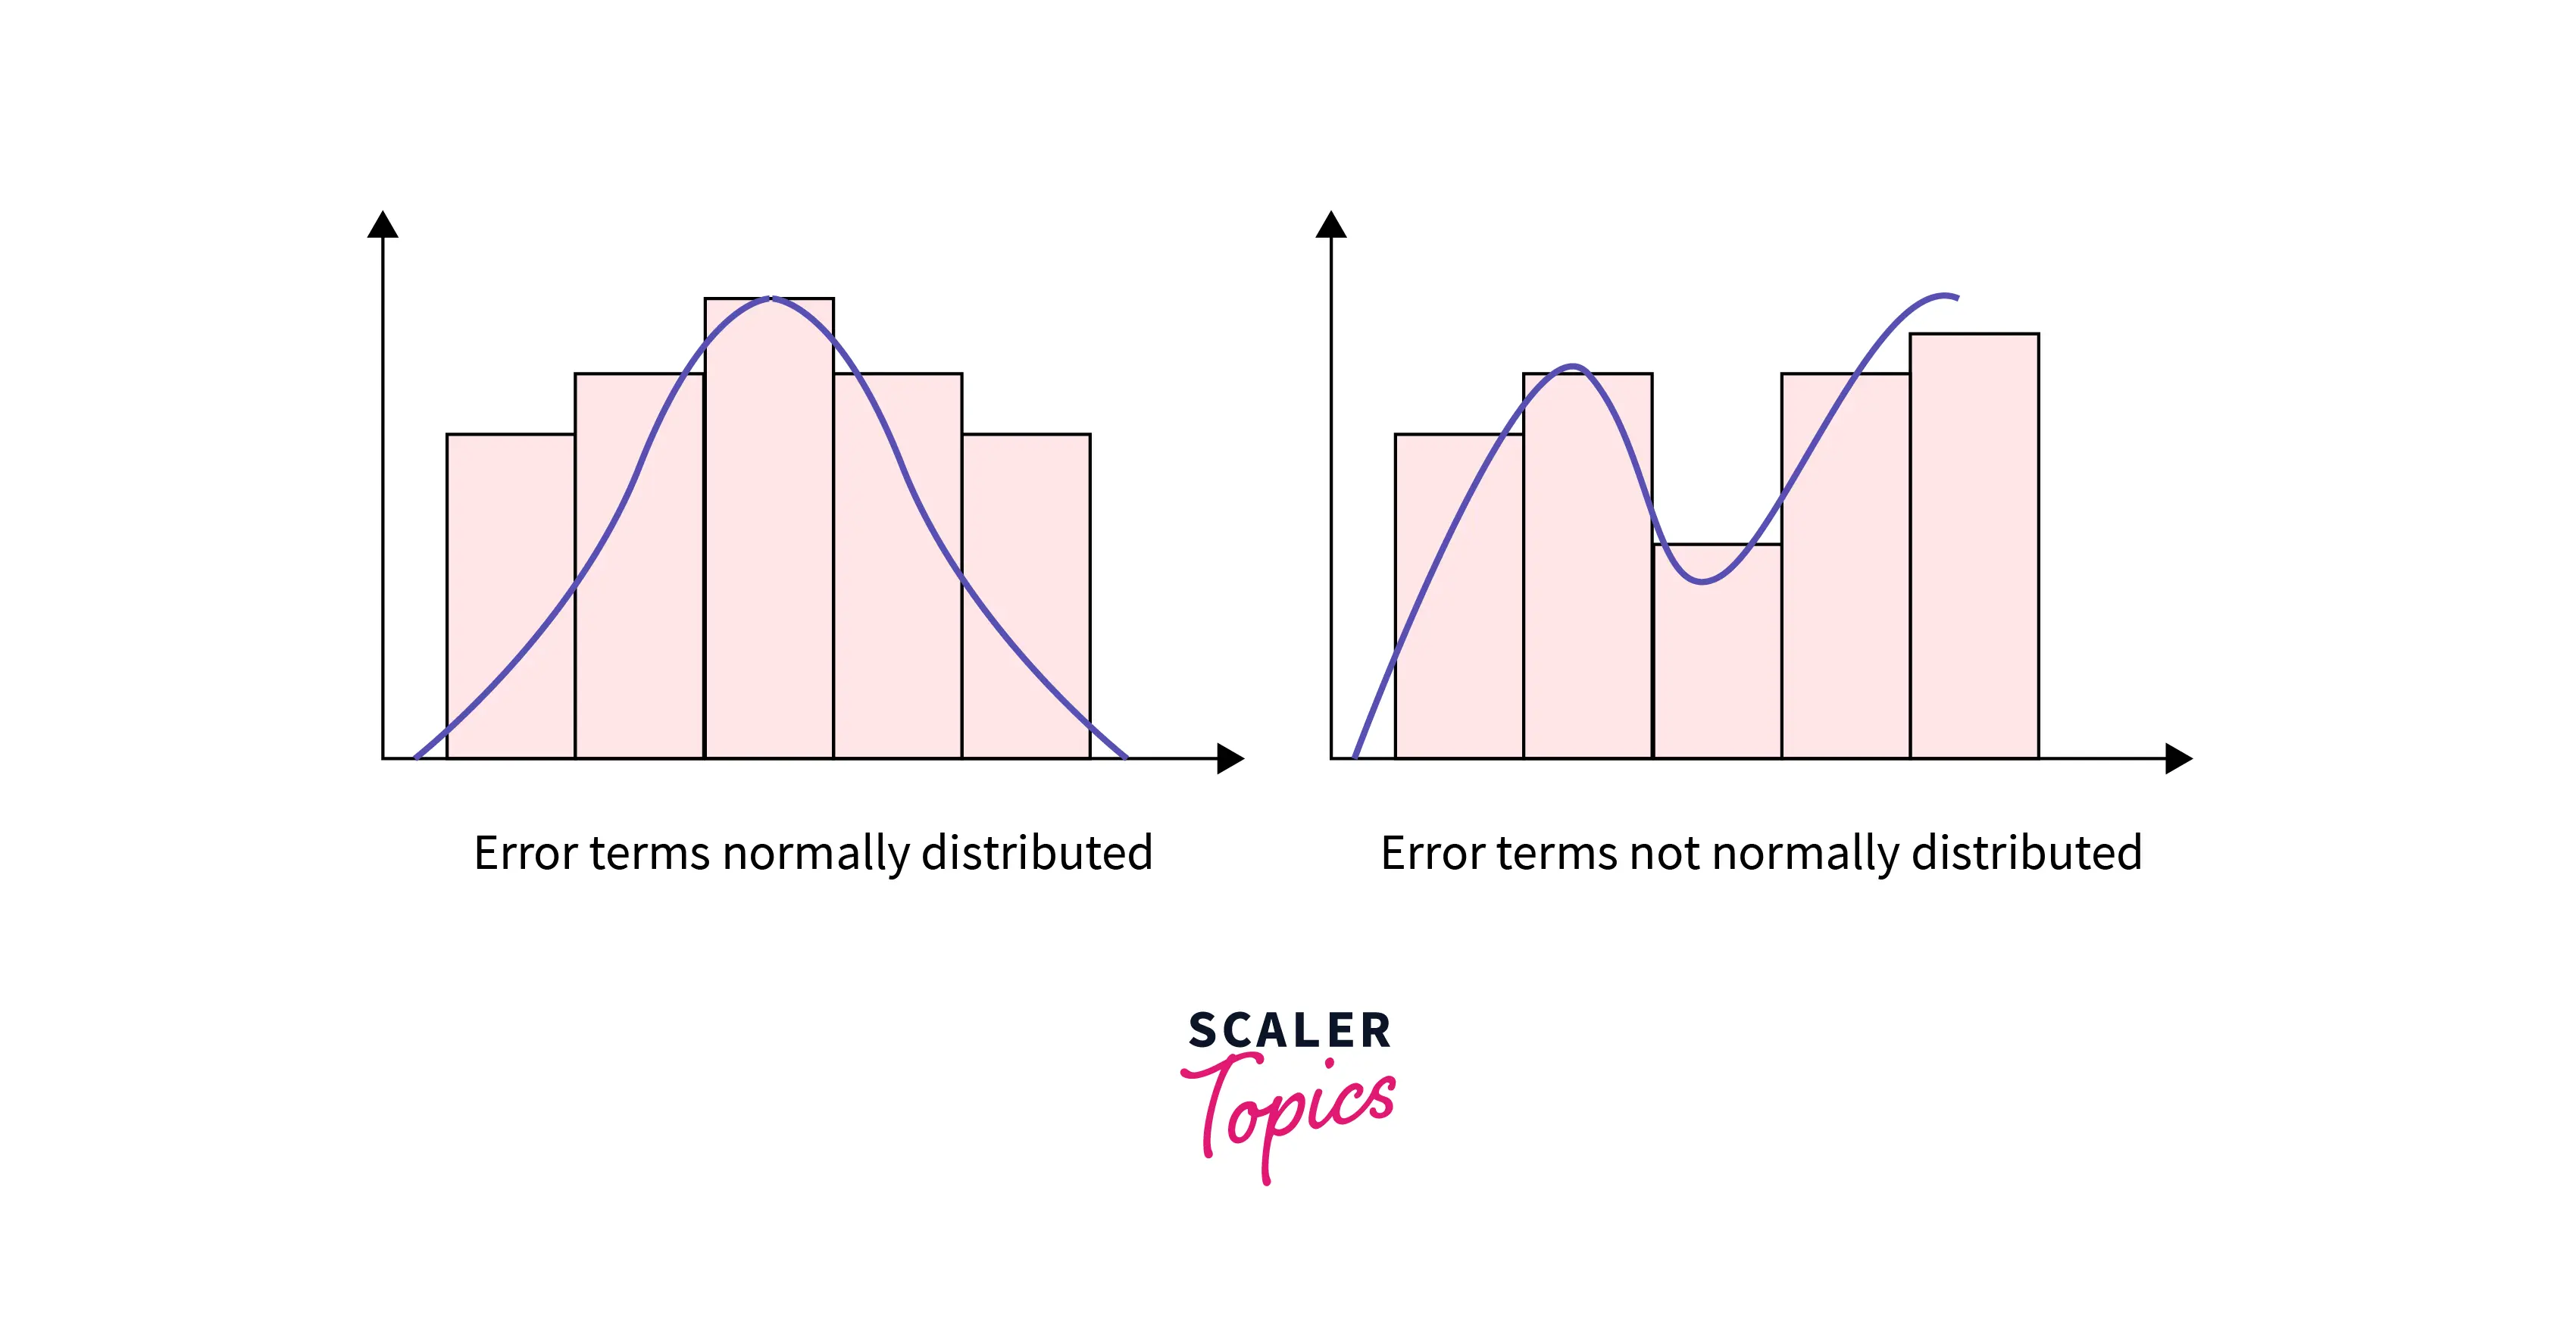
Normality
-
In this assumption, it is assumed that residuals are normally distributed. If the residuals are not normally distributed, then it implies that the model is not able to explain the relationships among the features in the data.
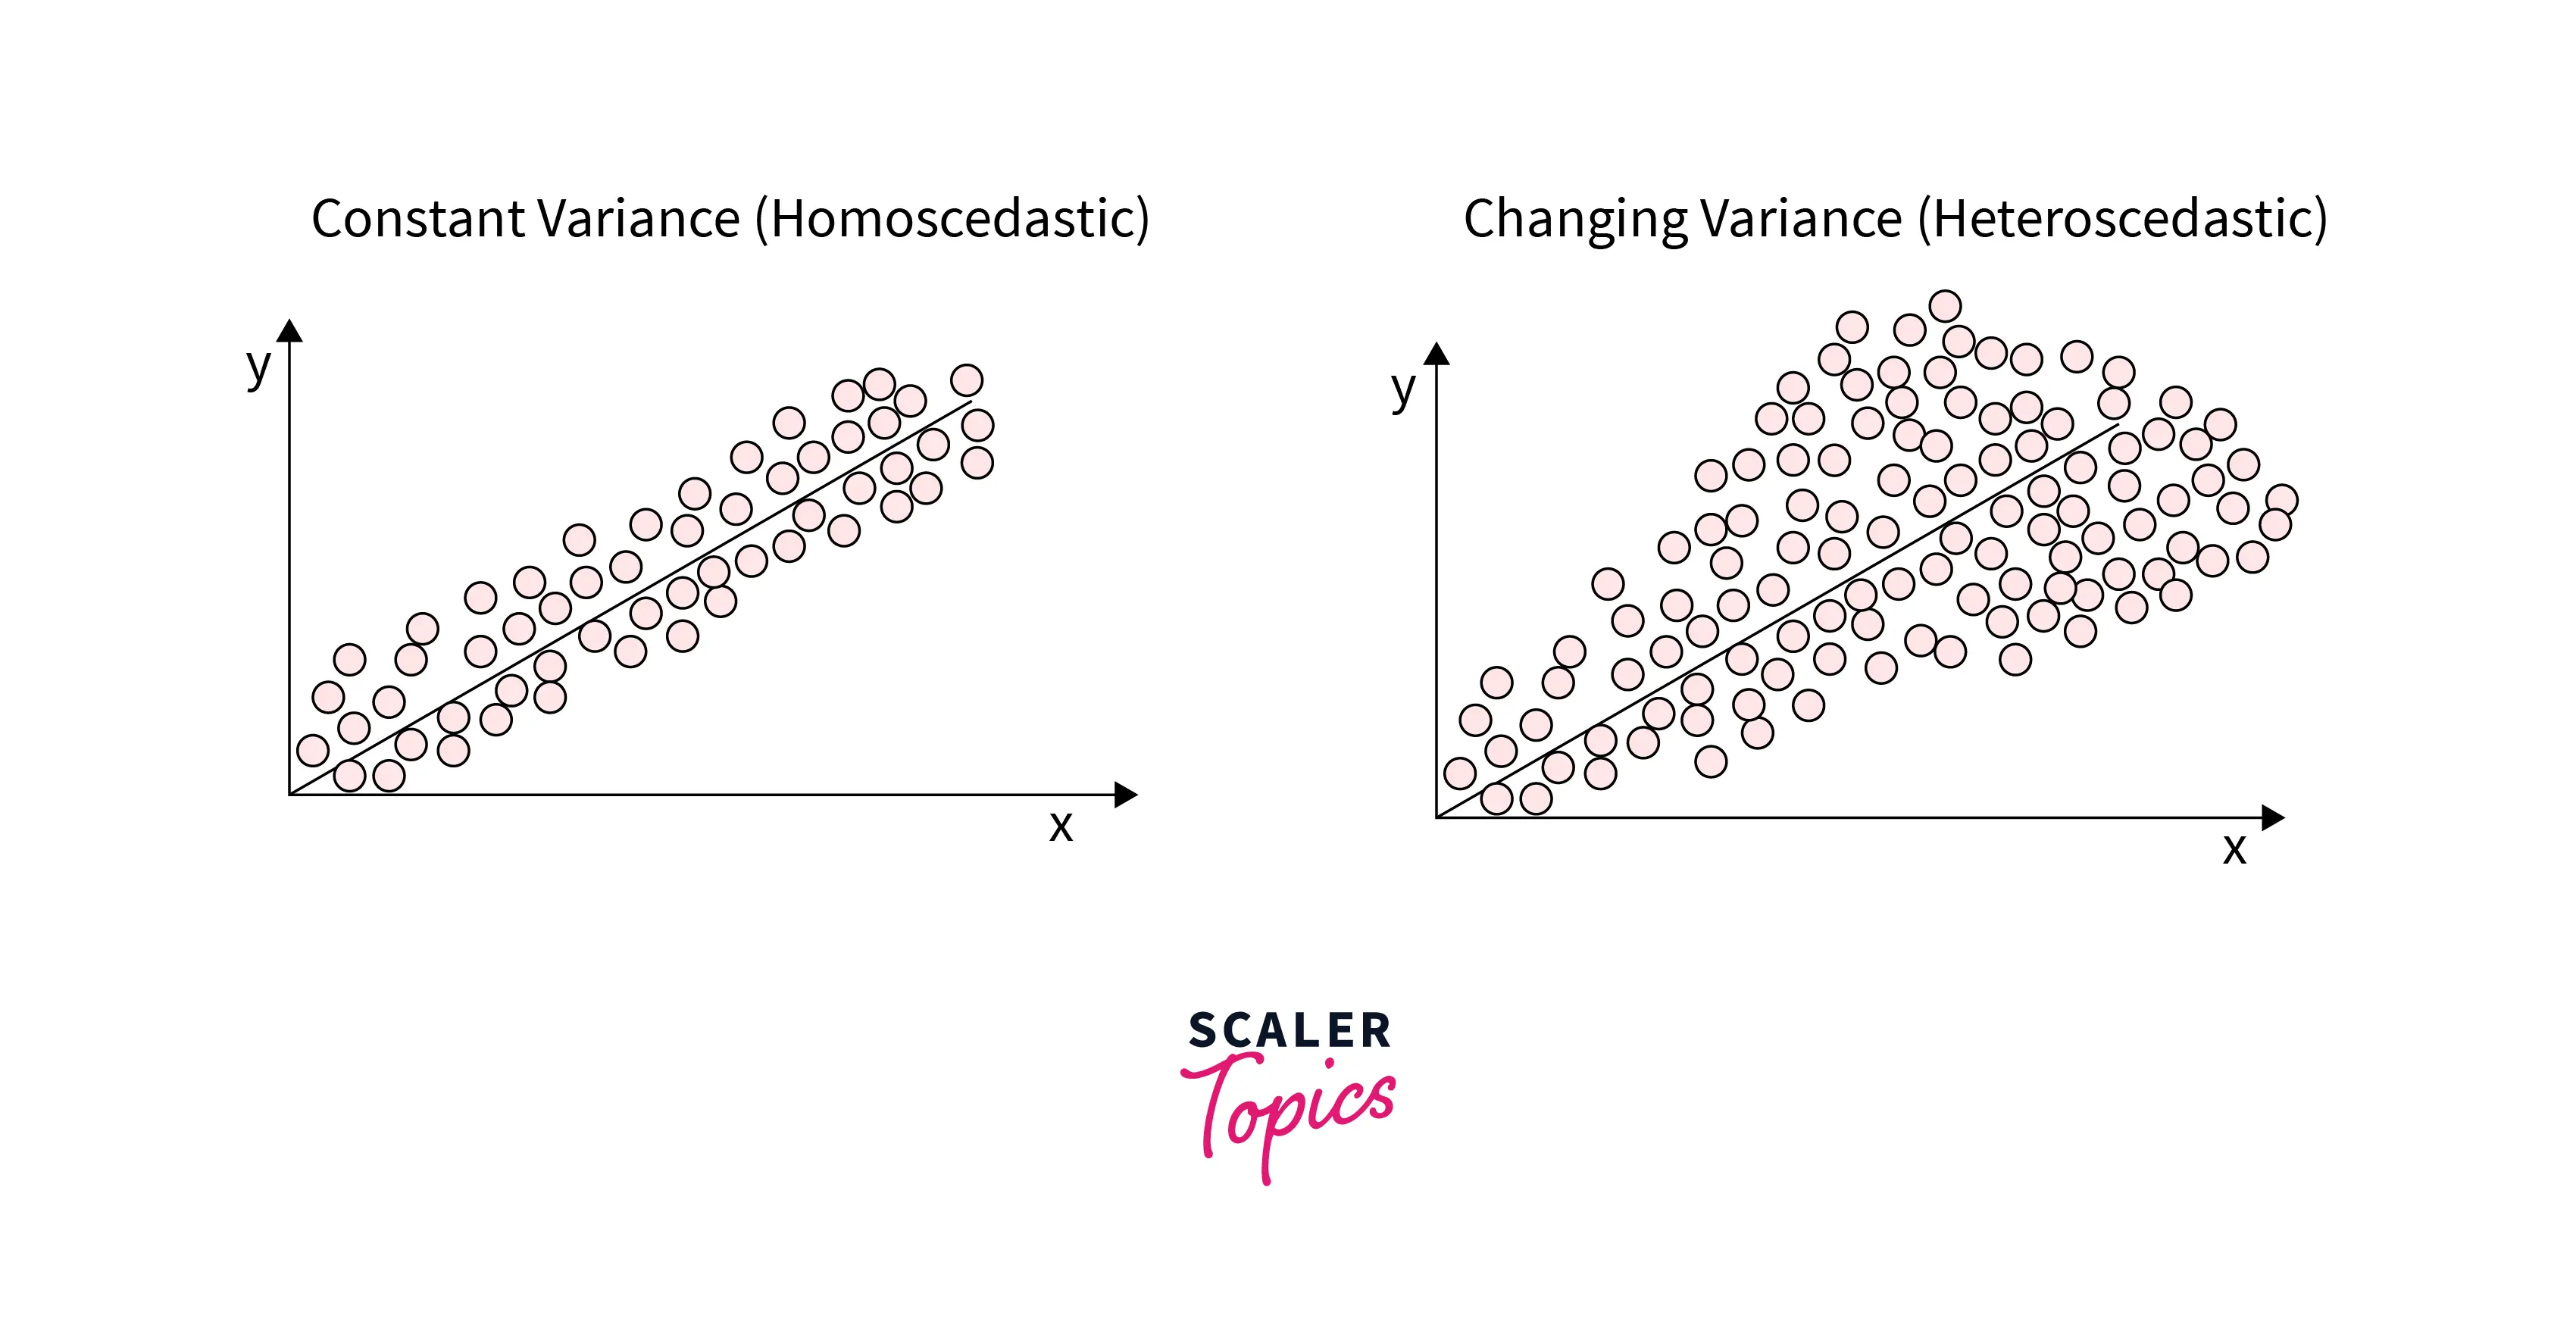
Homoscedasticity
-
It is called the constant variance assumption. In this assumption, it is assumed that the error term or residual is constant across values of the target variable. It means that it follows the same variance across the target variable’s values.
Residual Plot Analysis
- Residual plot analysis is used to assess the validity of linear regression models by plotting the residuals and checking whether the assumptions of linear regression models are met. The most important assumption of a linear regression model is that the error terms or residuals are independent and normally distributed.
- A linear regression model can be considered as a combination of deterministic and stochastic terms. Using linear equation models, we try to predict the deterministic part, and the remaining part is considered as errors or residuals. These error terms or residuals must be independent and normally distributed, i.e., stochastic. This is what we are looking for in a residual plot for a model.
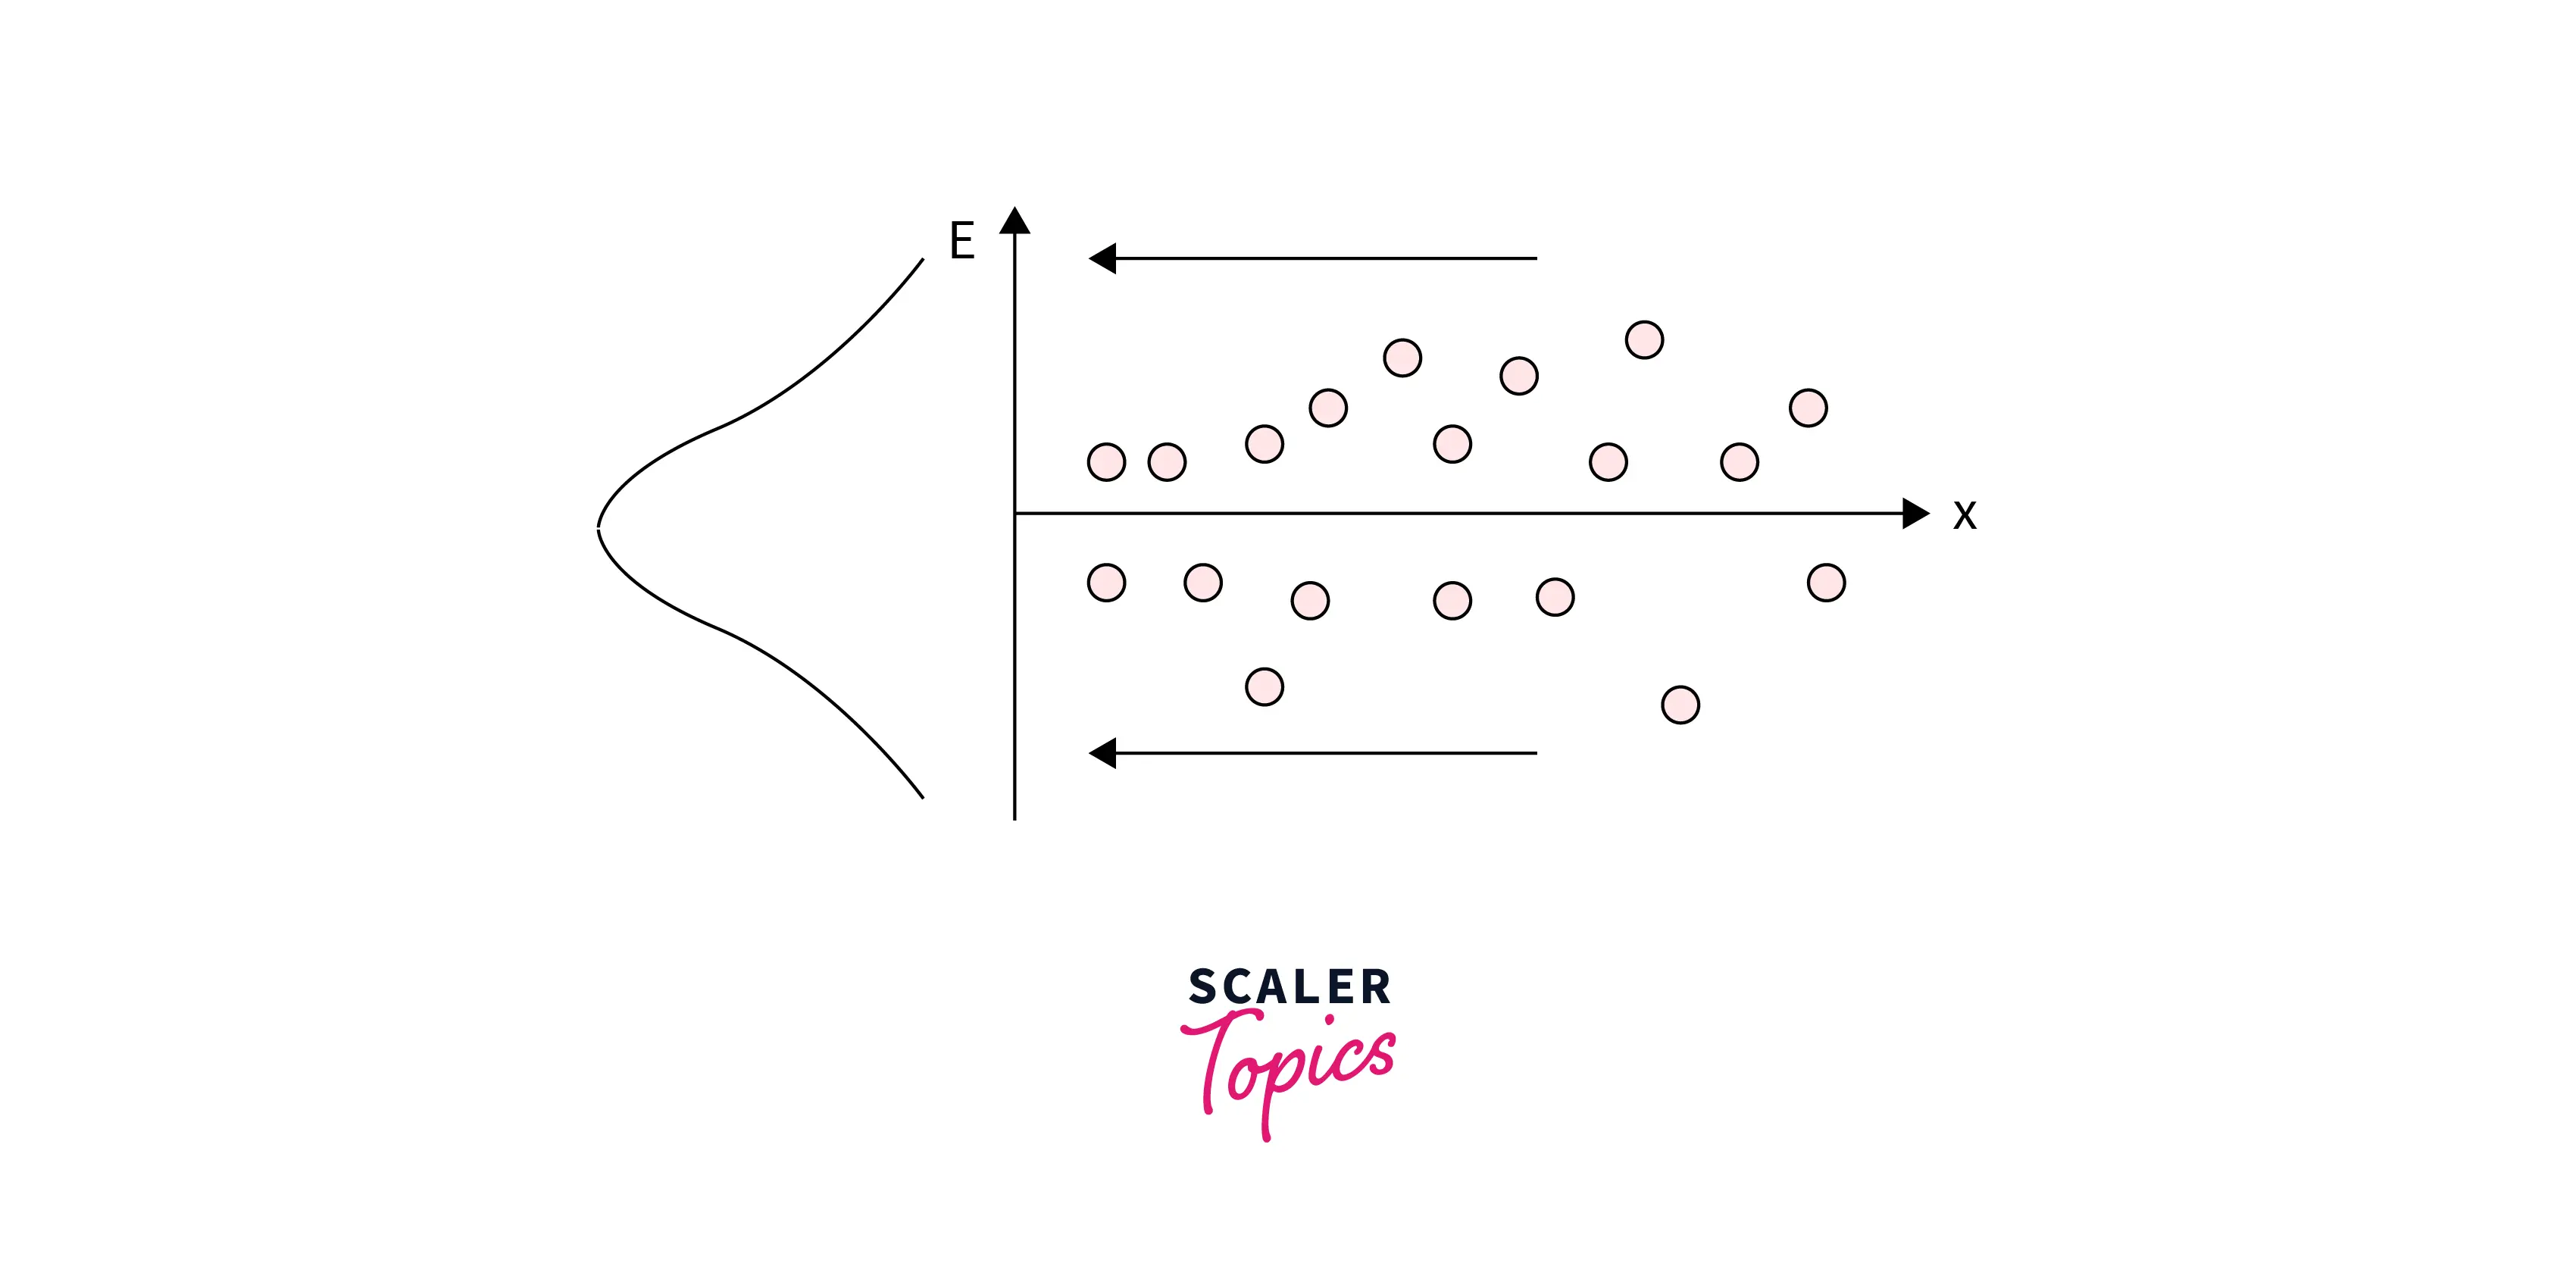
Characteristics of a Good Residual Plot
- An excellent residual plot should have below characteristics mentioned below -
- A high density of points near the X-axis, i.e., points should be more concentrated near the horizontal axis and less dense away from the horizontal axis.
- It should be symmetric around the X-axis.
- Let’s have a look at the below figure that is a good residual plot. As you can see, if residuals are projected on the vertical axis, they will follow a normal distribution. In this case, the model is considered a good fit.
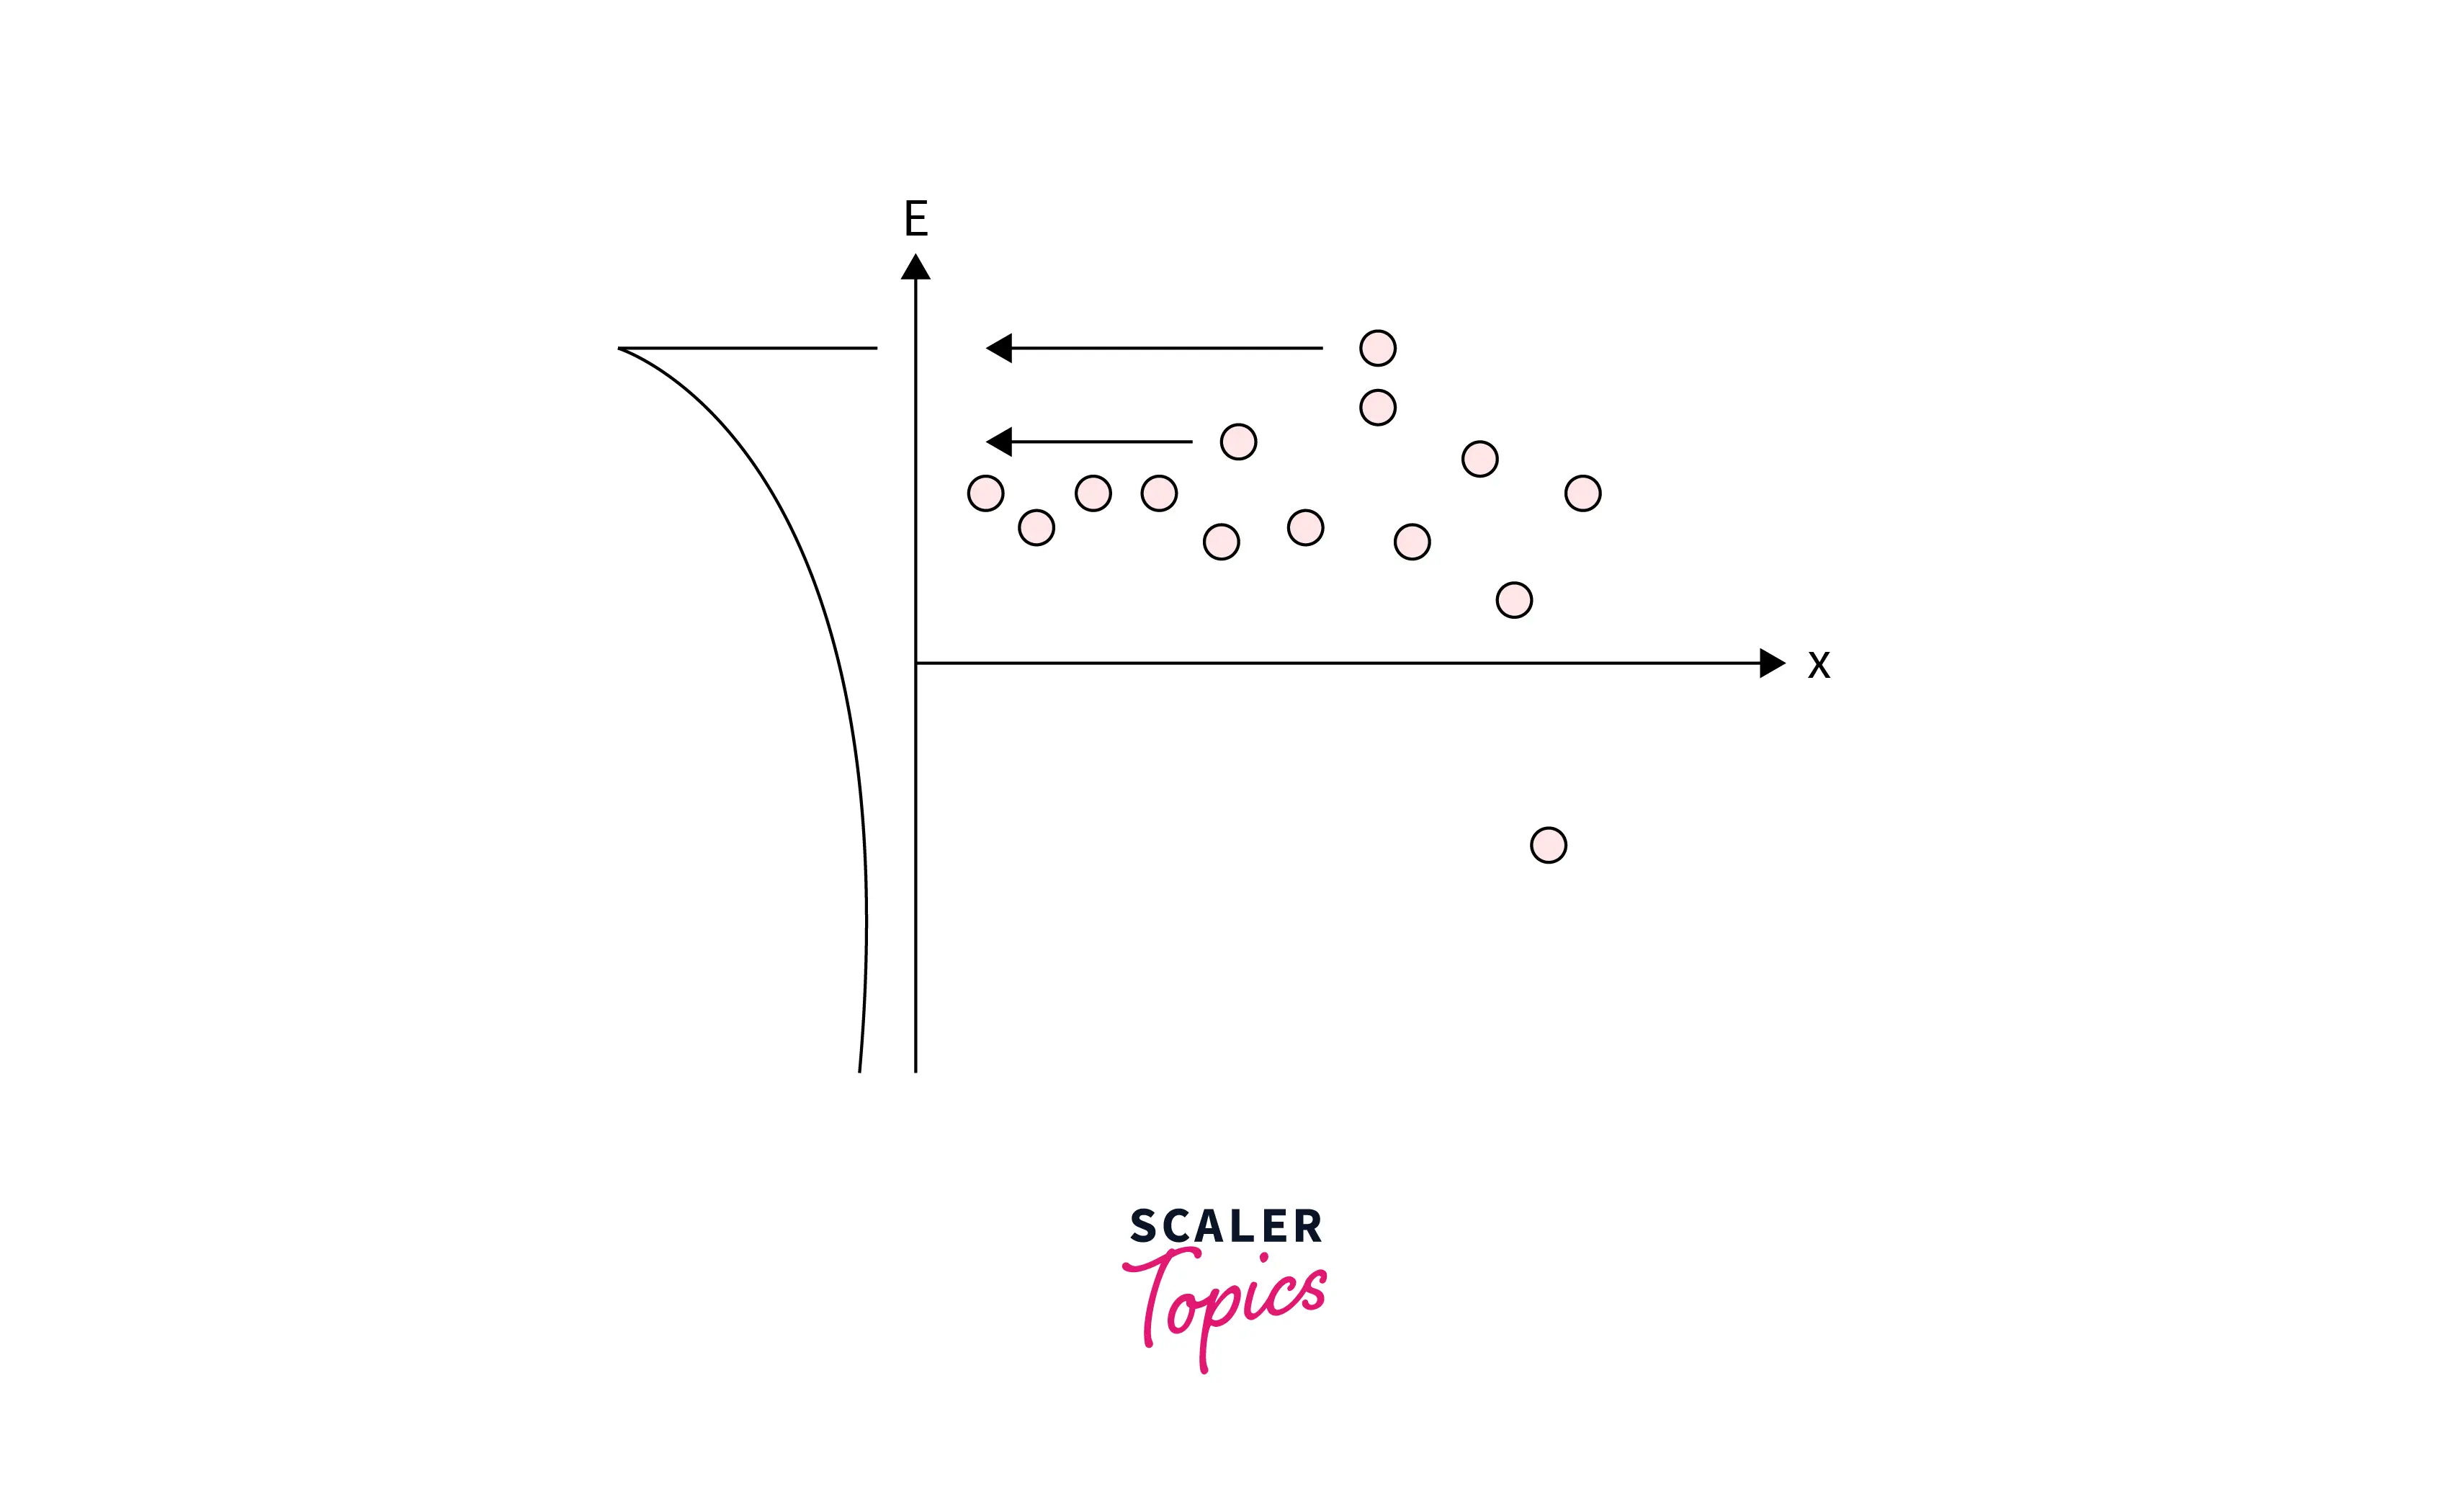
- The below figure shows a bad residual plot where error terms follow a skewed distribution. In this case, the model is not considered a good fit.
Scaler Placement Report and Statistics
Scaler learners achieved 2.5x salary growth with average post-Scaler CTC reaching ₹23L.
Supported Model Types
- Residual plot Analysis supports the evaluation of parametric linear and non-linear models by plotting the model residuals.
- Residual plot analysis is unavailable for frequency response (FRD) models.
Conclusion
- Residual plot analysis is a technique used to assess a linear regression model's validity by examining the residuals' patterns. In a residual plot, the residuals are plotted on the vertical axis, and the values of the target variable are plotted on the horizontal axis.
- The model is a good fit if the residuals are randomly distributed. If there are patterns in the residuals, then the model is not accurately capturing the relationship between the variables.
Unlock Data Science mastery with our specialized course. Enroll now!