Statistical Analysis Project

Overview
Statistical analysis uses various statistical methods to summarize, analyze, and interpret data. It involves applying statistical techniques and tools to understand patterns, relationships, and data trends and draw meaningful conclusions from them. In this article, we will apply various statistical methods, such as the measure of central tendency, the measure of dispersion, and hypothesis testing, to derive insights.
What are We Building?
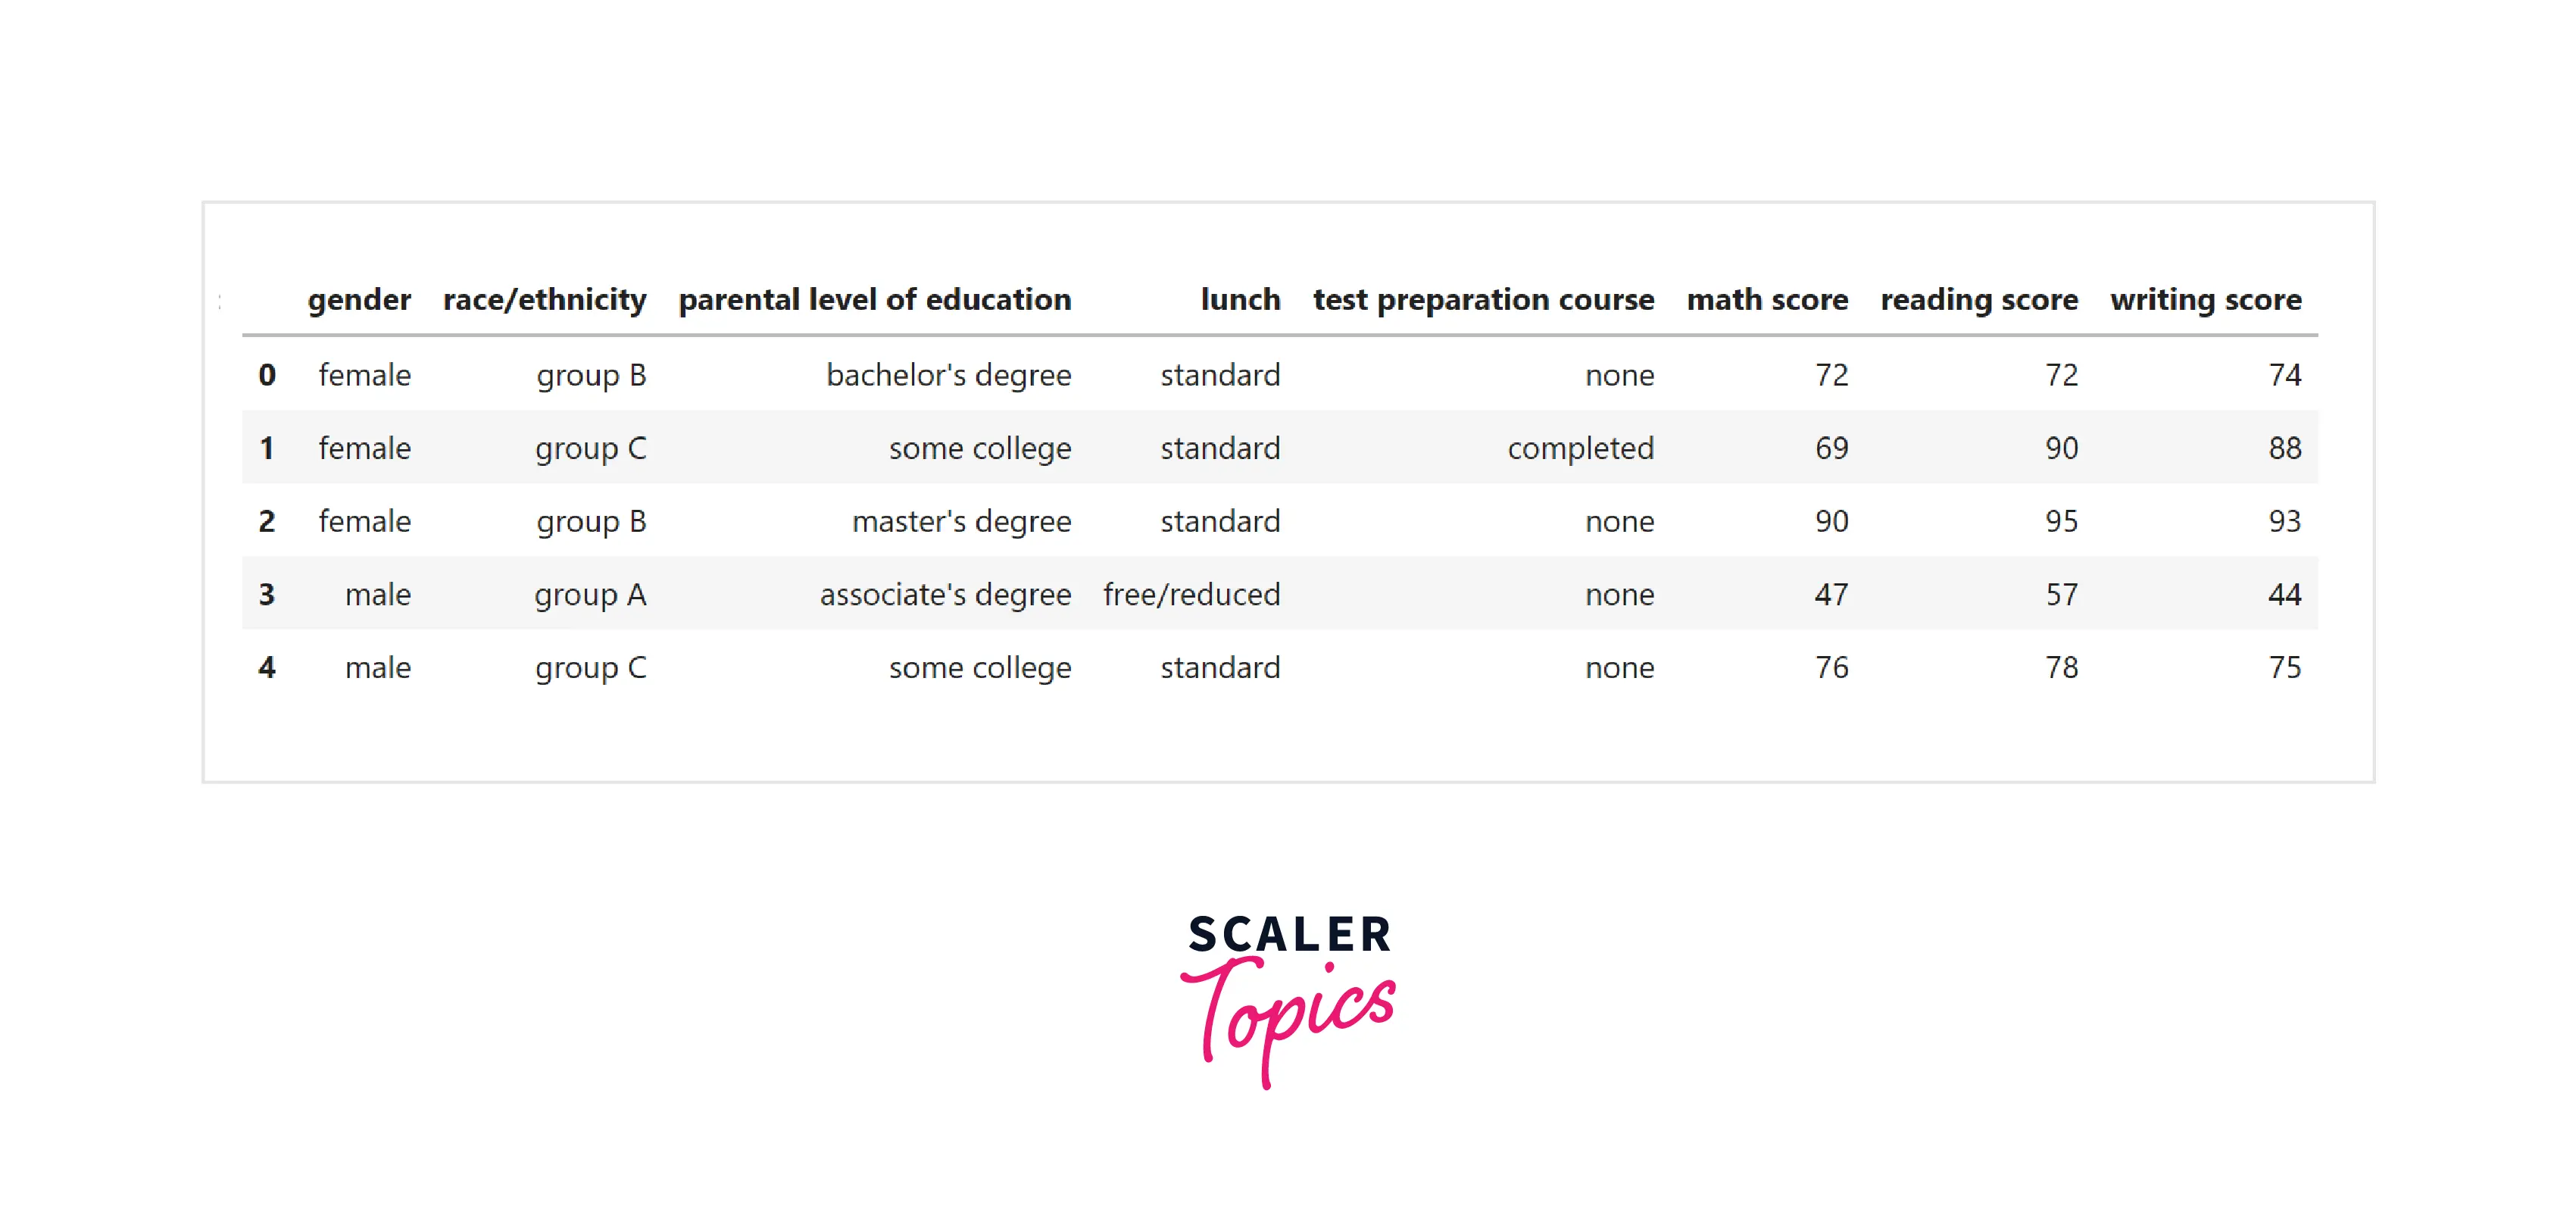
In this project, we will use the student performance dataset containing the details of students' performance. You can download the dataset from here. It consists of details of 1000 students, such as gender, parents' education, race/ethnicity, math scores, reading and writing scores, etc. We will perform statistical analysis on this data to identify underlying patterns and derive insights.
Pre-Requisites
- Python
- Descriptive Statistics
- Inferential Statistics
- Hypothesis Testing
Transform Your Career
Choose from our industry-leading programs designed for career success
Modern Software and AI Engineering Program
Master full-stack development with AI integration

Modern Data Science and ML with specialisation in AI
Advanced data science techniques with AI specialization
Advanced AIML with Specialisation in Agentic AI
Deep dive into AIML with focus on Agentic systems
DevOps, Cloud & AI Platform Engineering
Build and manage AI-powered cloud infrastructure
AI Engineering Advanced Certification by IIT-Roorkee
Premier AI engineering certification from IIT-Roorkee
How Are We Going to Build This?
- We will load the dataset and will explore it using measures of central tendency (mean) and measures of dispersion (standard deviation).
- Further, we will perform hypothesis testing on the dataset. In this step, we will define multiple hypotheses and validate them using various techniques.
Requirements
We will be using below libraries, tools, and modules in this project -
- Pandas
- Numpy
- Matplotlib
- Seaborn
- Scipy
Dataset Feature Descriptions
The description for the features present in this dataset is -
- gender - The gender of the student.
- race/ethnicity - describing the race or ethnicity of the students.
- parental level of education - education status of parents
- lunch - category of student’s lunch
- test preparation course - whether the student completed any preparation course or not.
- score - scores in math, reading, and writing
Turn Learning into Career Growth
Doing the Statistical Analysis
Import Libraries and Loading Dataset
Let’s start the project by importing all necessary libraries for statistical analysis and loading the dataset.
- Let’s explore the data types of each variable and count missing or NULL values in the dataset.
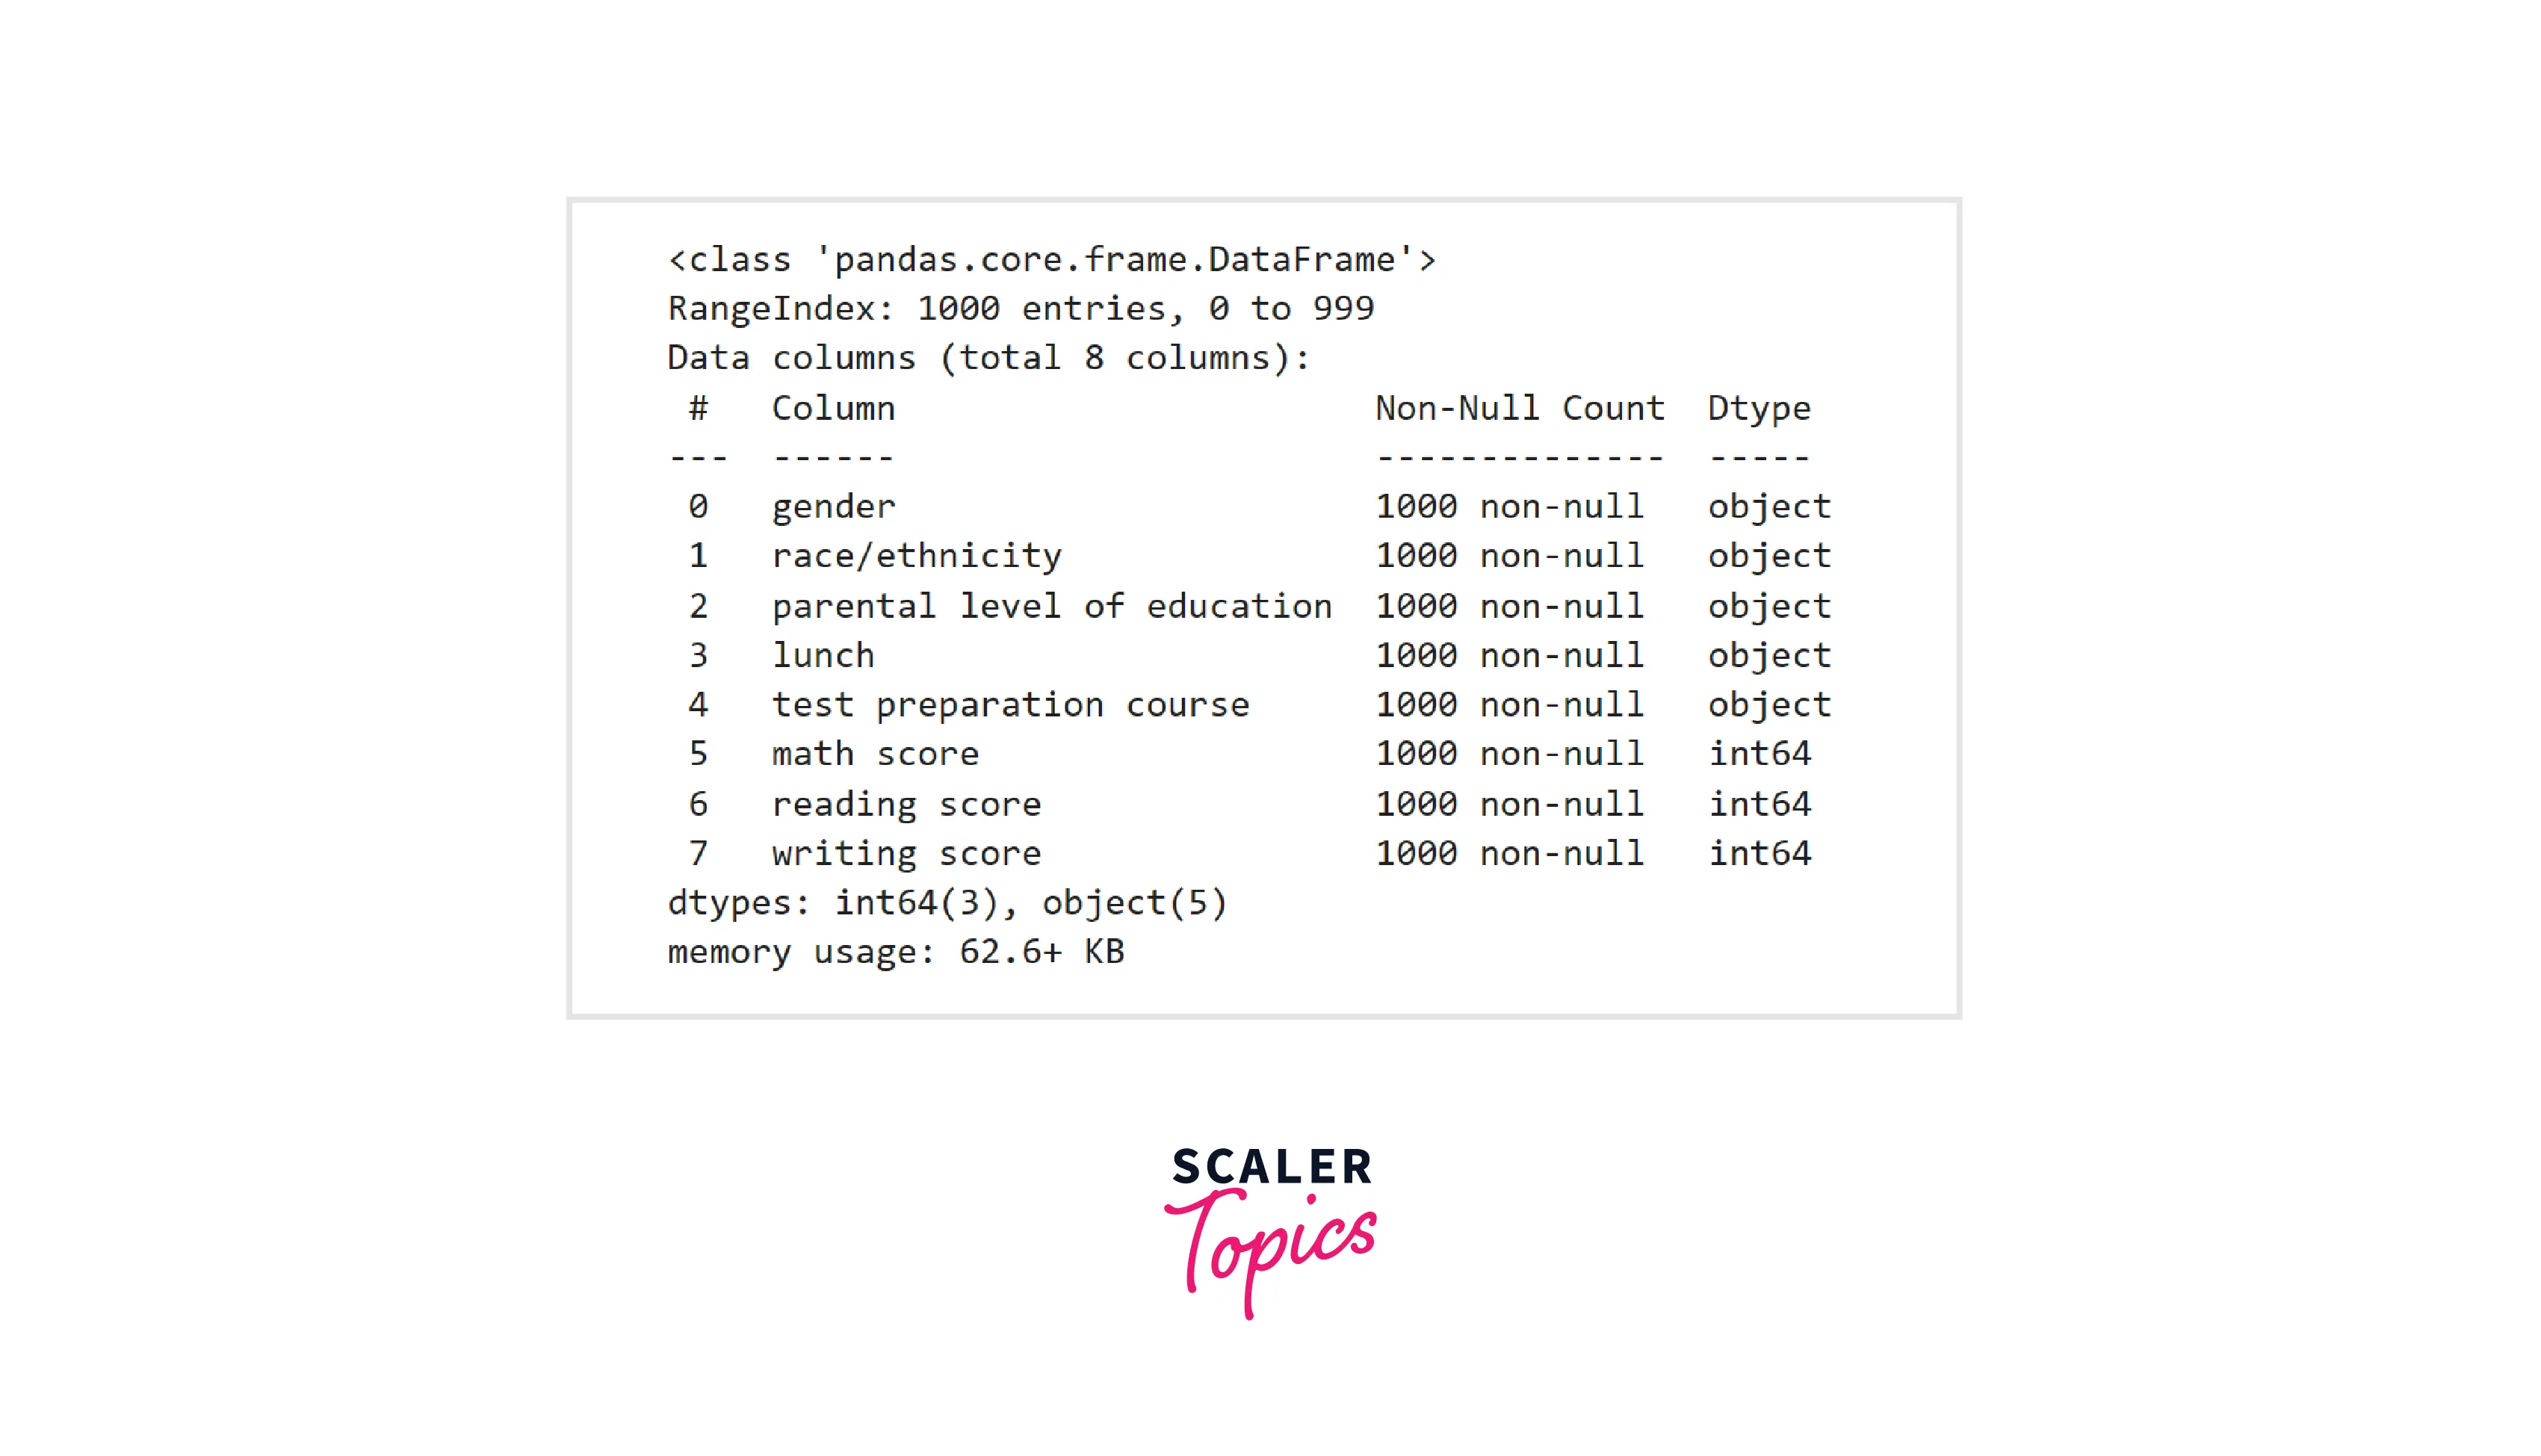
- As we can see, this dataset has a mix of categorical and numerical features. Also, none of the features contain missing or NULL values.
Measure of Central Tendency and Dispersion
- In this step, we will analyze numerical features by using measures of central tendency (mean) and dispersion (standard deviation). We will use the describe function provided by Pandas in Python.
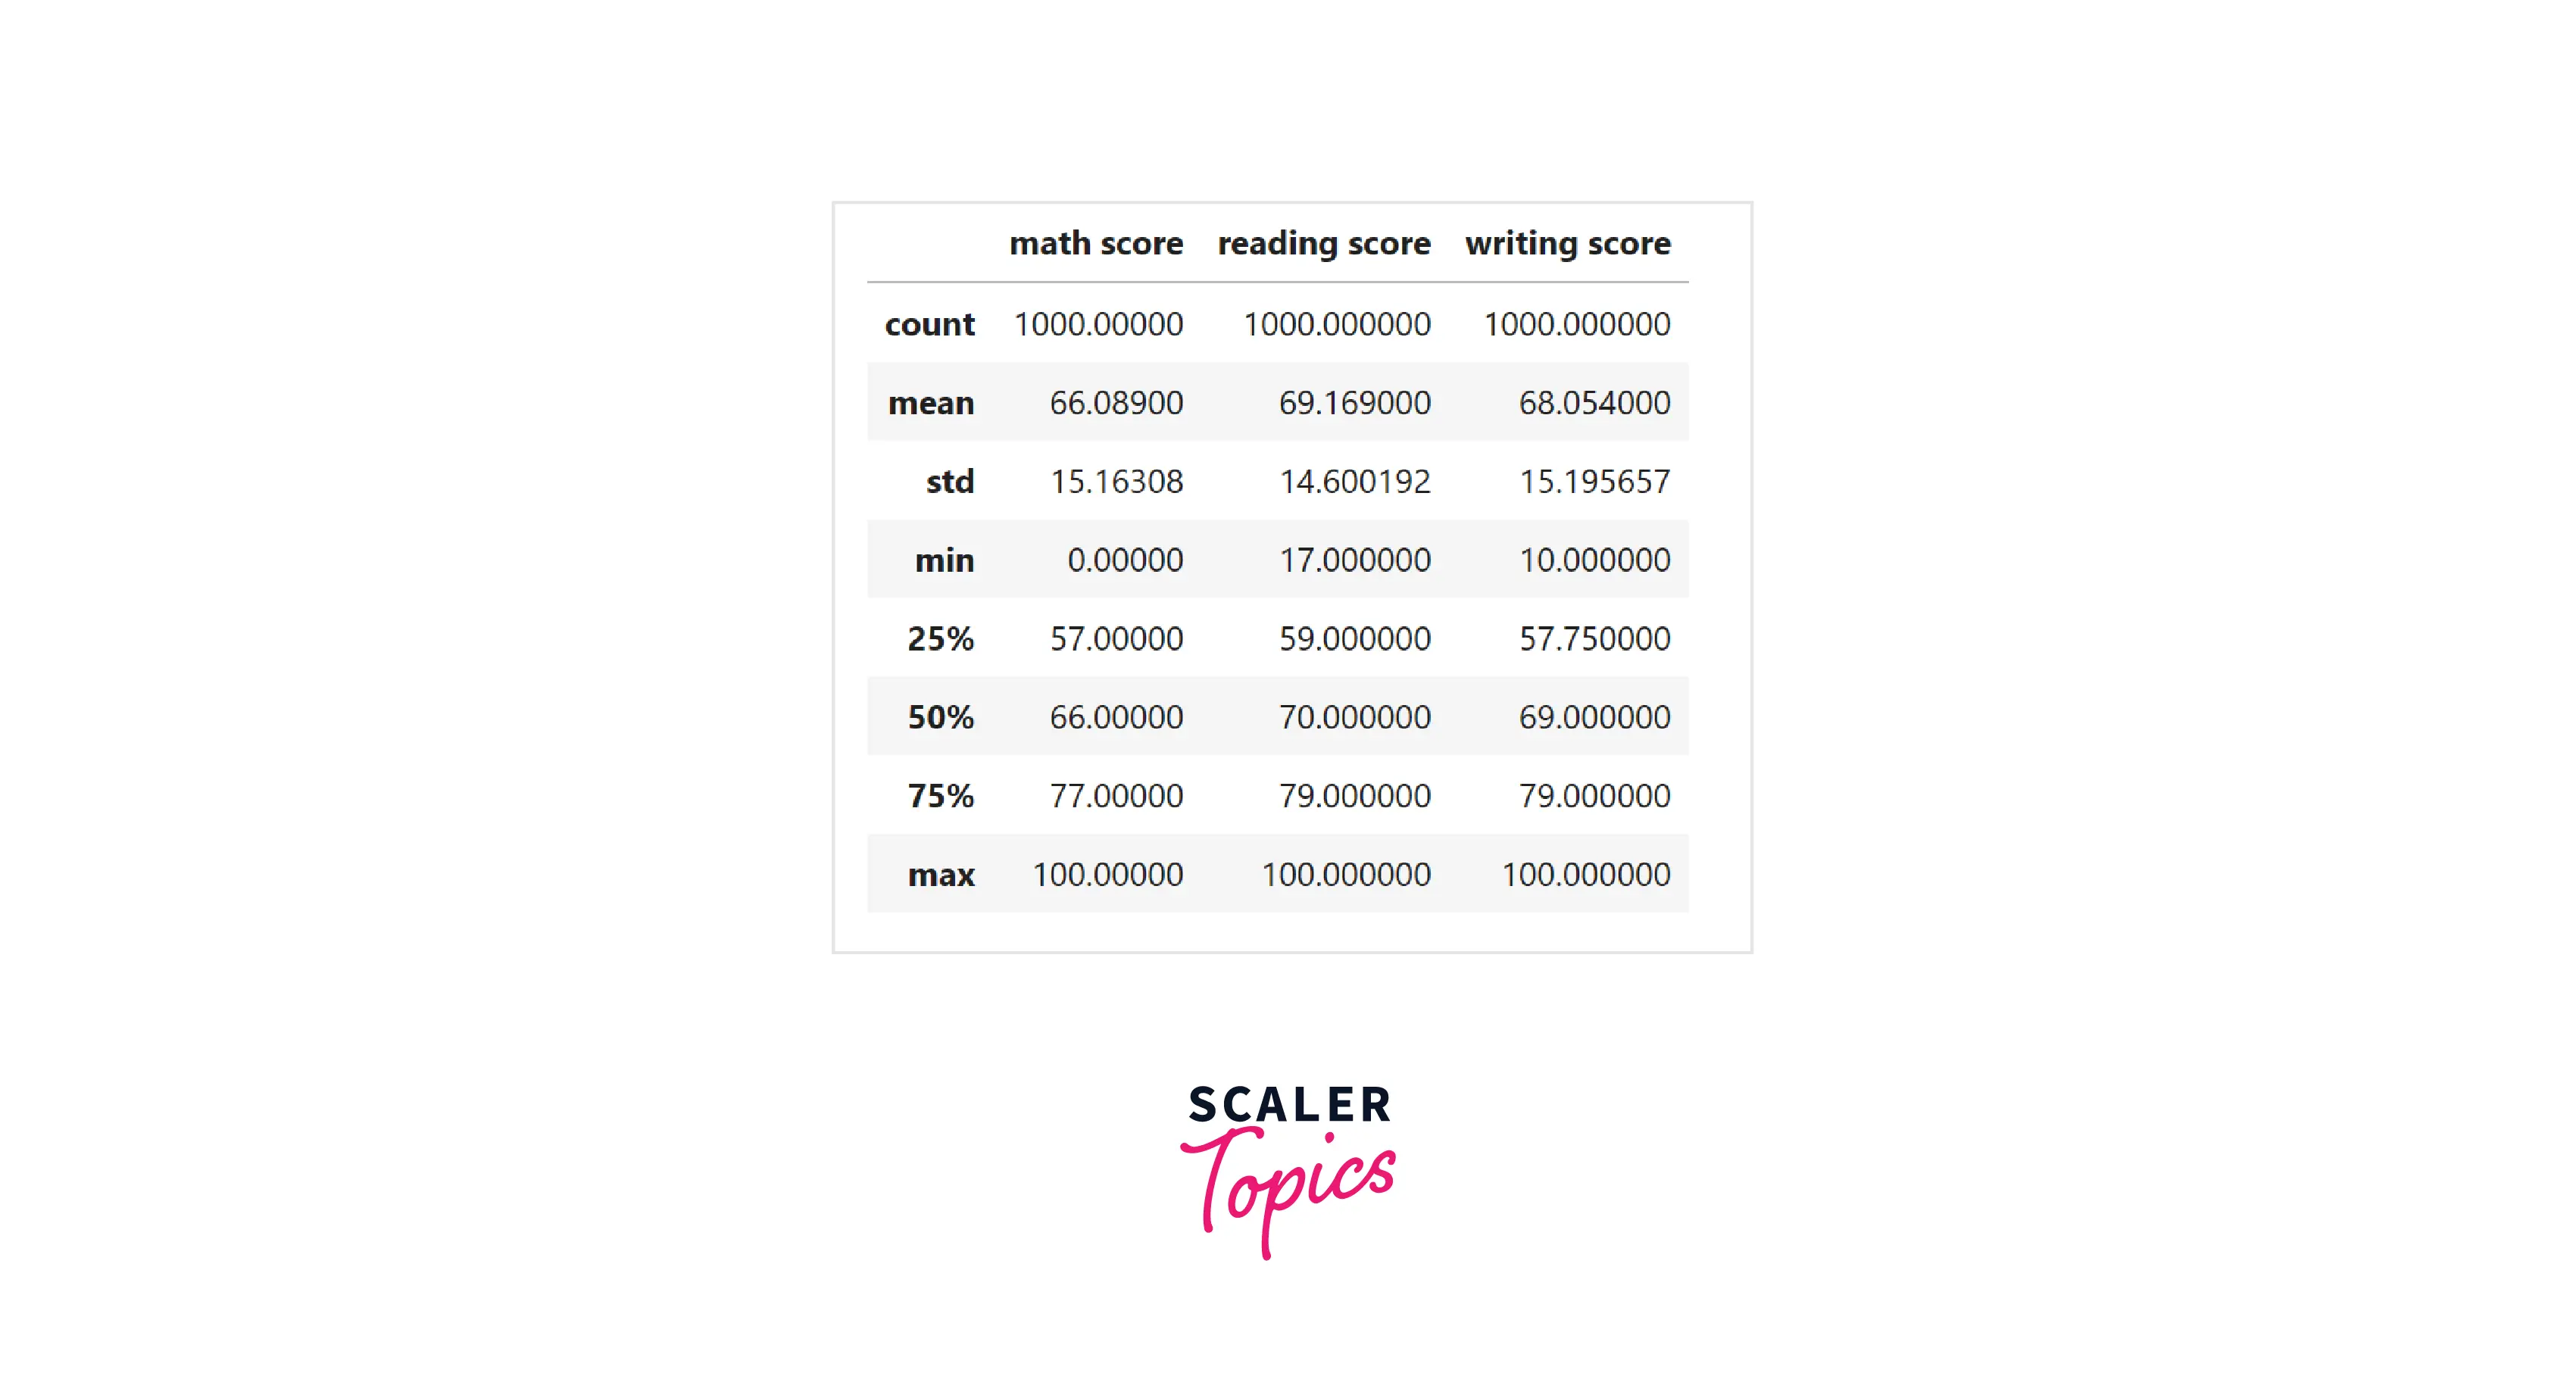
- Insights from the above figure -
- The average score is highest in reading and it is lowest in math.
- The dispersion of values is highest in writing and lowest in reading.
- Overall, there is no major difference in mean and standard deviation among features.
Hypothesis Testing
- Hypothesis testing is a statistical method used to test whether a hypothesis about a population or sample is true or false. In hypothesis testing, we start with a null hypothesis. The null hypothesis generally states that there is no significant difference between the population parameter and a hypothesized value or between two variables/samples.
- In this step, we will test four different kinds of hypotheses using various techniques. In this entire analysis, our significance level is set to 0.05. It means that if, for a given hypothesis, the p-value is less than 0.05, then only we can reject the null hypothesis.
- Hypothesis 1 - There is no significant difference between a student's performance in any skills - reading, writing, or math. Let’s define our null and alternative hypotheses -
- Ho (NULL hypothesis) - There is no difference in the performance of students between math, reading, and writing skills.
- Ha (Alternative hypothesis) - There is a difference in the performance of students between math, reading, and writing skills.
- We will use a one-way ANOVA test to validate this hypothesis. First, compare the histogram of each variable.
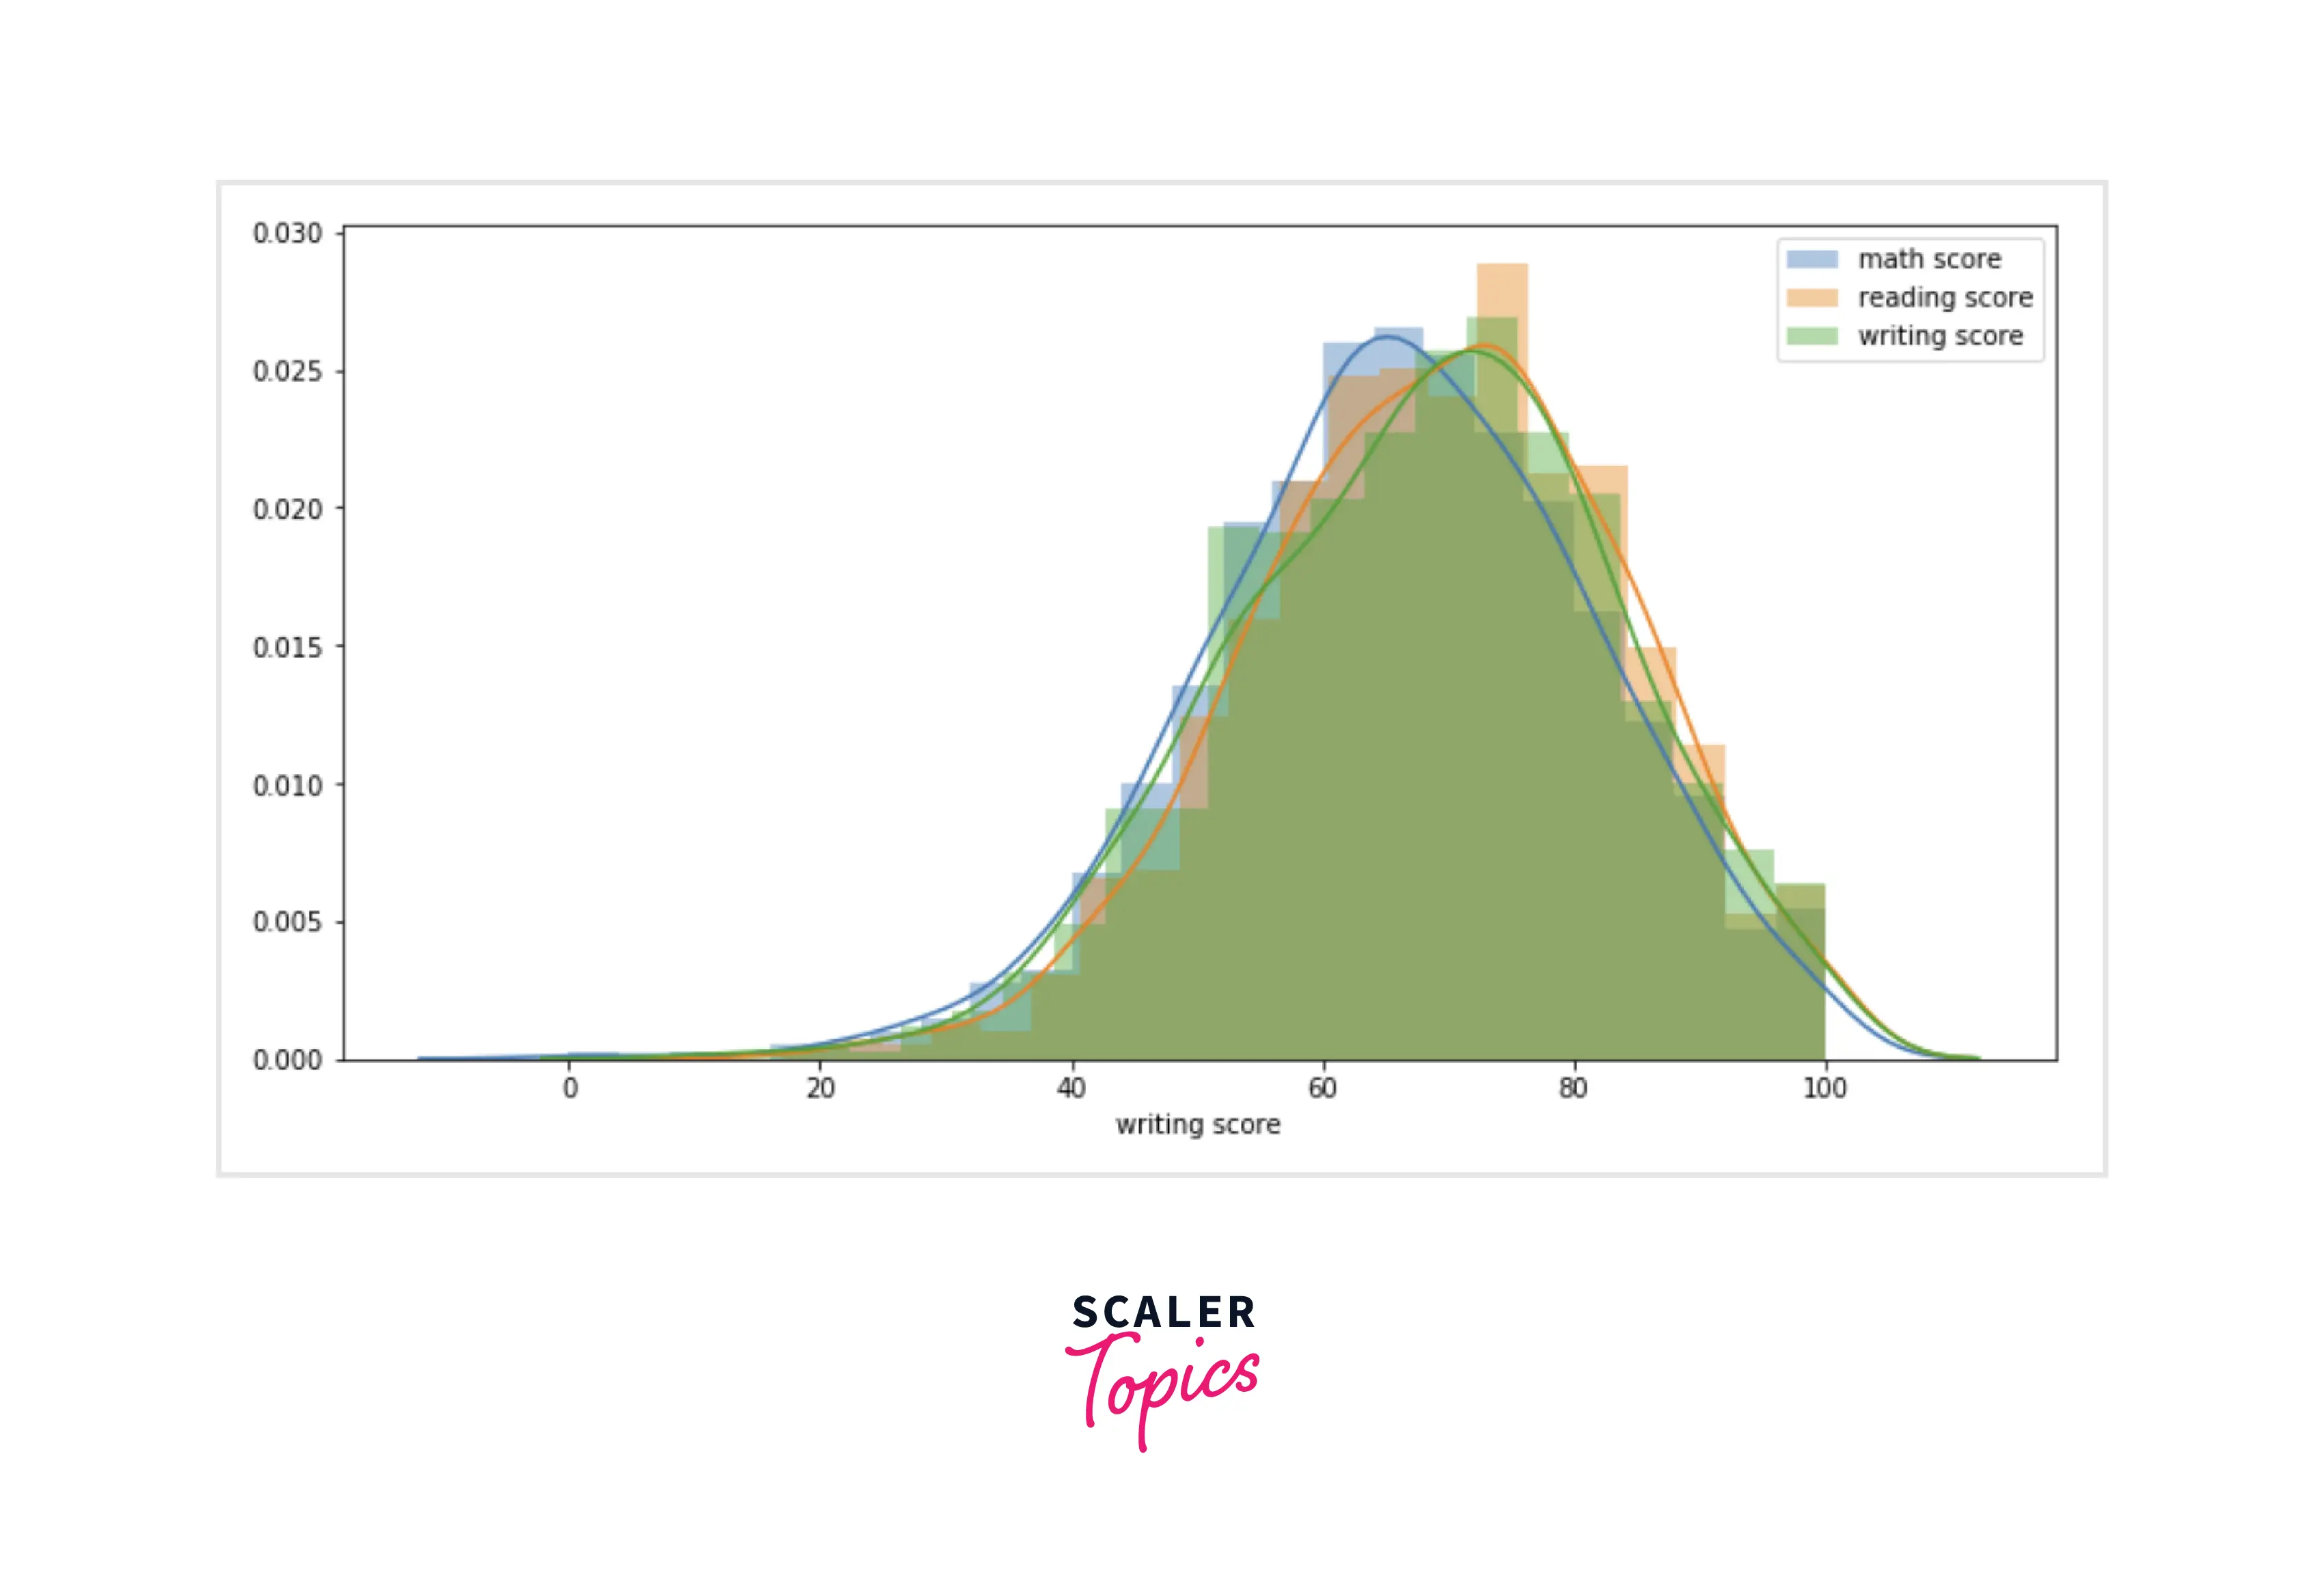
- As we can see, it seems that all three samples have the same population mean, and it seems there is no significant difference between them at all. Let’s apply a one-way ANOVA test on these variables.
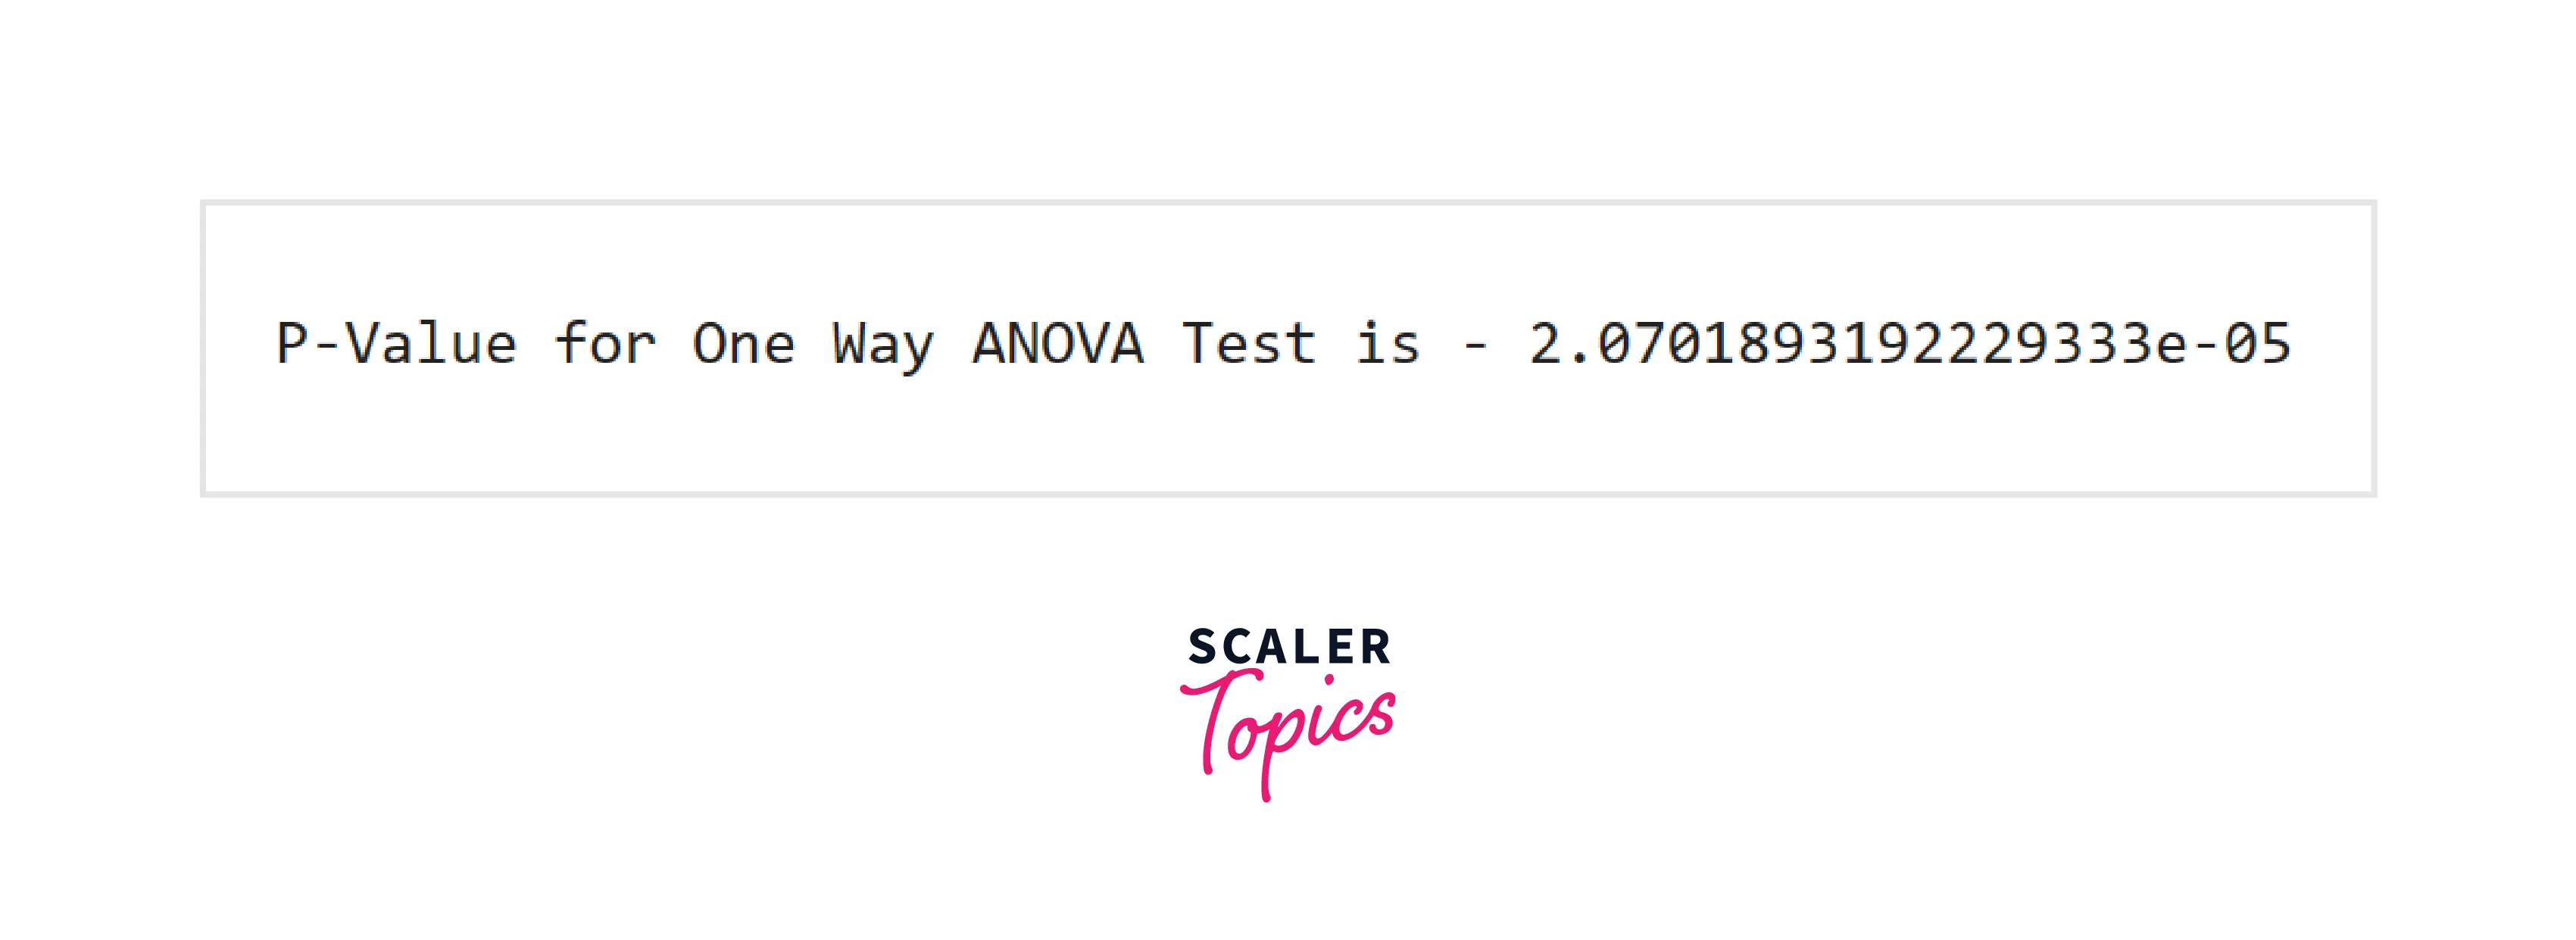
- Observed p-value in our hypothesis is 0.00207, which is very lower than the significance level. It means that there is a difference between the scores of each skill, and we can reject our null hypothesis. If the null hypothesis in the ANOVA test is rejected, then we conclude that at least one of the population means is different. However, it doesn’t give us an insight into which means are different.
- Hypothesis 2 - There is no relation between the gender of a student and their corresponding academic performance. Let’s define our null and alternative hypothesis -
- Ho (NULL hypothesis) - There is no relation between the gender of a student and their corresponding academic performance.
- Ha (Alternative hypothesis) - There is a relation between the gender of a student and their corresponding academic performance.
- We will create a new feature representing whether a student failed or passed. We will take the average of all three scores, and if the score is above 40, then we will consider the student as passed. As these are categorical variables, we will use the chi-square test of independence to test the significance between these two variables.
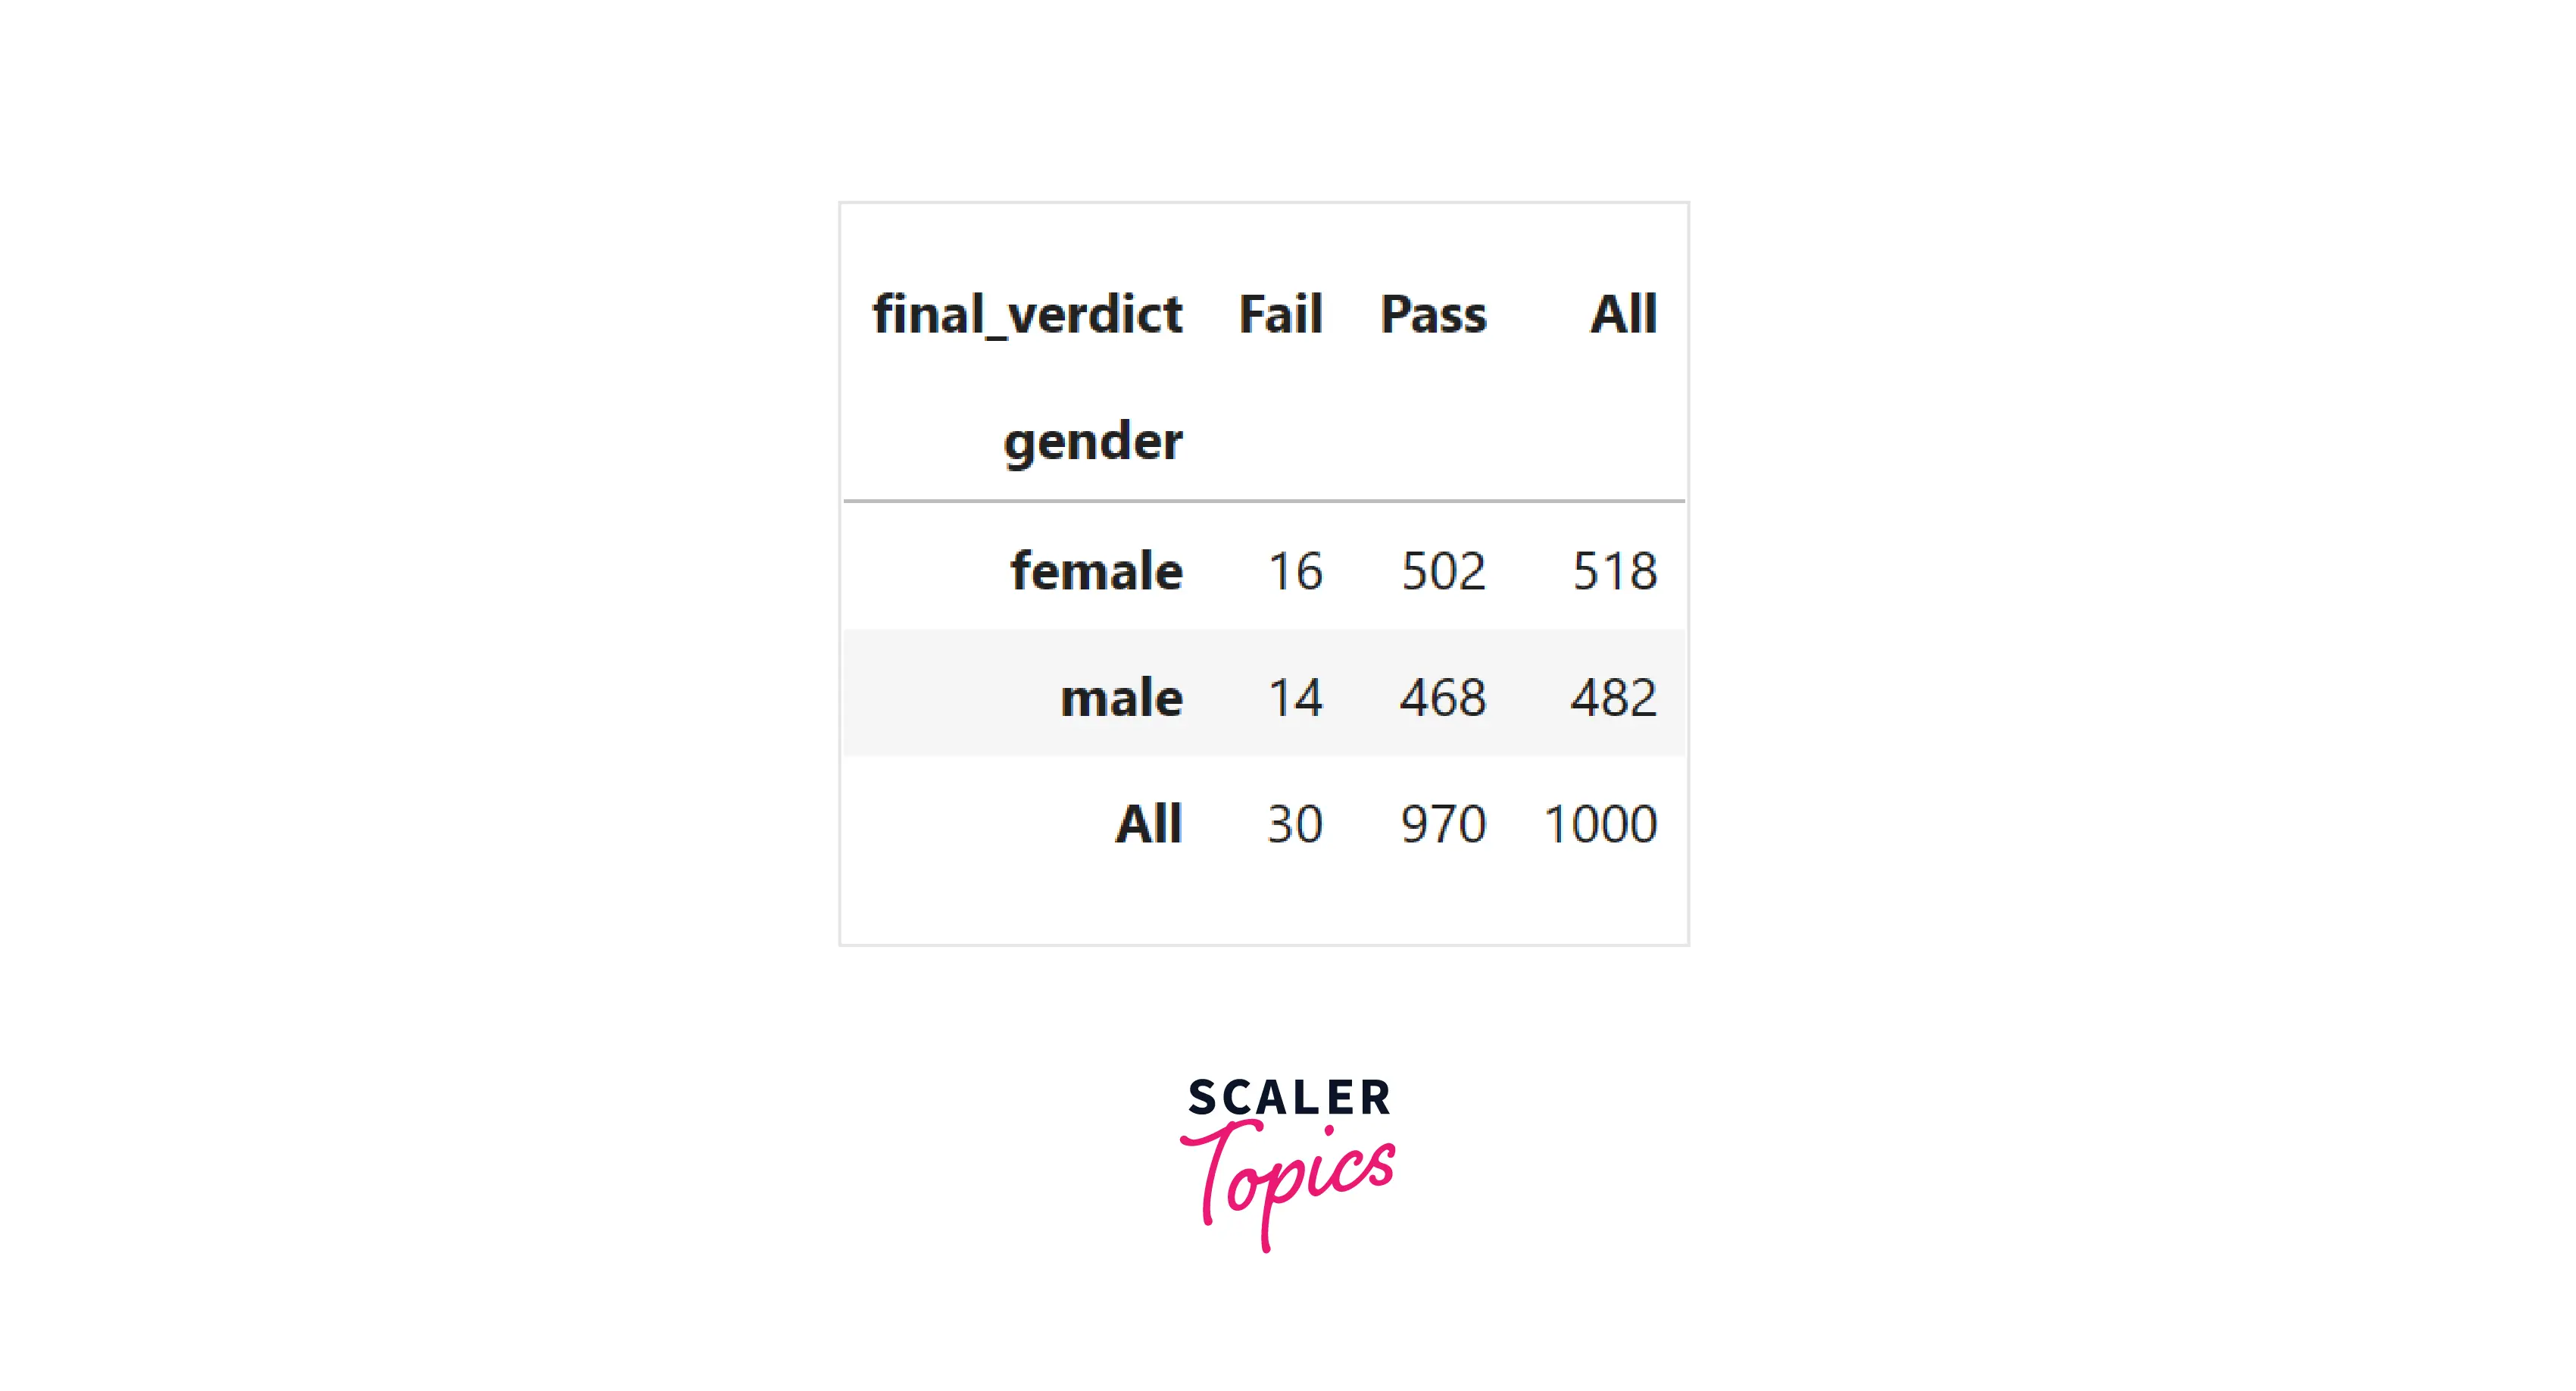
- From this table, we can extract data for female students and male students and will use them to perform a chi-square test of independence.
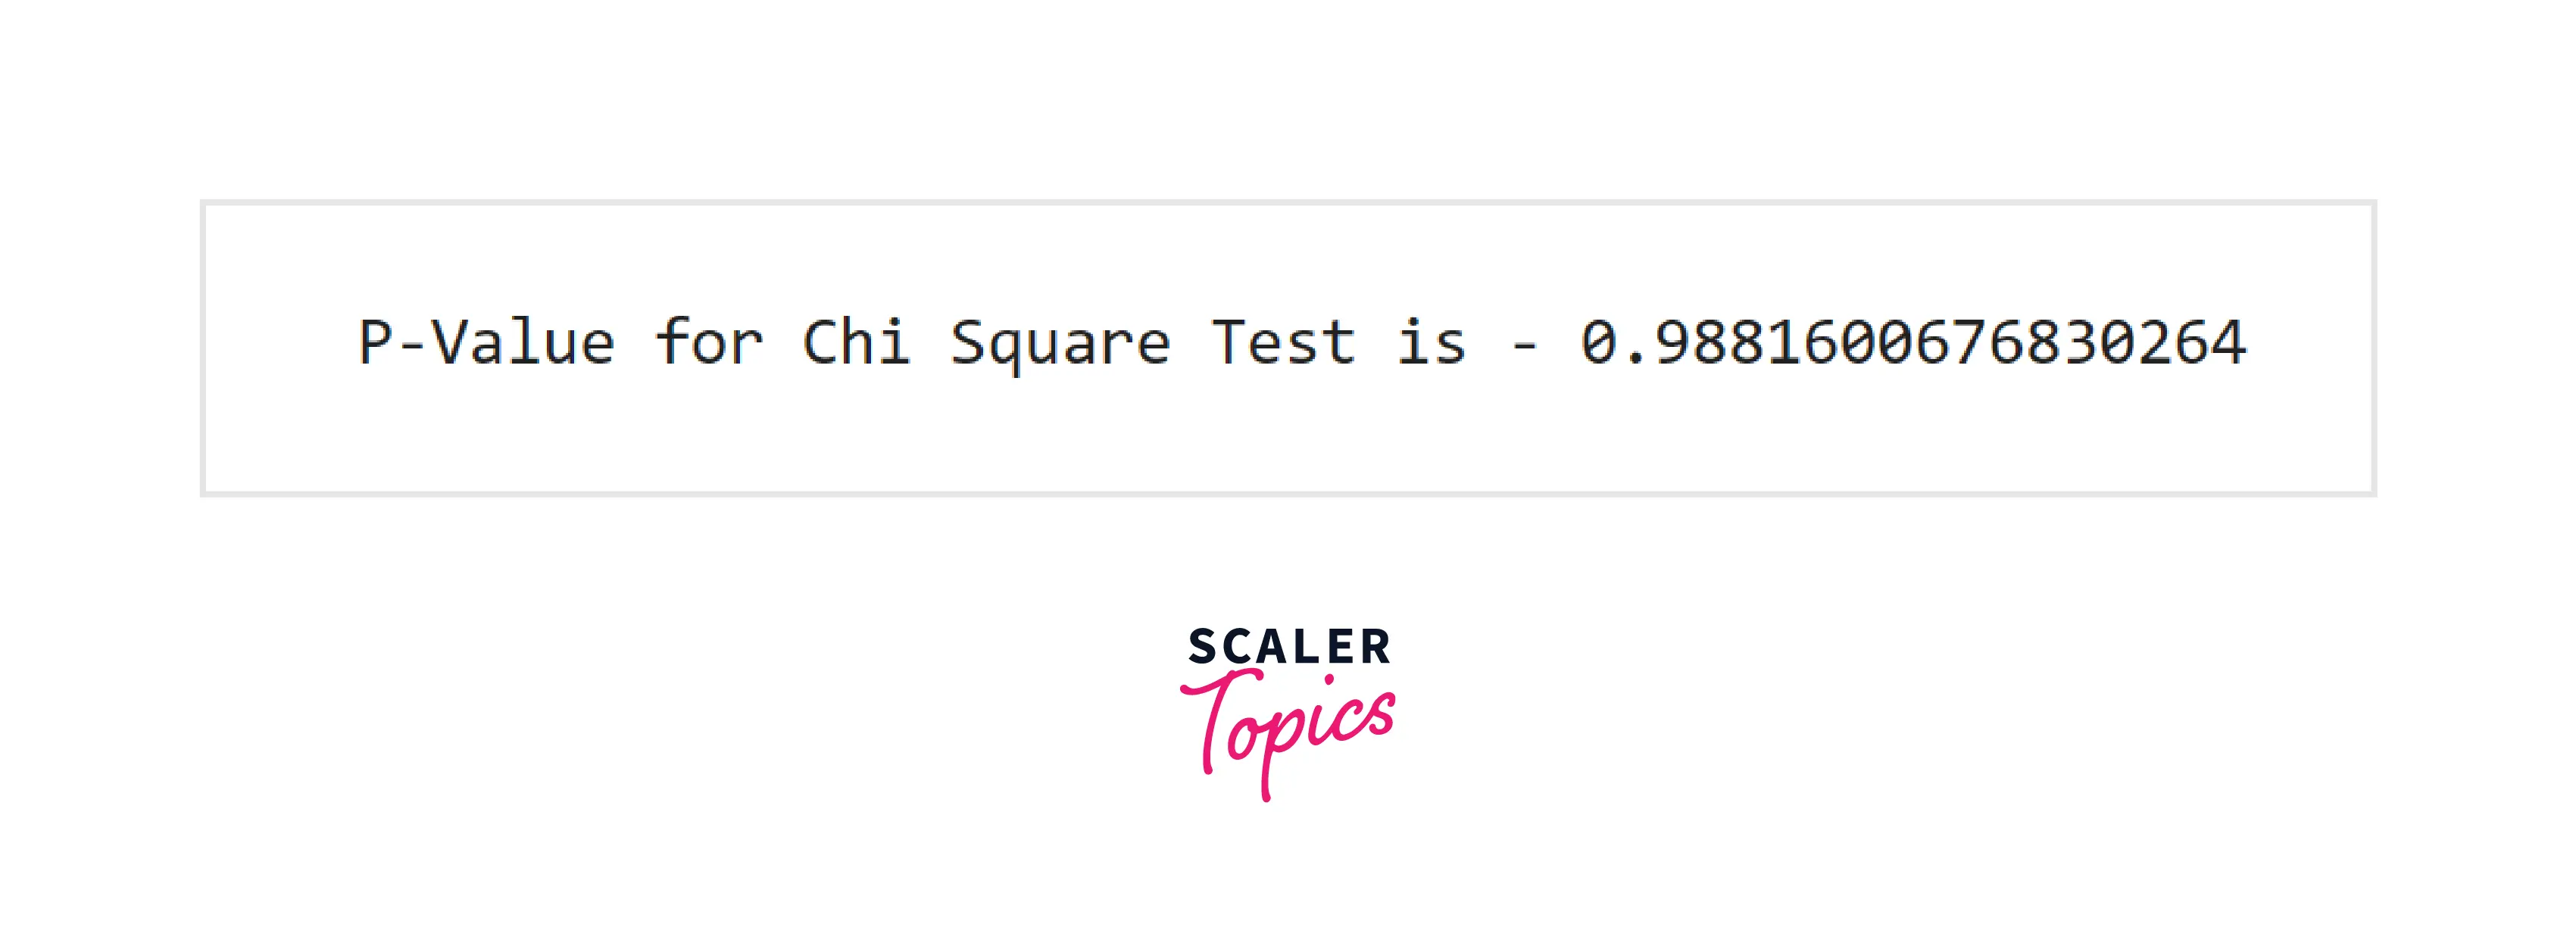
- Since our observed p-value is less than the significance level, then we can’t reject our null hypothesis.
- Hypothesis 3 - An educational consultancy claims that students receive a mean score of 70 or more on average. Let’s define our null and alternative hypothesis -
- Ho (NULL hypothesis) - The overall performance of students is greater than or equal to a score of 70.
- Ha (Alternative hypothesis) - The overall performance of students is less than 70.
- Here, we want to compare the sample's mean with the claimed population mean. For this, we will use the one-sample t-test (one-sided) to test this hypothesis. First, let’s explore the histogram of the overall performance in our dataset. As shown in the figure below, the mean of our sample is 67.77, and most of the values are spread around 50-90. Using one sample t-test, we will check whether this is just due to a chance or is it representative of a larger population.
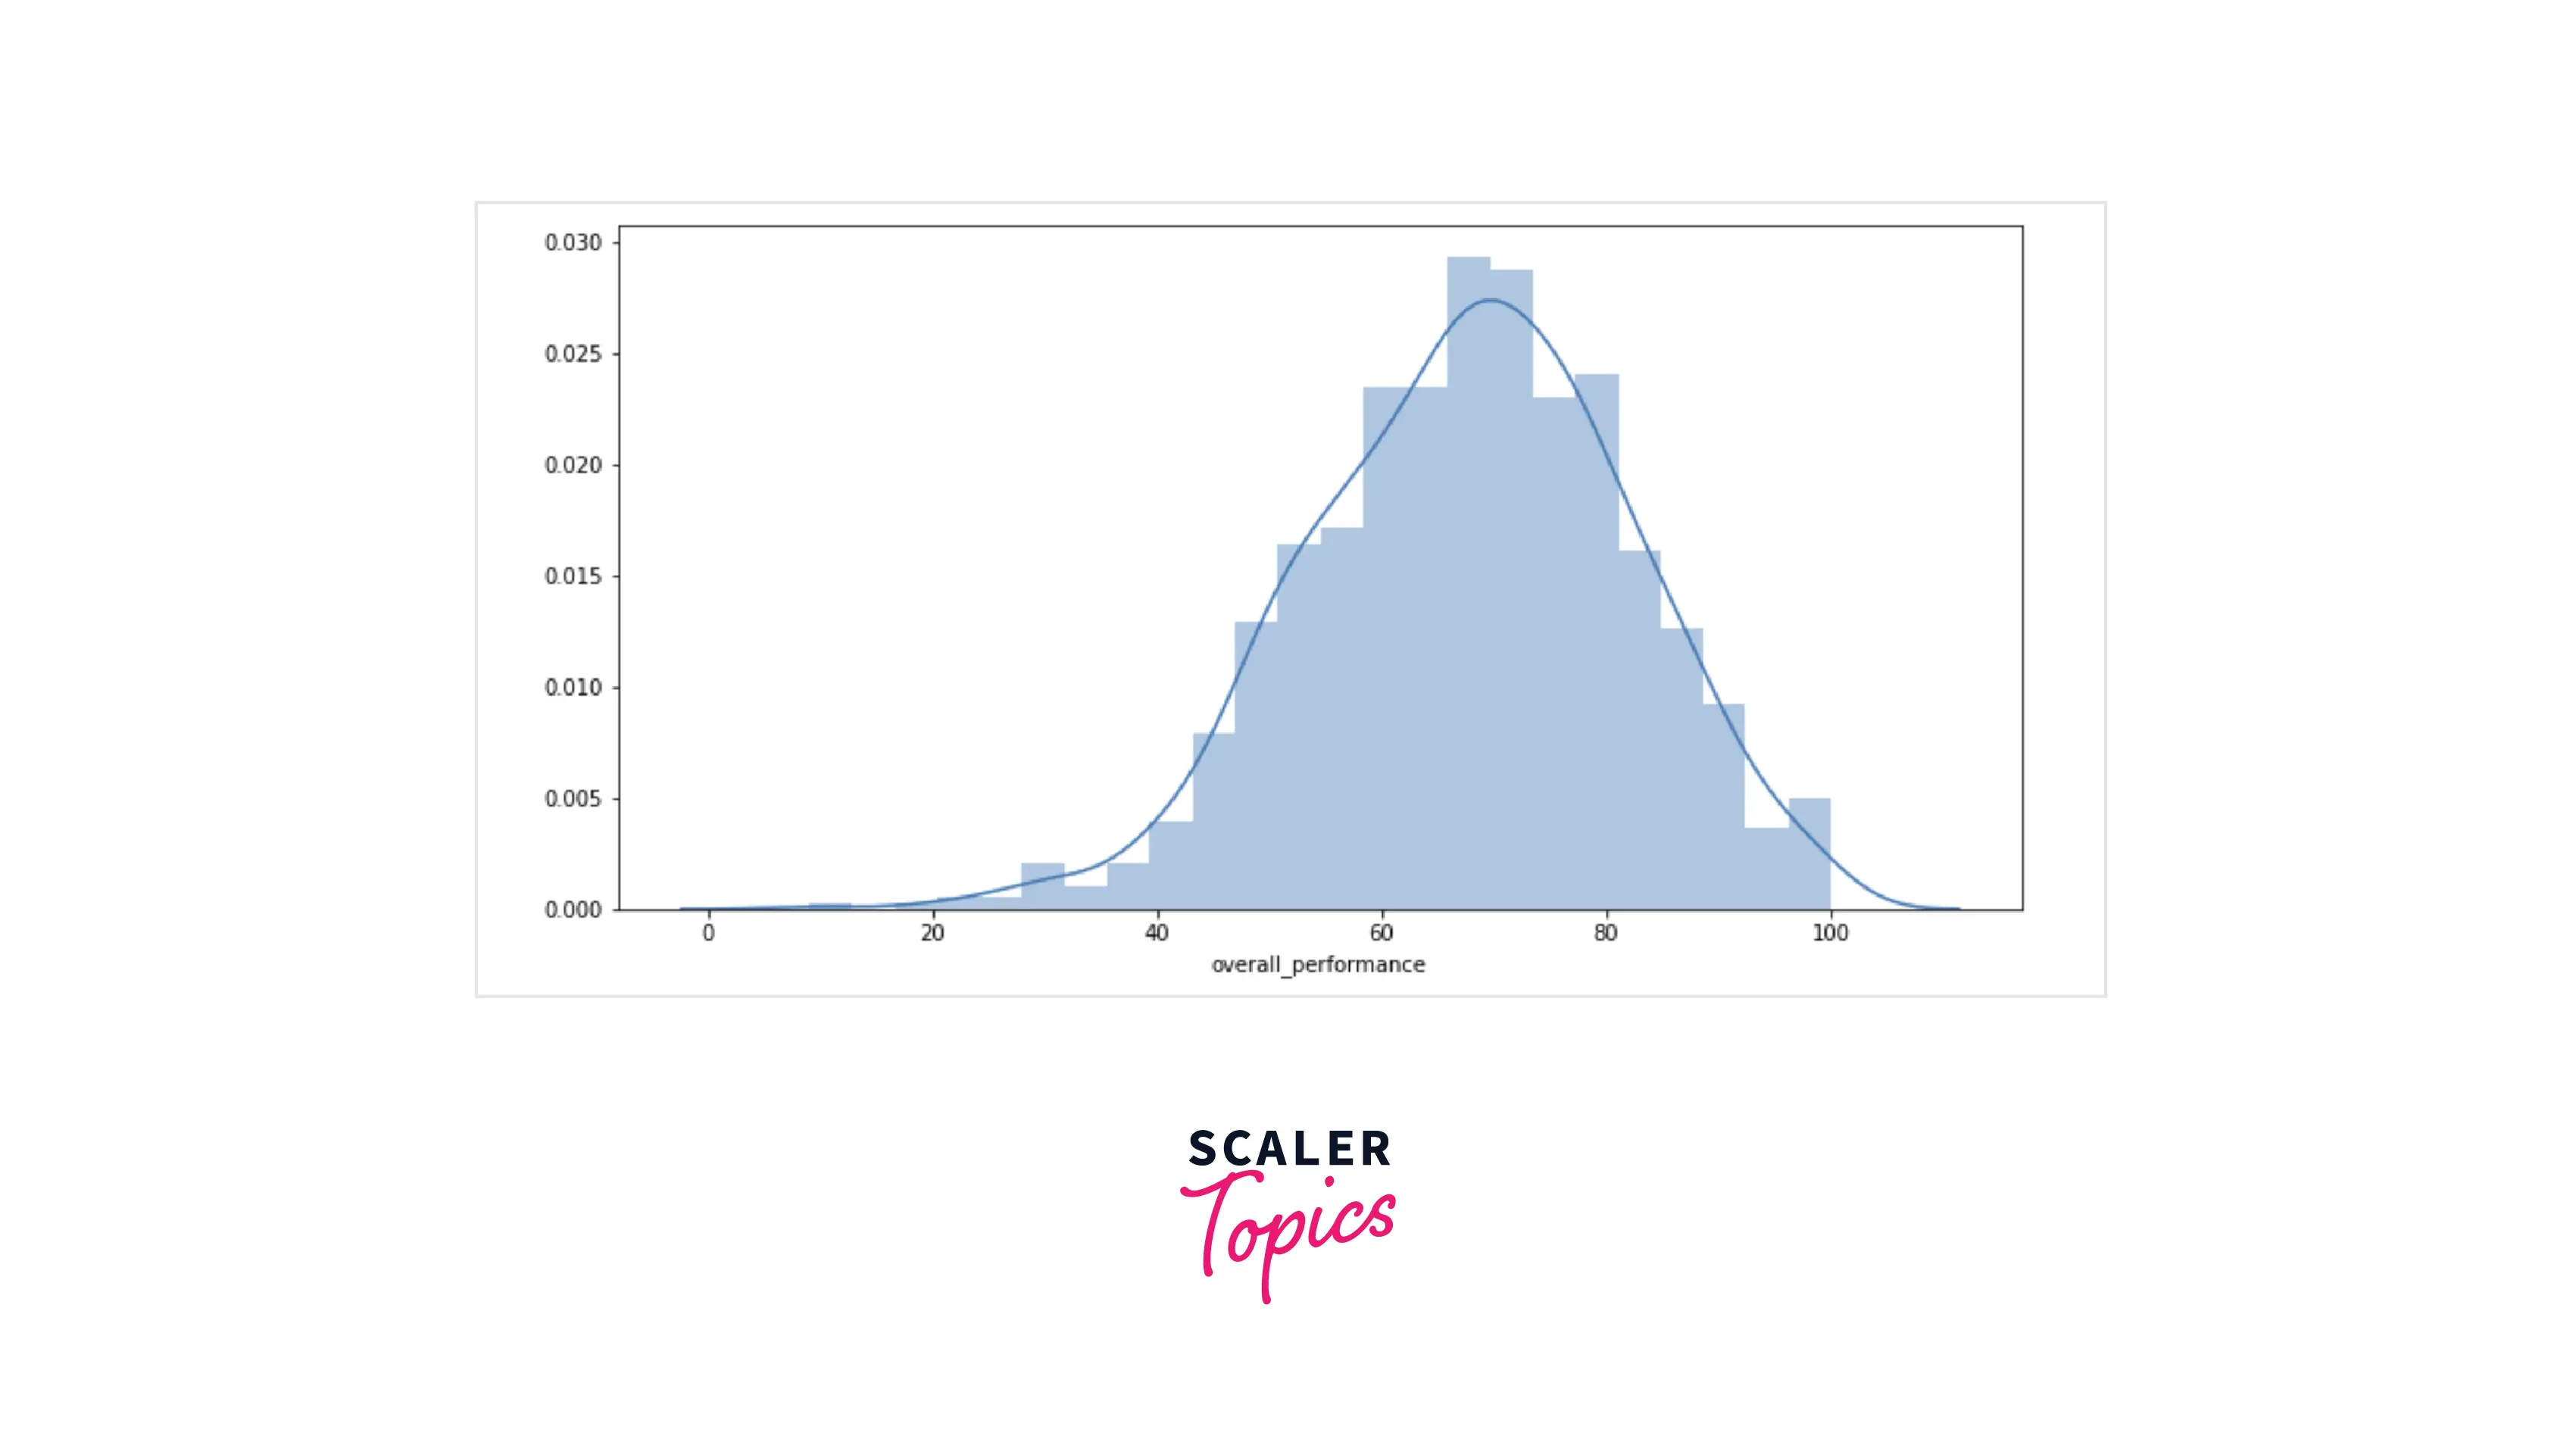
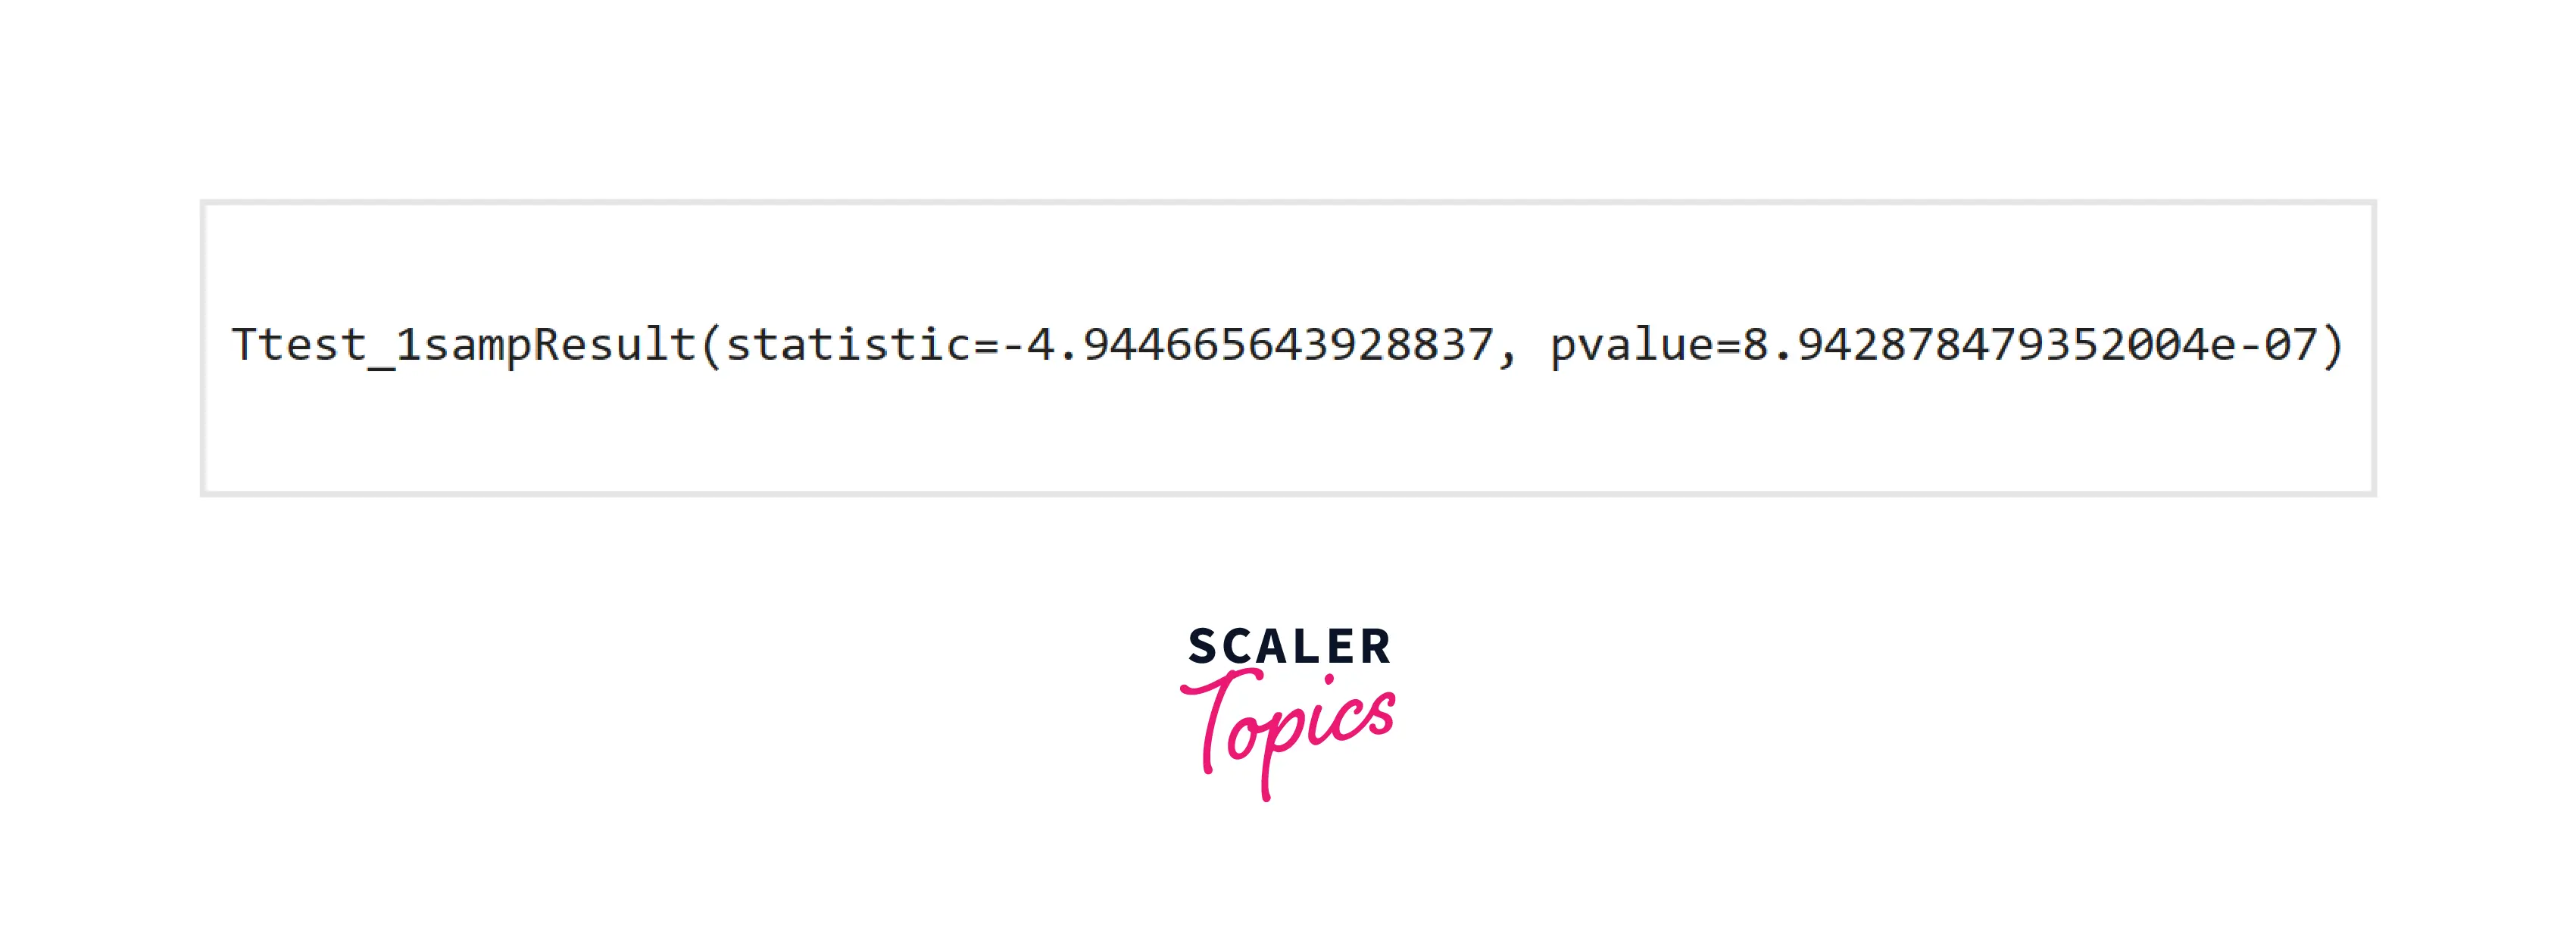
- As the observed p-value is smaller than 0.05 (significance level), it provides enough strong evidence to reject the null hypothesis in favor of the alternative. So, we can reject the educational consultancy’s claims.
- Hypothesis 4 - There is no significant difference in the mean math scores of students who have taken test preparation and those who have not taken any test preparation. Let’s define our null and alternative hypothesis -
- Ho (NULL hypothesis) - There is no difference in students' math scores, irrespective of whether they have taken test preparation.
- Ha (Alternative hypothesis) - There is a difference in students' math scores between those who have completed test preparation and those who have not.
- Here, we want to compare two samples and check whether they are statistically different or not. We will use a two-sample t-test (independent t-test) to check our hypothesis. Let’s explore the mean parameter of both samples.
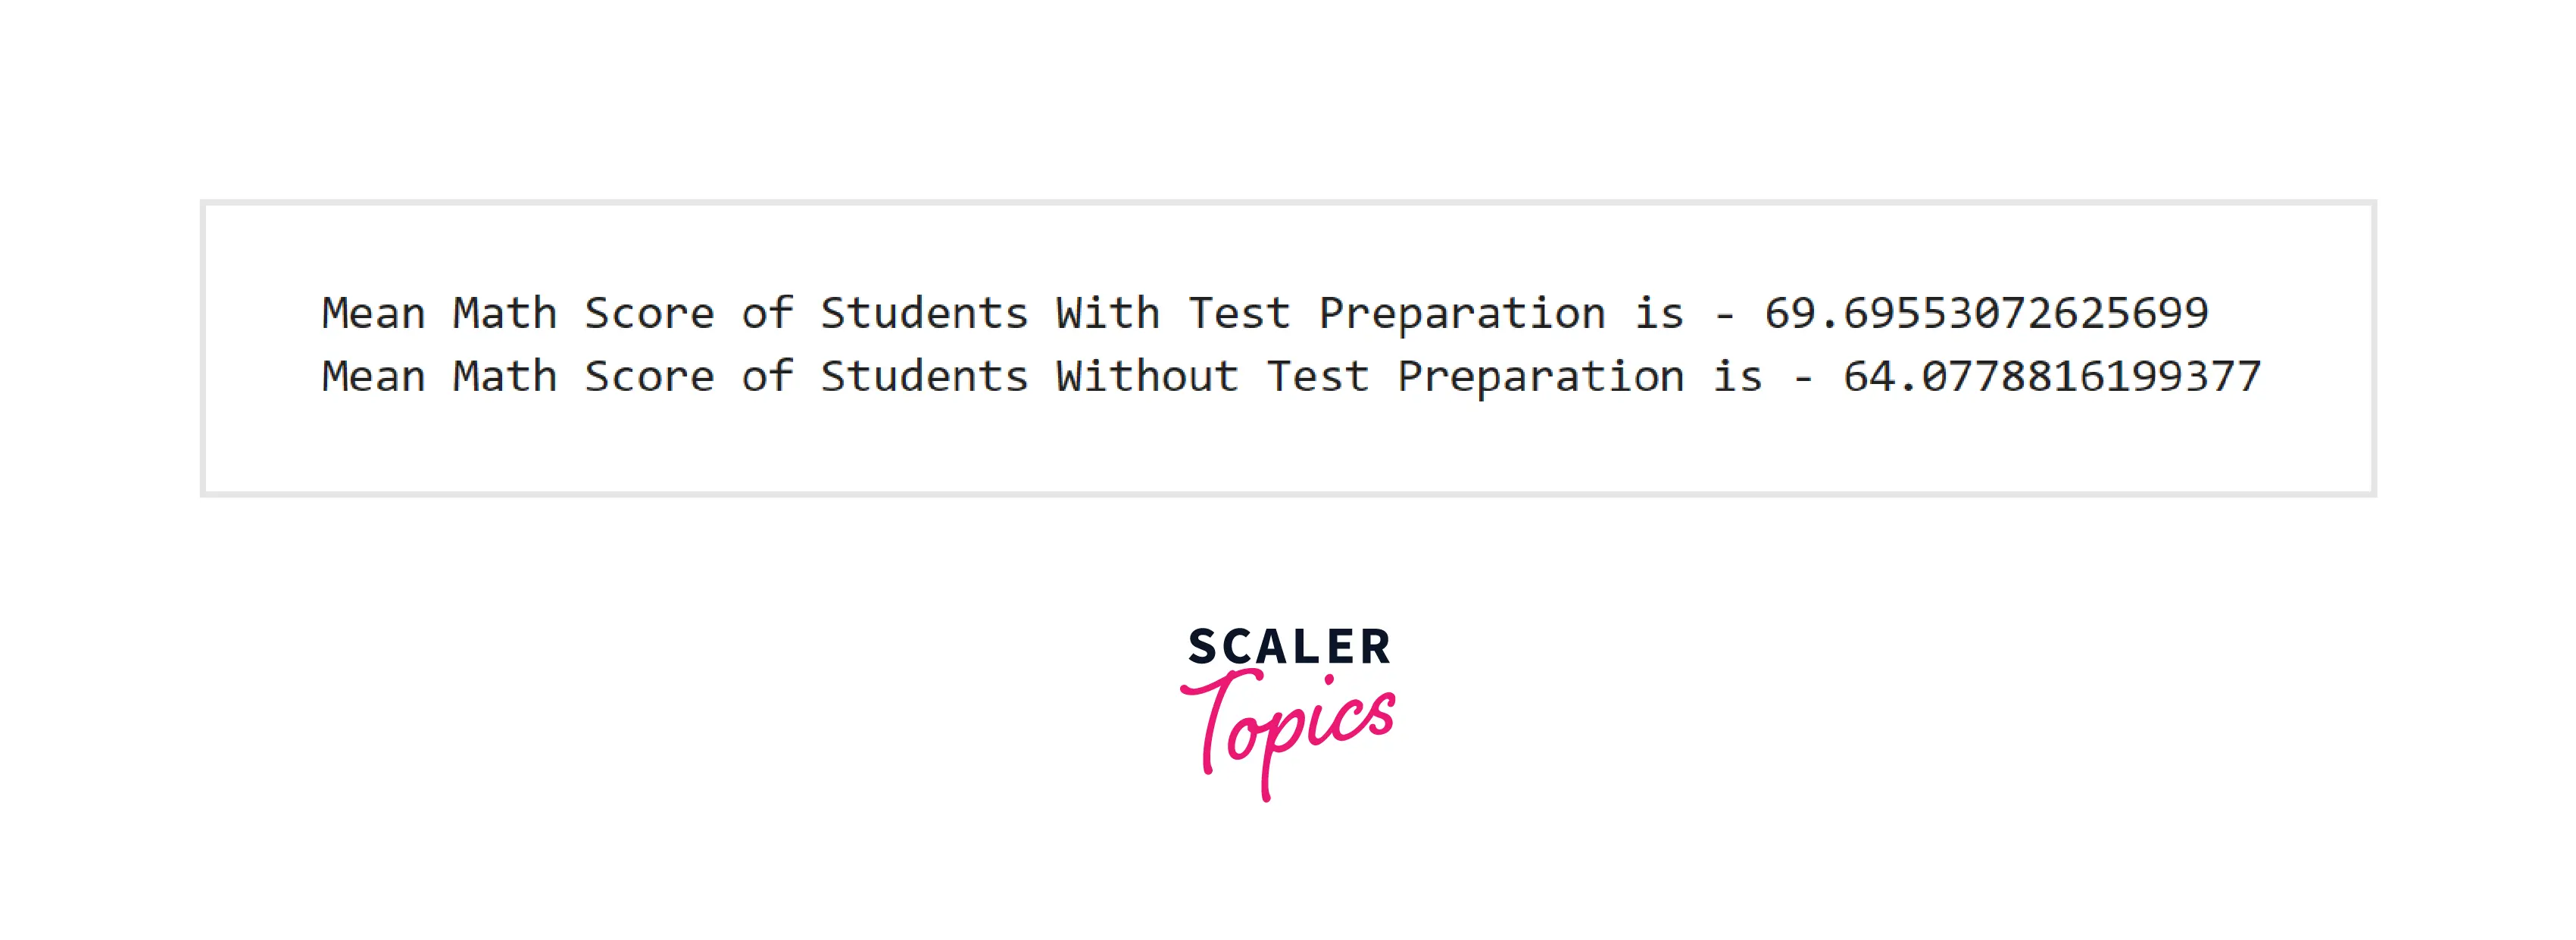
- As we can see, the average math score is higher in the case of the students who have completed the test preparation course. Let’s apply a two-sample t-test to check whether this is just due to chance or whether these are statistically significant.
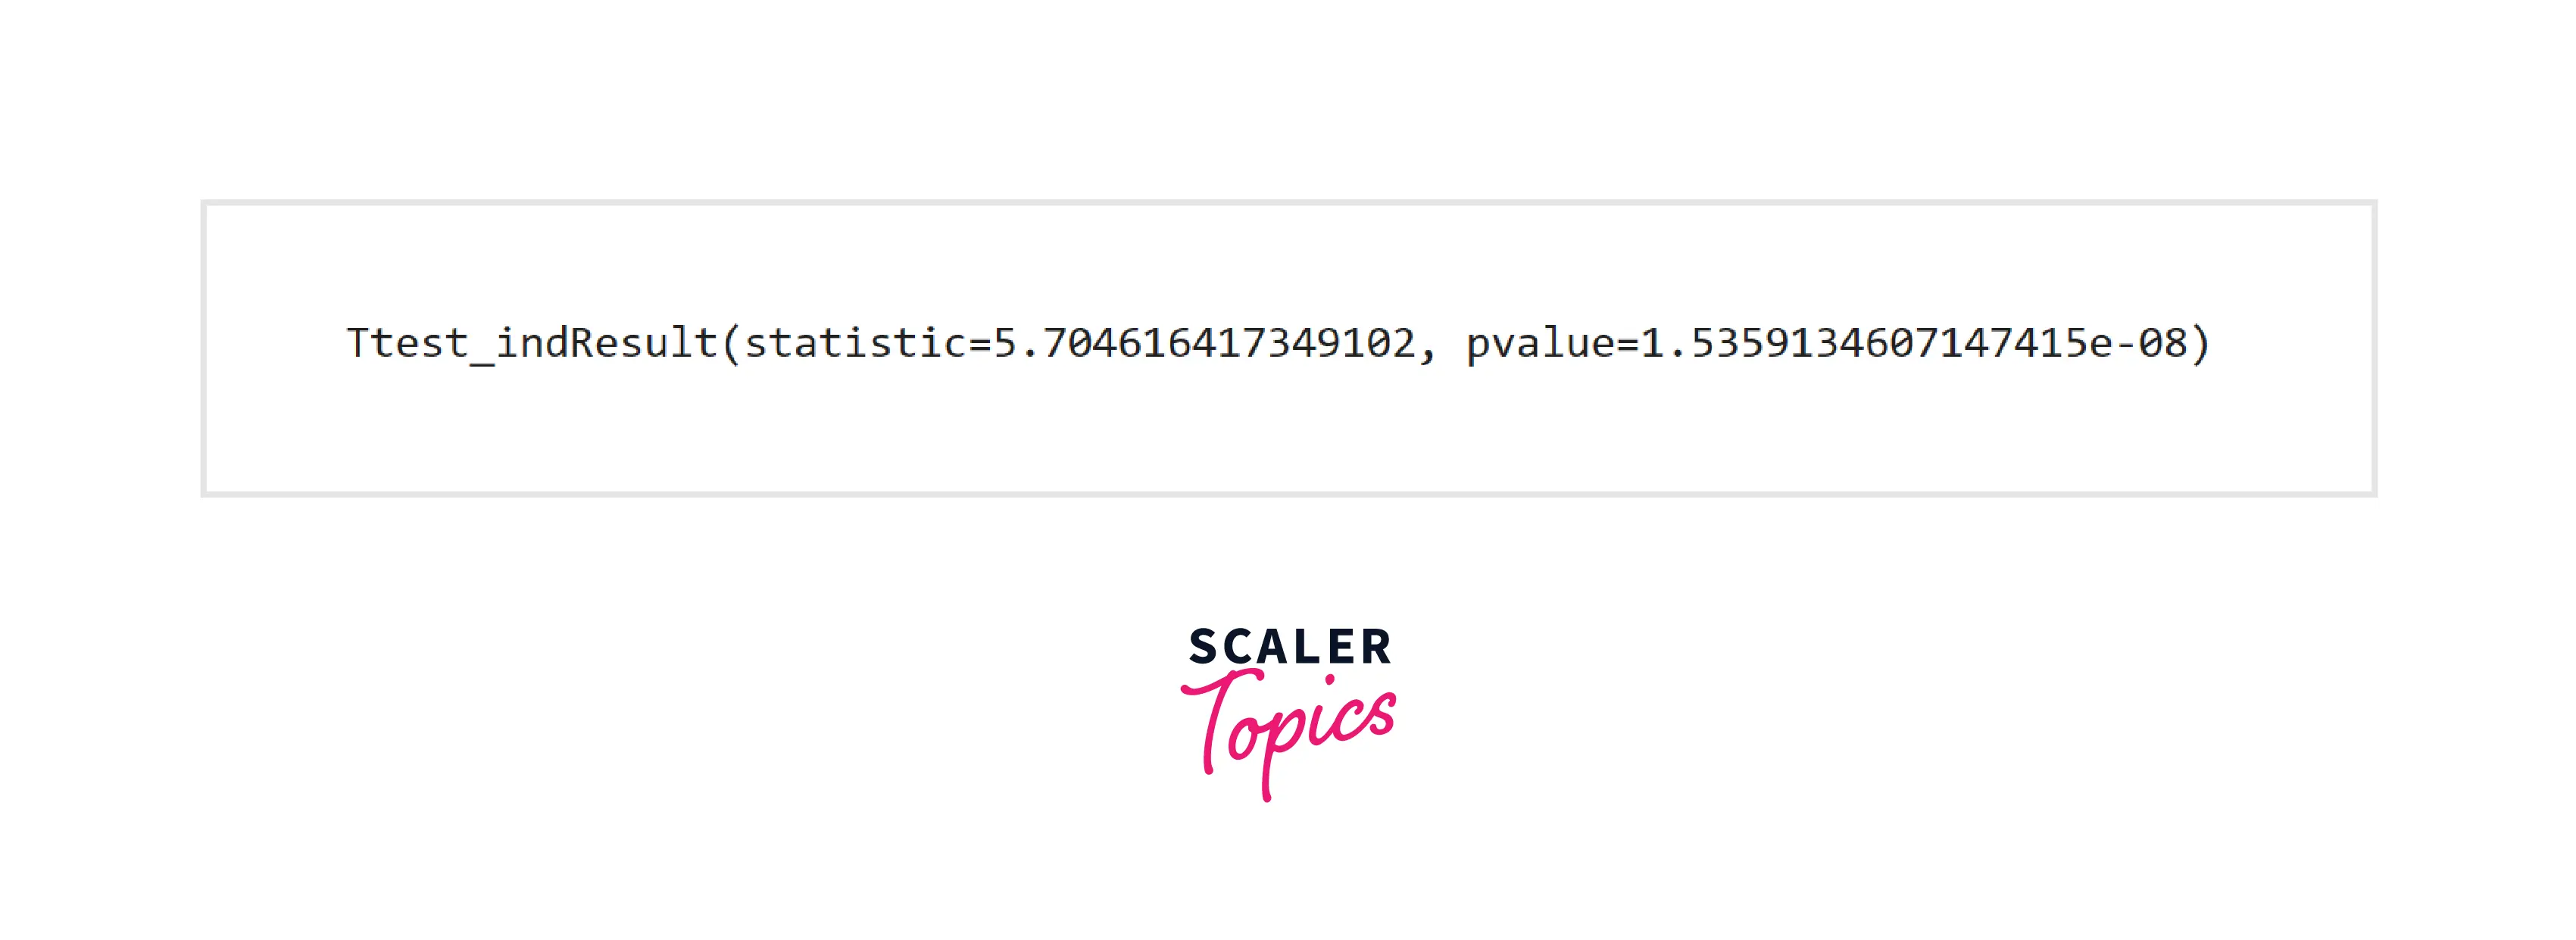
- As the observed p-value is smaller than 0.05 (significance level), it provides enough strong evidence to reject the null hypothesis in favor of the alternative.
Summary
Let’s summarize our findings and insights from the statistical analysis of the student performance dataset below -
- There is no major difference in the mean and standard deviation of the sample for scores in math, reading, and writing.
- Students do not perform equally in math, reading, and writing skills, and thus special attention must be given to those subjects in which students are not strong.
- Gender does not play an important role in deciding a student’s overall academic performance.
- The educational consultancy’s claim that, on average, students get a respectable score of 70 is false.
- Students who have completed prior test preparation perform better.
Conclusion
- We loaded the student performance dataset containing details of students. We analyzed the mean and standard deviation of the features to understand their central tendency and dispersion.
- We performed hypothesis testing on four different kinds of hypotheses and tested them using techniques such as the one-way ANOVA test, chi-square test of independence, one sample t-test, and independent t-test.