Descriptive Vs Inferential Statistics

Statistics is a pivotal element in the realm of data analysis, playing a crucial role in summarizing and inferring patterns from data. This article delves into the core concepts of descriptive and inferential statistics, their types, examples, tools, and key differences.
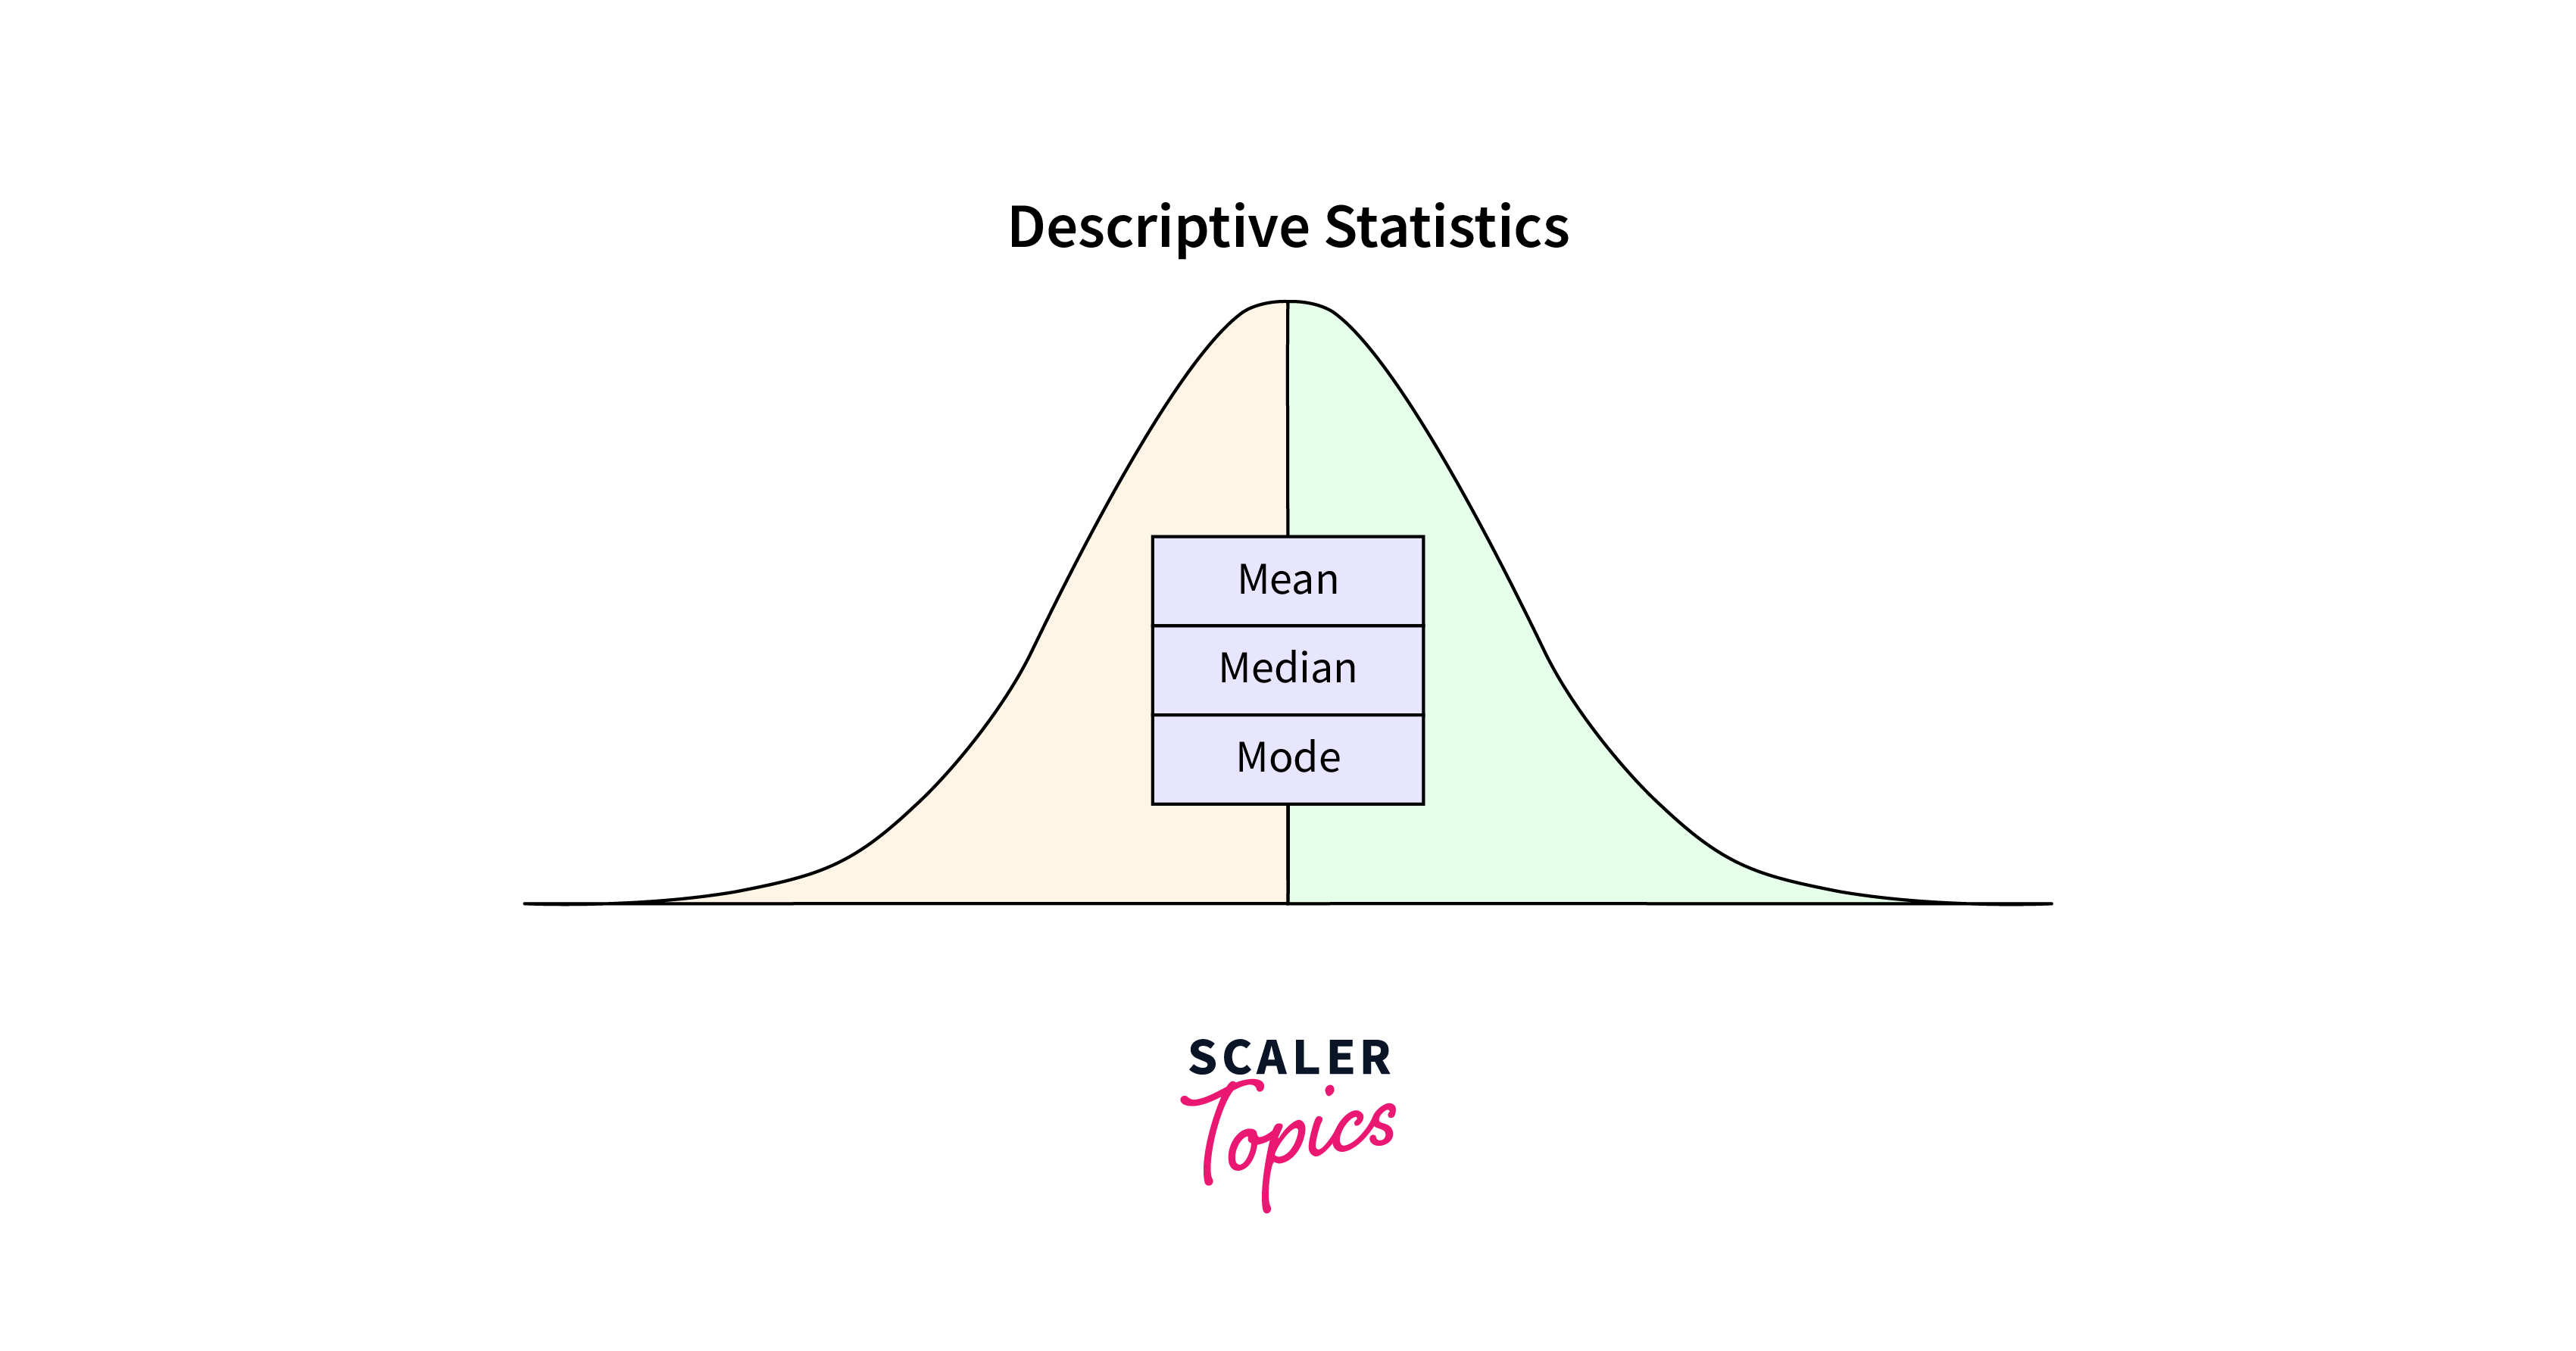
What is Descriptive Statistics?
Descriptive statistics is a branch of statistics that deals with the organization, summarization, and presentation of data. This form of statistics provides a clear overview of the data, aiding in understanding its basic features and structure without making conclusions beyond the data analyzed.
Types
- Measures of Central Tendency:
These include mean (average), median (middle value), and mode (most frequently occurring value). They provide a central point around which the data values cluster. - Measures of Variability or Dispersion:
This category includes range (difference between the highest and lowest values), variance (average of the squared differences from the mean), and standard deviation (a measure of the amount of variation or dispersion in a set of values). - Measures of Position:
Percentiles and quartiles fall into this category, helping in understanding the relative standing of a value within a dataset. - Measures of Shape:
Skewness (asymmetry of the distribution) and kurtosis (the 'tailedness' of the distribution) are used to describe the shape of the data distribution.
Examples
- Mean:
Calculating the average income of a group of people. - Median:
Determining the middle value of property prices in a city. - Mode:
Identifying the most common color of cars sold in a dealership. - Range:
Finding the difference between the highest and lowest temperatures recorded in a month. - Standard Deviation:
Understanding the variability in test scores of students in a class.
Tools
- Microsoft Excel:
Popular for basic descriptive statistics, offering functions to compute mean, median, mode, etc. - R and Python:
Programming languages with extensive libraries (like Pandas, NumPy, and dplyr) for more complex statistical analysis. - SPSS (Statistical Package for the Social Sciences):
A software package used for advanced statistical analysis, particularly in social sciences. - Tableau:
A data visualization tool that can also perform various descriptive statistical analyses. - SAS (Statistical Analysis System):
A software suite used for advanced analytics, multivariate analyses, business intelligence, data management, and predictive analytics.
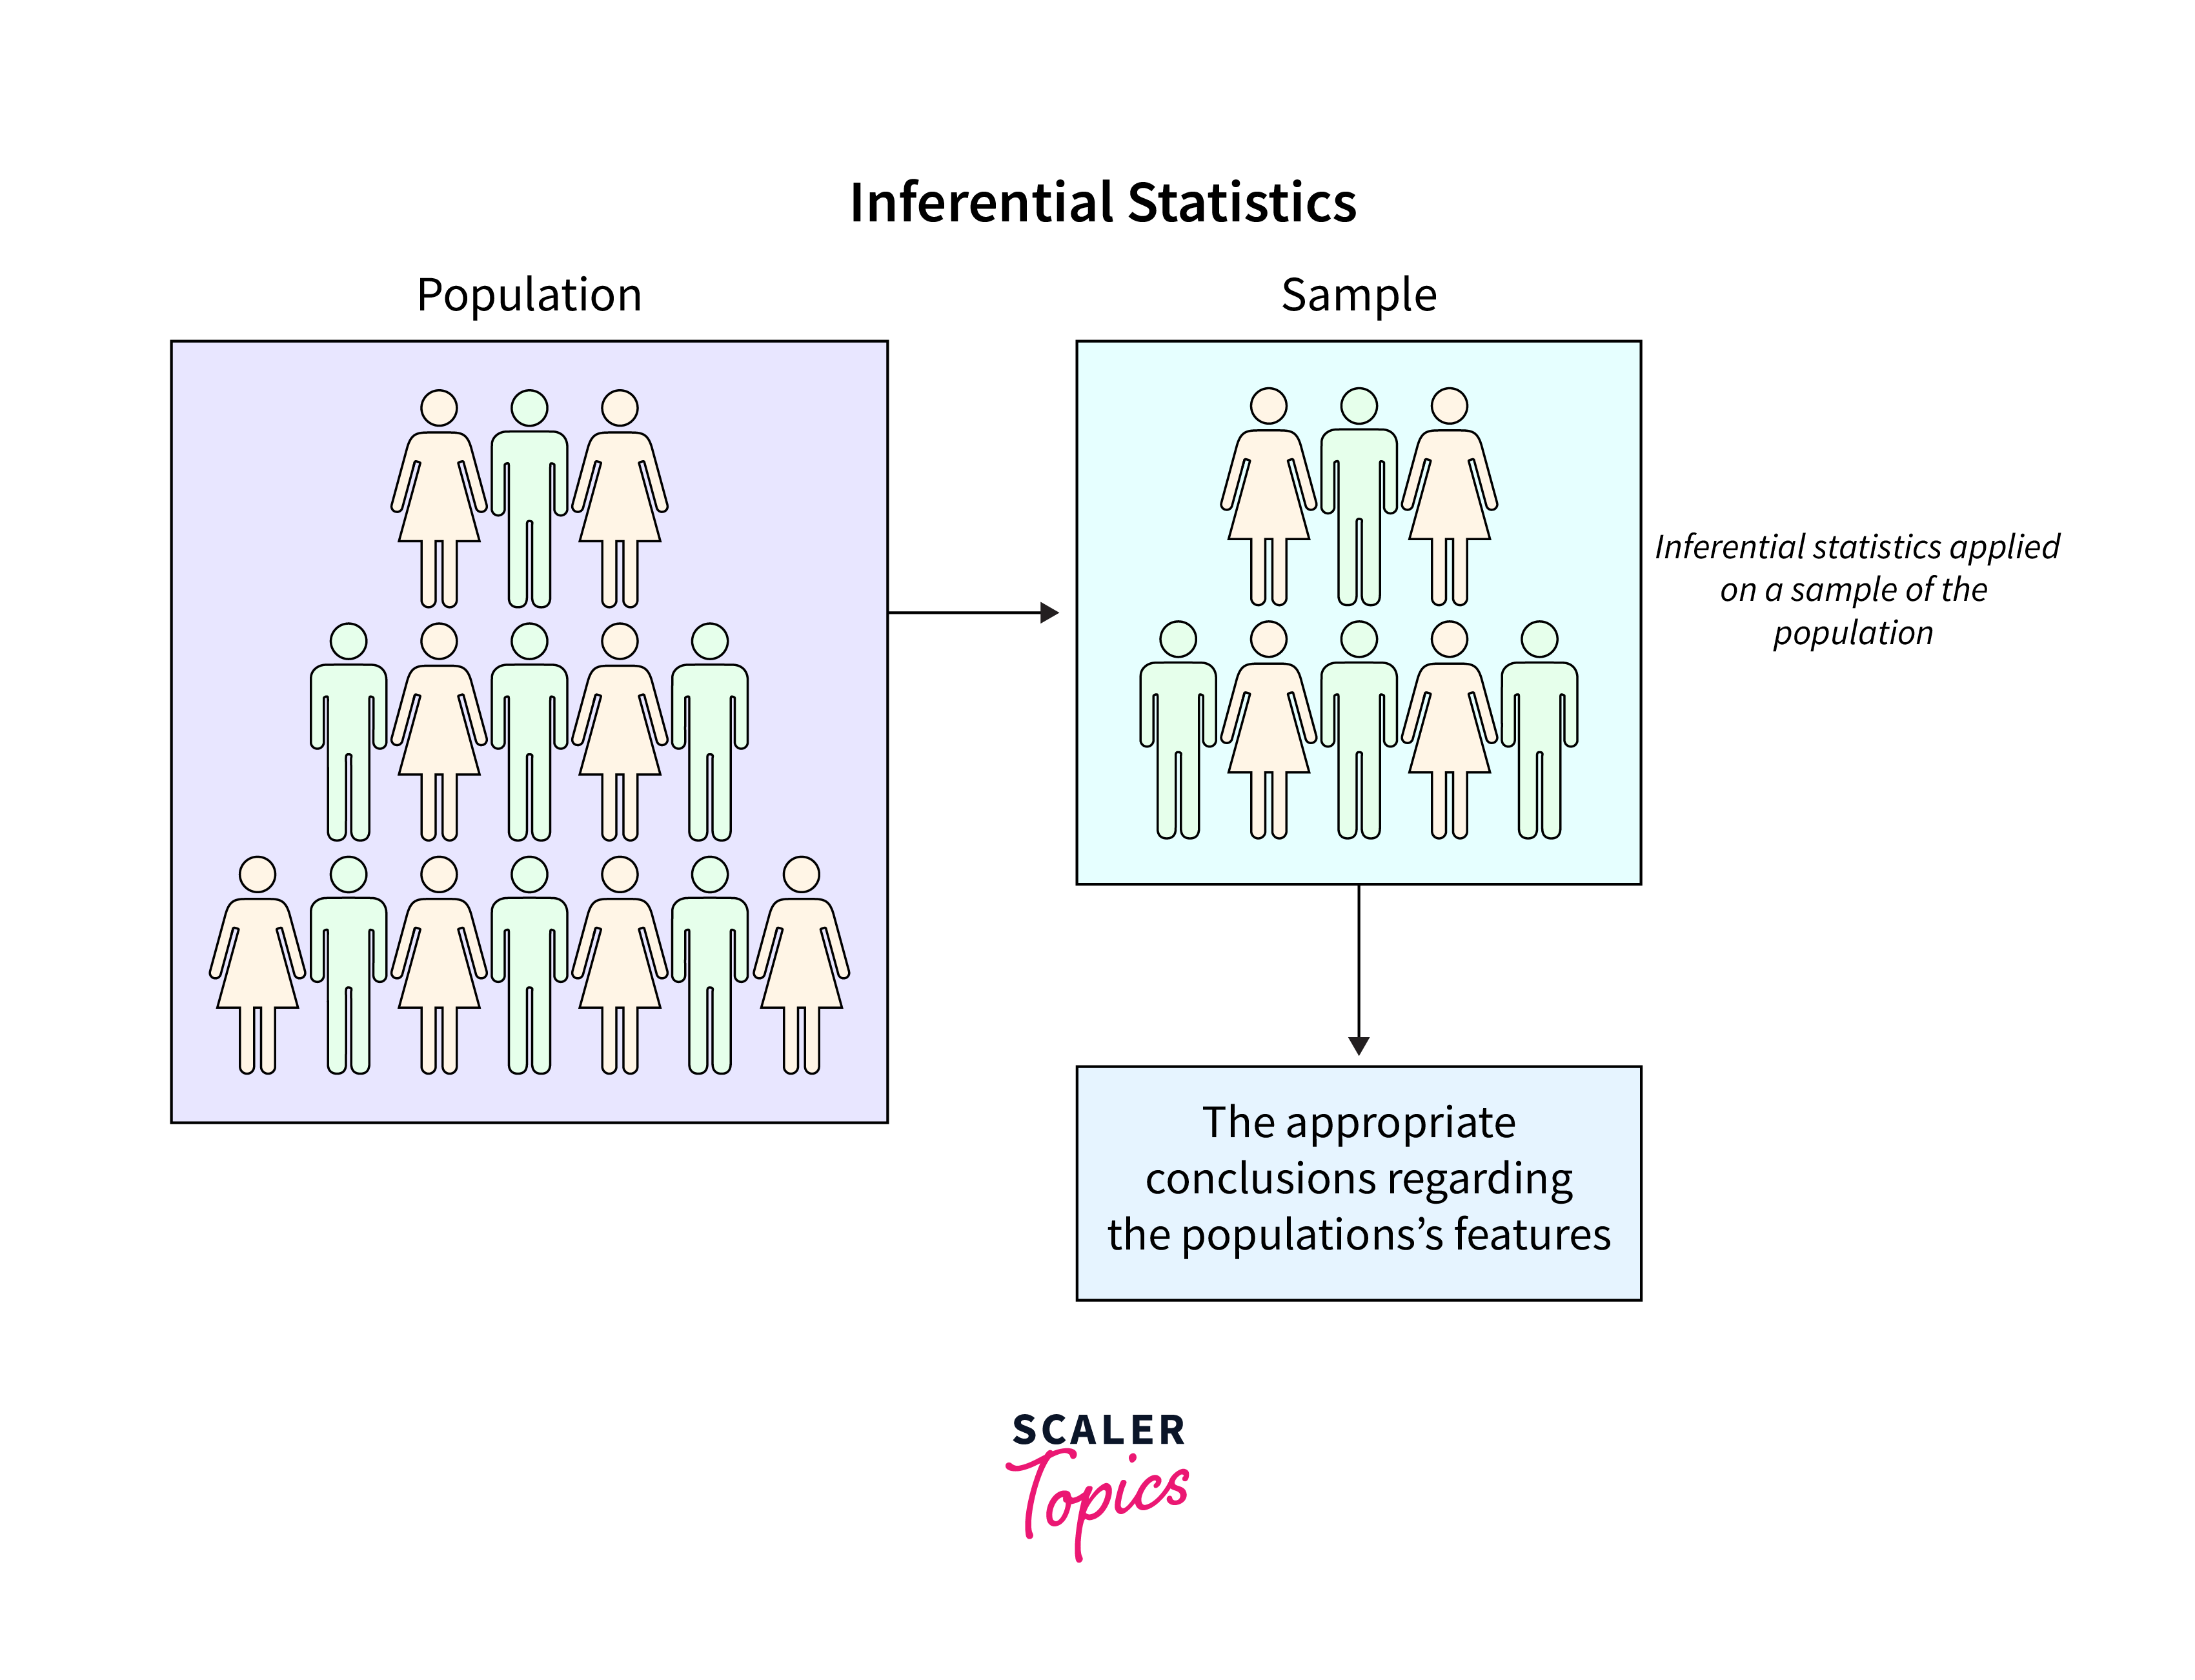
What is Inferential Statistics?
Inferential statistics is a branch of statistics that focuses on drawing conclusions and making predictions about a population based on a sample of data from that population. Unlike descriptive statistics, it goes beyond merely describing the characteristics of the sample to infer properties about an unseen population.
Types
- Estimation:
This involves estimating population parameters (like mean or proportion) from sample data. Estimation can be point estimation (giving a single value) or interval estimation (providing a range of values). - Hypothesis Testing:
This is used to assess the evidence against a specific hypothesis about a population, based on sample data. It includes tests like t-tests, chi-square tests, and ANOVA (Analysis of Variance). - Regression Analysis:
Used to model relationships between variables. Includes linear regression (for linear relationships) and logistic regression (for binary outcomes). - Time Series Analysis:
Deals with data that is collected over time, aiming to identify and explain any trend, seasonality, or cyclic patterns.
Examples
- Estimation:
Estimating the average height of all adults in a city based on a sample. - Hypothesis Testing:
Determining if a new drug is more effective than the existing one using a controlled experiment. - Regression Analysis:
Predicting house prices based on factors like size, location, and number of bedrooms. - Time Series Analysis:
Forecasting stock market trends based on historical data.
Tools
- R and Python:
Widely used for inferential statistical analysis, with libraries such as SciPy and StatsModels in Python, and packages like ggplot2 and tidyr in R. - SAS:
Offers advanced options for complex inferential statistics, including multivariate analyses. - Minitab:
A statistical software that provides tools for analysis and is particularly user-friendly for hypothesis testing and regression. - SPSS:
Commonly used in social sciences for various inferential statistical analyses. - Stata:
A robust statistical software used in economics and biomedicine, known for its capabilities in managing complex data structures and performing a variety of statistical analyses.
Difference Between Descriptive And Inferential Statistics
Descriptive statistics is focused on summarizing and describing the characteristics of a specific dataset. It deals with the 'what is' aspect of the data, providing a detailed view of its components through measures like mean, median, and standard deviation. On the other hand, inferential statistics goes a step further. It uses data from a sample to make generalizations or predictions about a larger population, addressing questions like 'what could be' or 'what are the chances.' This involves techniques such as hypothesis testing, regression analysis, and estimation of parameters.
Now, let's look at the differences between these two types of statistics:
| Aspect | Descriptive Statistics | Inferential Statistics |
|---|---|---|
| Purpose | To summarize and describe the main features of a dataset. | To make predictions or inferences about a population based on sample data. |
| Data Usage | Concerned with the analysis of the actual dataset in hand. | Utilizes sample data to generalize about a larger population. |
| Methodology | Involves measures of central tendency, dispersion, and frequency. | Involves hypothesis testing, estimation, and modeling. |
| Result Interpretation | Provides a summary of the data through numerical descriptions, graphs, and tables. | Draws conclusions about the population, including predictions and testing hypotheses. |
| Uncertainty Measurement | Does not typically involve uncertainty or error measurement. | Includes error estimation, confidence intervals, and significance levels. |
| Scope of Conclusion | Conclusions are limited to the data at hand. | Conclusions extend beyond the sample to make inferences about the broader population. |
| Examples | Calculating the average age of students in a class. | Estimating the average age of all students in a school system based on a sample. |
| Common Applications | Data organization, initial data analysis, data visualization. | Predictive modeling, decision making, scientific research. |
| Statistical Techniques | Mean, median, mode, range, variance, standard deviation. | T-tests, chi-square tests, regression analysis, ANOVA. |
| Primary Focus | Describing the properties of the existing dataset. | Making predictions or generalizations about a population. |
Similarities between Descriptive and Inferential Statistics
While descriptive and inferential statistics are distinct in their objectives and methodologies, they share several key similarities:
- Data-Driven Analysis:
Both rely heavily on data. Descriptive statistics use data to summarize its main characteristics, whereas inferential statistics use data as a basis for making predictions about a larger group. - Statistical Methods and Tools:
They both utilize a variety of statistical methods and tools. For instance, measures like mean and standard deviation are used in descriptive analysis and also play a role in inferential statistics, particularly in hypothesis testing and estimation. - Foundation for Decision Making:
Both forms of statistics are crucial in the decision-making process. Descriptive statistics provide a clear understanding of the current state of the data, which is essential before making any inferences. Inferential statistics then takes this understanding to predict or make decisions about the broader context. - Graphical Data Representation:
In both, visual representation of data such as charts, graphs, and plots are common. These visual tools help in the interpretation and understanding of data, whether it's being summarized (descriptive) or used to make predictions (inferential). - Importance in Research:
Both are fundamental in research methodology. Descriptive statistics often serve as the preliminary step in research, providing an initial analysis that informs further research, which often involves inferential statistics for testing hypotheses or making predictions. - Quantitative Analysis:
Each utilizes quantitative methods for analyzing data. This includes the use of numbers, measurements, and quantitative techniques to analyze and interpret data. - Software and Programming Languages:
Similar software packages and programming languages, like R, Python, SPSS, and SAS, are used in both descriptive and inferential statistics for data analysis and interpretation.
When to Choose Descriptive/Inferential Statistics?
Choosing between descriptive and inferential statistics depends on the objectives of your data analysis and the nature of the data available. Here are some guidelines to help determine when to use each:
When to Choose Descriptive Statistics:
- Understanding Basic Features of Data:
If the goal is to simply describe or summarize the data you have, such as calculating averages, frequencies, or percentages, descriptive statistics is the way to go. - Initial Data Exploration:
Before diving into complex analysis, descriptive statistics provide an essential first look at the data, helping to understand its basic properties. - Reporting Data to Stakeholders:
When you need to present data to stakeholders who may not be familiar with advanced statistical techniques, descriptive statistics offer a clear and straightforward way to communicate information. - Data Visualization:
For creating graphs, charts, and tables that illustrate the data’s current state, descriptive statistics are used to provide a visual summary. - Large Data Sets:
When you have complete data for the entire population of interest, descriptive statistics can be sufficient to understand and convey the characteristics of this data.

When to Choose Inferential Statistics:
- Making Predictions:
If the objective is to make predictions about a larger population based on a sample, inferential statistics is necessary. - Testing Hypotheses:
Whenever there's a need to test a hypothesis or a theory, inferential statistics provide the tools to do so, like t-tests or ANOVA. - Estimating Population Parameters:
When you need to estimate characteristics of a population (like mean or proportion) from a sample, inferential techniques are used. - Limited Data Availability:
If you only have a sample of data and need to draw conclusions about the larger population, inferential statistics allow you to do so with a degree of confidence. - Decision Making:
For making informed decisions based on the analysis of data trends and patterns, especially when these decisions affect broader groups or populations, inferential statistics offer the necessary insights.
FAQs
Q. Can descriptive and inferential statistics be used together?
A. Yes, they often complement each other; descriptive statistics summarize the data, while inferential statistics use this summary to make predictions or inferences about a larger population.
Q. Do I need a large dataset for inferential statistics?
A. Not necessarily large, but you need a representative sample of the population to make reliable inferences.
Q. Is inferential statistics more complex than descriptive statistics?
A. Generally, yes. Inferential statistics involves more complex techniques like hypothesis testing and regression analysis, compared to the more straightforward summary measures in descriptive statistics.
Q. Can I use inferential statistics for any type of data?
A. Inferential statistics is most effective with random and representative samples. If the sample is biased or not representative of the population, the inferences may not be accurate.
Conclusion
- It's crucial to understand the fundamental differences and applications of descriptive and inferential statistics. Descriptive statistics is about summarizing and describing data, while inferential statistics focuses on making predictions or inferences based on data.
- Choose descriptive statistics for data summarization and initial analysis, and opt for inferential statistics when making predictions or testing hypotheses about a broader population.
- Both descriptive and inferential statistics complement each other and are often used together in comprehensive data analysis to provide a complete picture.
- Familiarity with tools and software, such as R, Python, SPSS, and Excel, is beneficial as they are commonly used for both descriptive and inferential statistical analysis.
- Mastery of both descriptive and inferential statistics is essential for effective data-driven decision-making in various fields, from business to scientific research.