


How to Calculate Moving Average in Excel?
Overview
Excel is a useful application that enables you to manage your data, calculate, and track significant metrics. You can perform an Excel moving average calculation with Excel's assistance. You can save time and effort by becoming proficient in this computation within the program as you work on your projects and analysis.
In this article, we define moving averages, identify their possible uses, describe how to calculate Excel moving averages and provide an example calculation for reference.
Transform Your Career
Choose from our industry-leading programs designed for career success
Modern Software and AI Engineering Program
Master full-stack development with AI integration


 +1000 more
Modern Data Science and ML with specialisation in AI
Advanced data science techniques with AI specialization
+1000 moreAdvanced AIML with Specialisation in Agentic AI
Deep dive into AIML with focus on Agentic systems
+1000 moreDevOps, Cloud & AI Platform Engineering
Build and manage AI-powered cloud infrastructure
+1000 moreAI Engineering Advanced Certification by IIT-Roorkee
Premier AI engineering certification from IIT-Roorkee

What is a Moving average?
A Excel moving average is a statistical calculation used to analyze data points by creating a series of averages of different subsets of a complete data set. It helps smooth out price trends by filtering out the noise from random short-term price fluctuations. In Excel, a moving average can be calculated using functions such as AVERAGE, or through the Data Analysis add-in. It's commonly used in financial analysis, sales forecasting, and process and quality control to identify trends, forecast future values, and understand the overall direction of a data series over a given period.
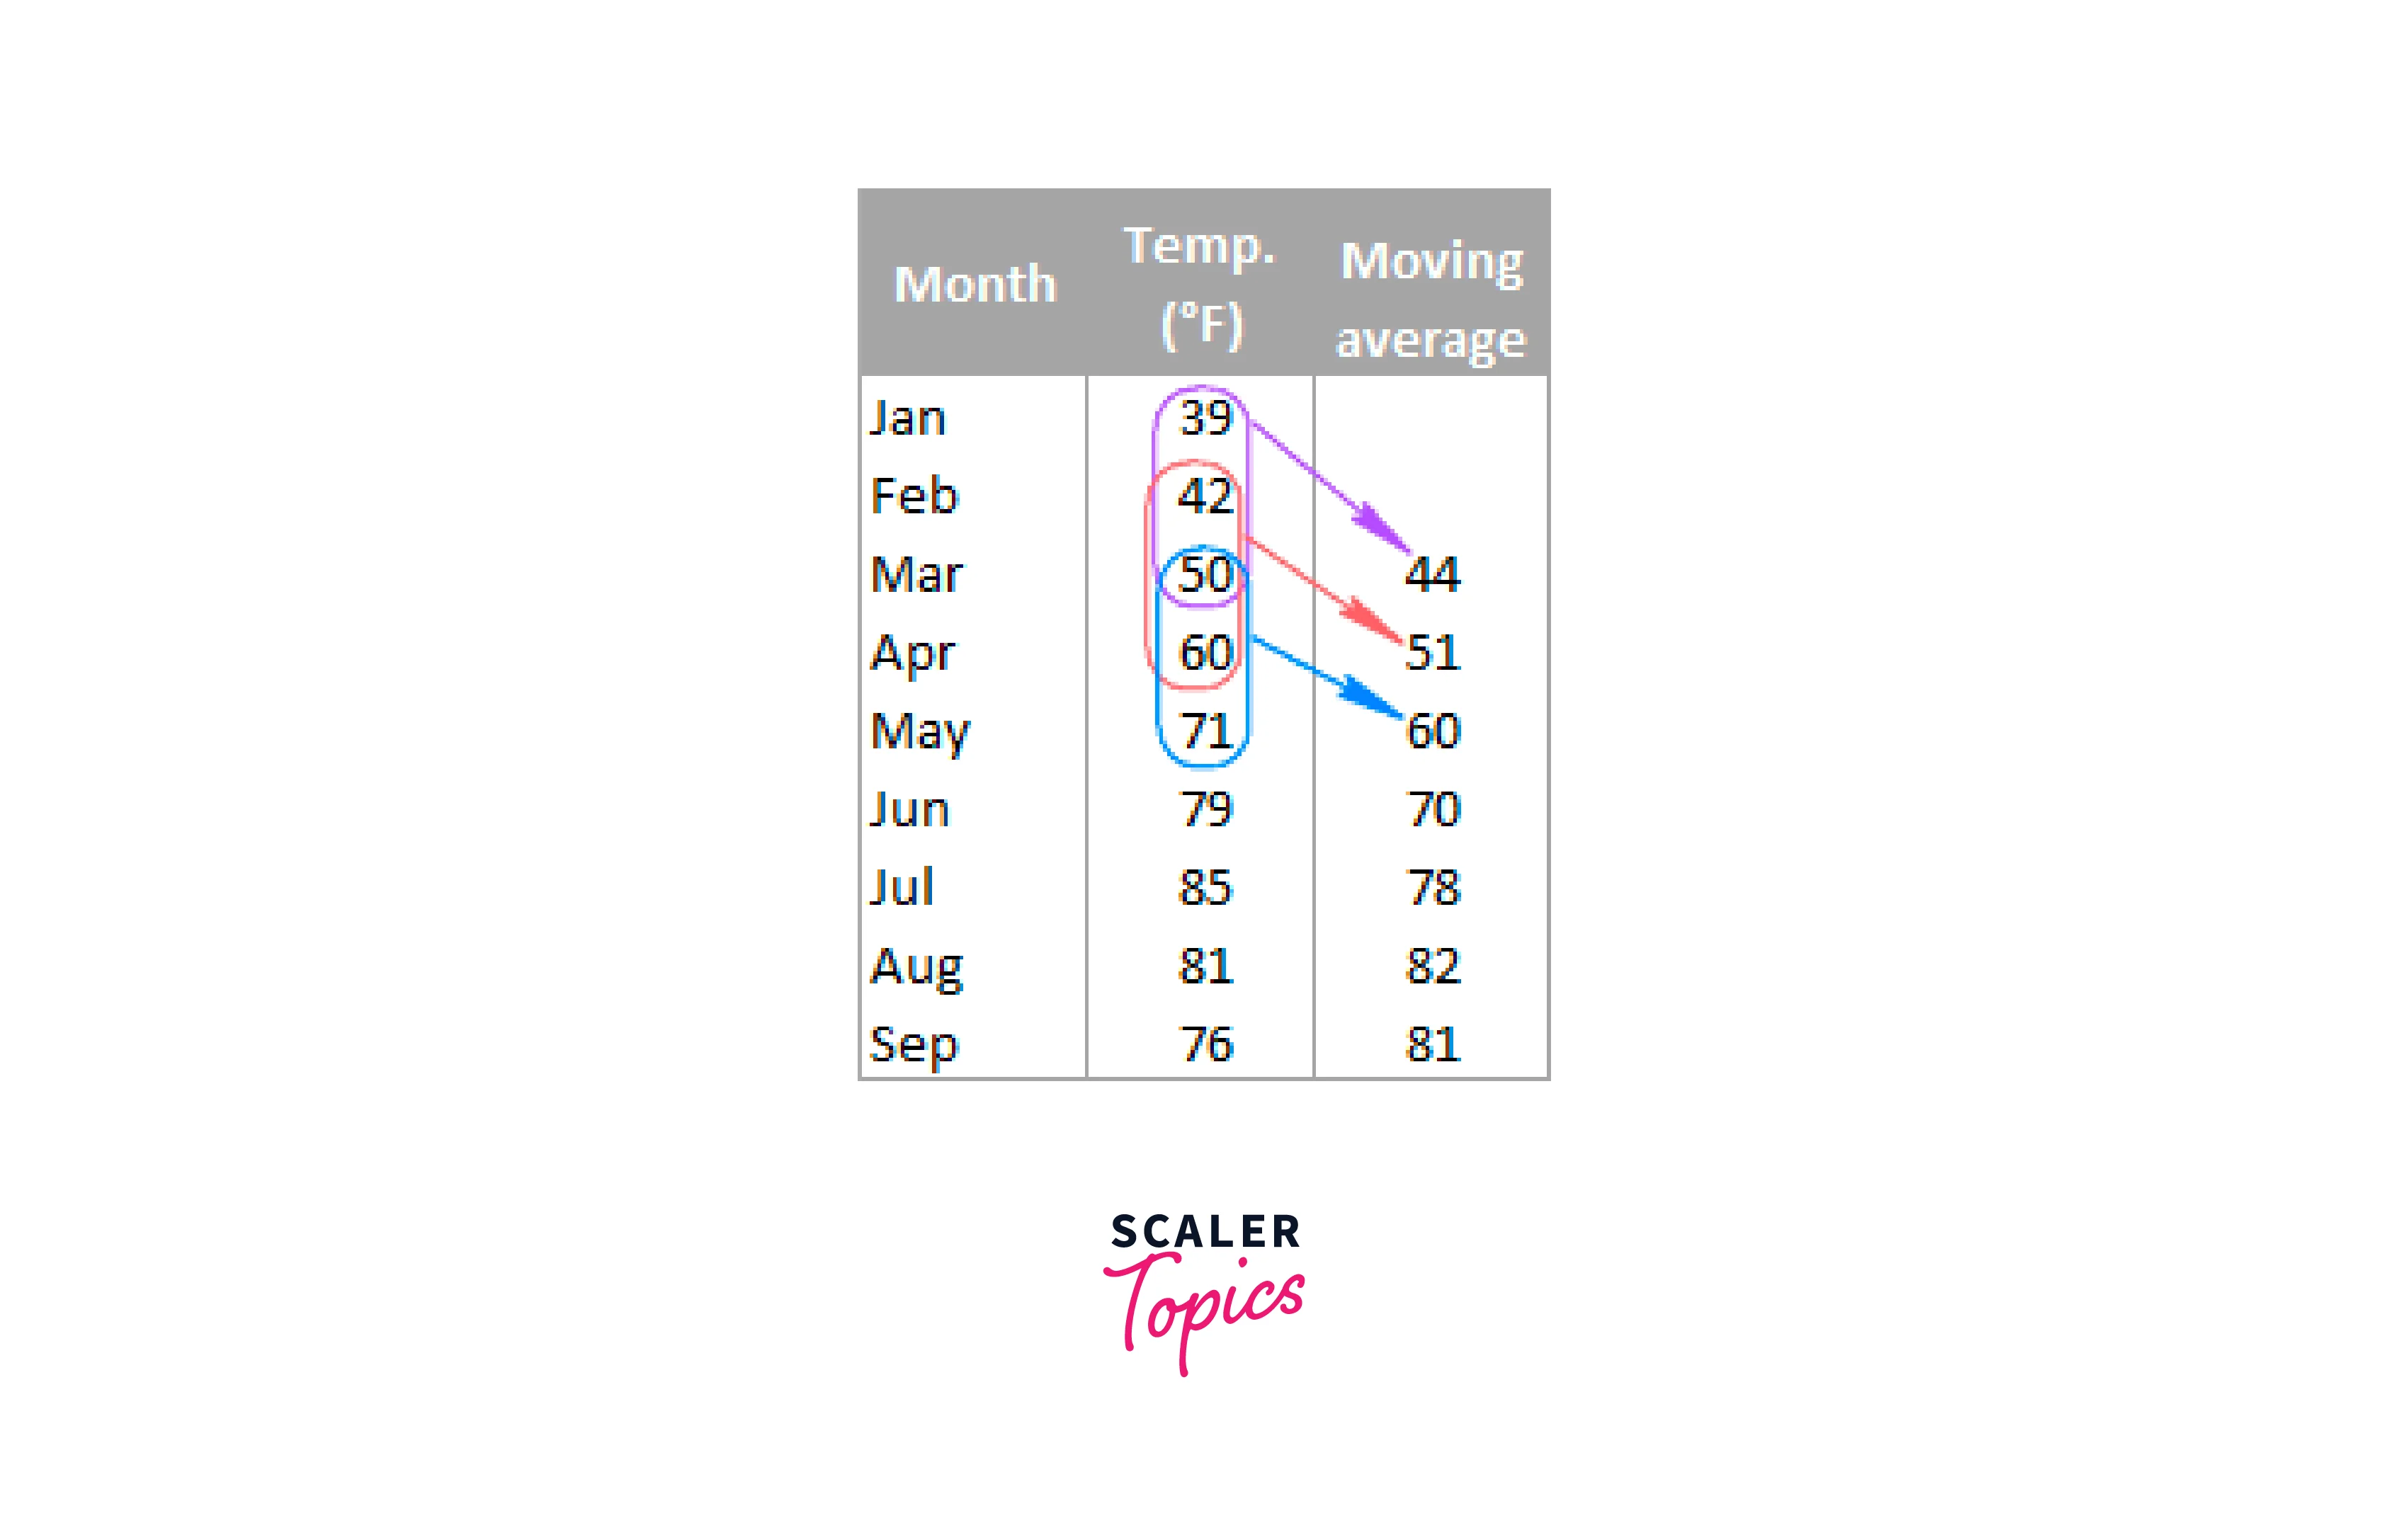
By taking the Excel moving average of the temperatures from January to March, the average of the temperatures from February to April, the average of the temperatures from March to May, and so on, it is possible to compute the moving average of the three-month temperatures.
Why Calculate Excel Moving Average?
An Excel moving average can be calculated for to following reasons:






1. Frequently Updating Average Pricing
Excel is a helpful tool for computing and tracking moving averages since it provides a thorough overview of many data points throughout time. You can spot uptrends or downtrends that can help you make critical observations and decisions by displaying the moving averages over specific time frames, such as every 15 days, 100 days, or 200 days. Additionally, Excel makes choosing the ideal timetable for your data purposes simpler.
2. To Reduce Data Inaccuracies Brought on By Temporary Variations
Making a moving average also reduces the impact of short-term volatility on average values. Technical analysts, financial analysts, and data specialists may conclude instead of more reliable data and patterns. This may reduce the hazards brought on by atypical data points. Moving averages simplify data filtering and allow for more precise long-term observations.
Scaler Placement Report and Statistics
Scaler learners achieved 2.5x salary growth with average post-Scaler CTC reaching ₹23L.
 Google
 Amazon
 Microsoft
 Flipkart
 Adobe1200+ more
3. To Detect Shifts in a Security's Momentum
Analysts frequently examine moving averages to spot shifts in the momentum of assets. They can identify abrupt shifts or downward trends by observing patterns in price movement. For instance, they might check stock prices to see if they increase above the 200-day average. If they do, that can indicate a change in price tendency, commonly known as a bullish trend.
Calculate the Excel Moving Average for a Certain Period
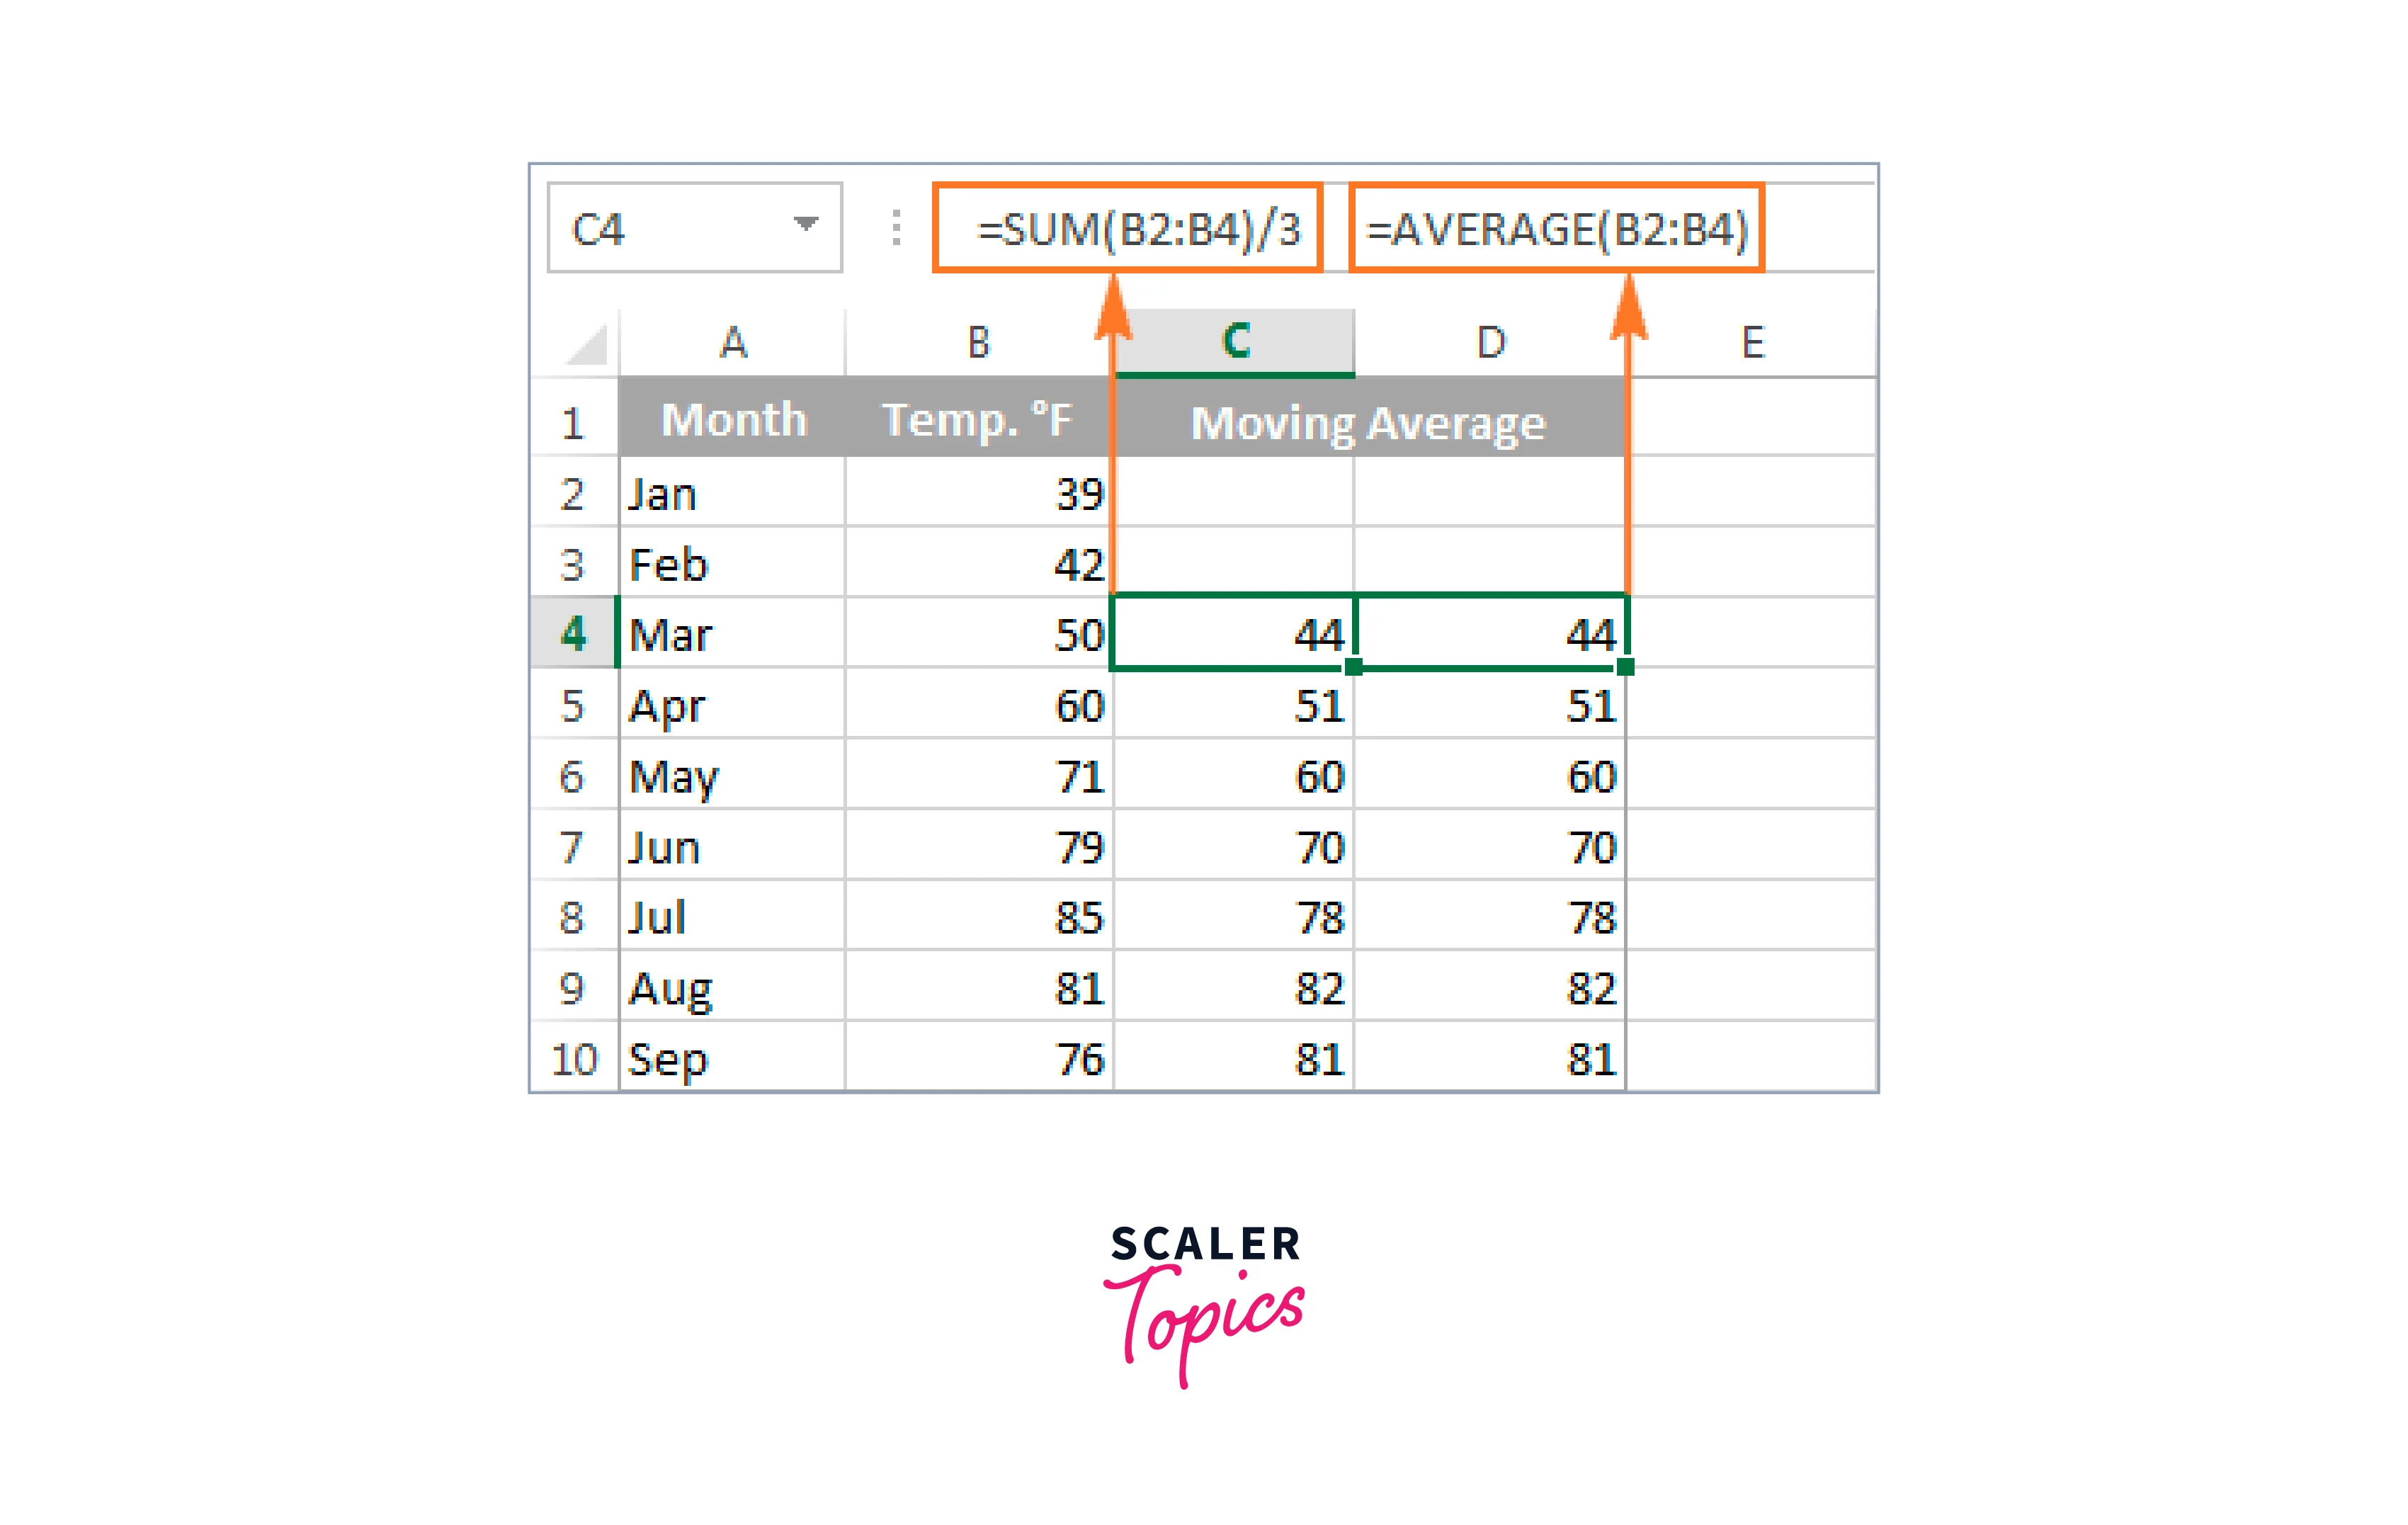
The AVERAGE function makes calculating the simple moving average quick and easy. Let's say you want to get a moving average for three months (as shown in the figure above) for a list of average monthly temperatures in column B.
In the row corresponding to the third number from the top (cell C4 in this example), enter a standard AVERAGE formula for the first three values, and then replicate the formula down to other cells in the column:
If you want, you can set the row with a relative row reference (without the $ symbol) so that the formula will change correctly for other cells. In addition, you can fix the column with an absolute reference (like $B2) if you like.
You can check the outcome by using the SUM formula, keeping in mind that an average is calculated by adding up values and then dividing the sum by the number of items to be averaged:
Turn Learning into Career Growth
Get the Excel Moving Average for the Last N Days/ Weeks/ Months/ Years in a Column
Consider a scenario in which you have a list of data, such as sales numbers or stock quotes, and you want to know the average of the previous three months at any given time. You need a formula updating the average each time you provide a value for the following month. What Excel feature can achieve this? Combining the old AVERAGE with OFFSET and COUNT.
N denotes how many of the most recent days, weeks, months, or years should be included in the average.
Have trouble figuring out how to use this moving average method in your Excel worksheets? The example that follows will help to clarify things.
The calculation would be as follows, assuming that the numbers to average are in column B, starting in row 2.
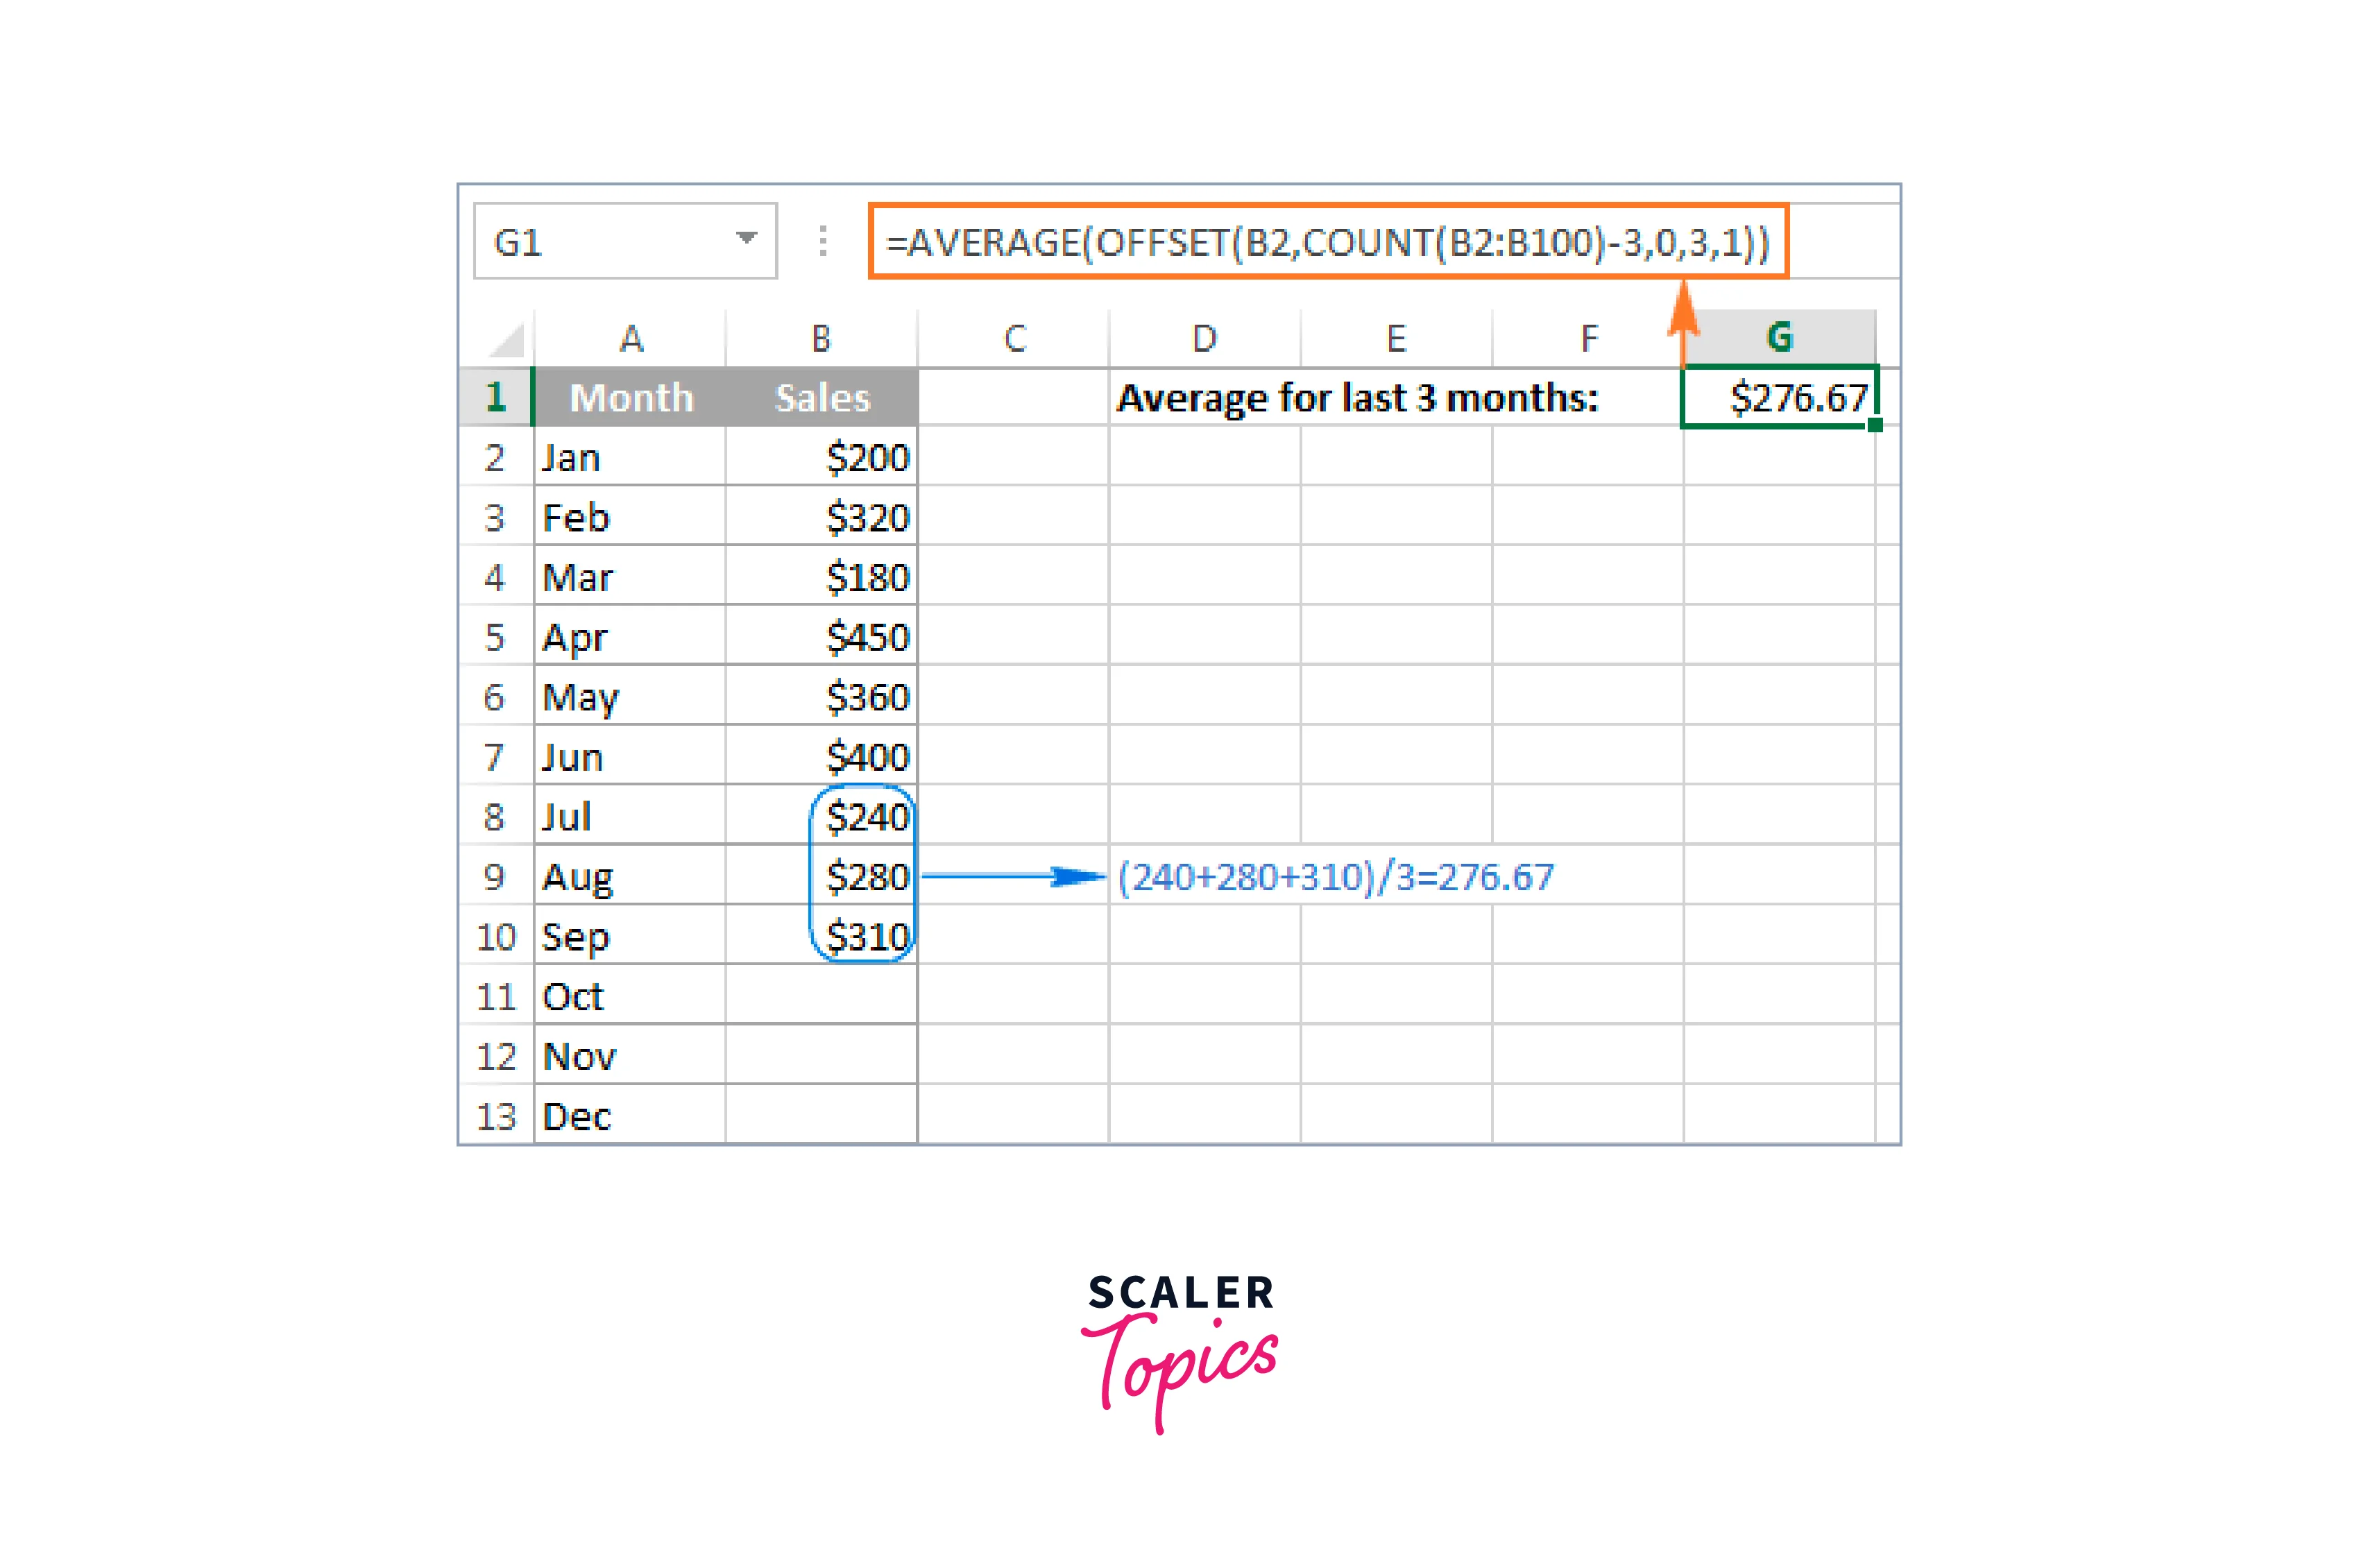
Let's now attempt to understand the true function of this Excel moving average calculation.
-
How many values have already been input in column B is counted using the COUNT function COUNT(B2:B100). Since row 1 is the column header, we begin counting in column B2.
-
The COUNT function returns a result that is offset by the OFFSET function by shifting the count up to 3 rows (-3 in the second argument) starting at cell B2 (the first argument). As a result, it returns the total values for the most recent three months, which are included in a range with three rows (three in the fourth parameter) and one column (one in the last argument). The returned sum is then used to construct the moving average using the AVERAGE function.
Tip:
Make sure to give the COUNT function enough rows to handle potential new entries if you're working with continuously updating worksheets where additional rows will probably be added in the future. As long as the initial cell is correct, it is not a problem if you include more rows than are required because the COUNT function will remove any empty rows.
As you probably noted, the table in this example only contains data for one year, but just to be safe, the range B2:B100 is passed to COUNT.
Find the Excel Moving Average for the Last N Values in a Row
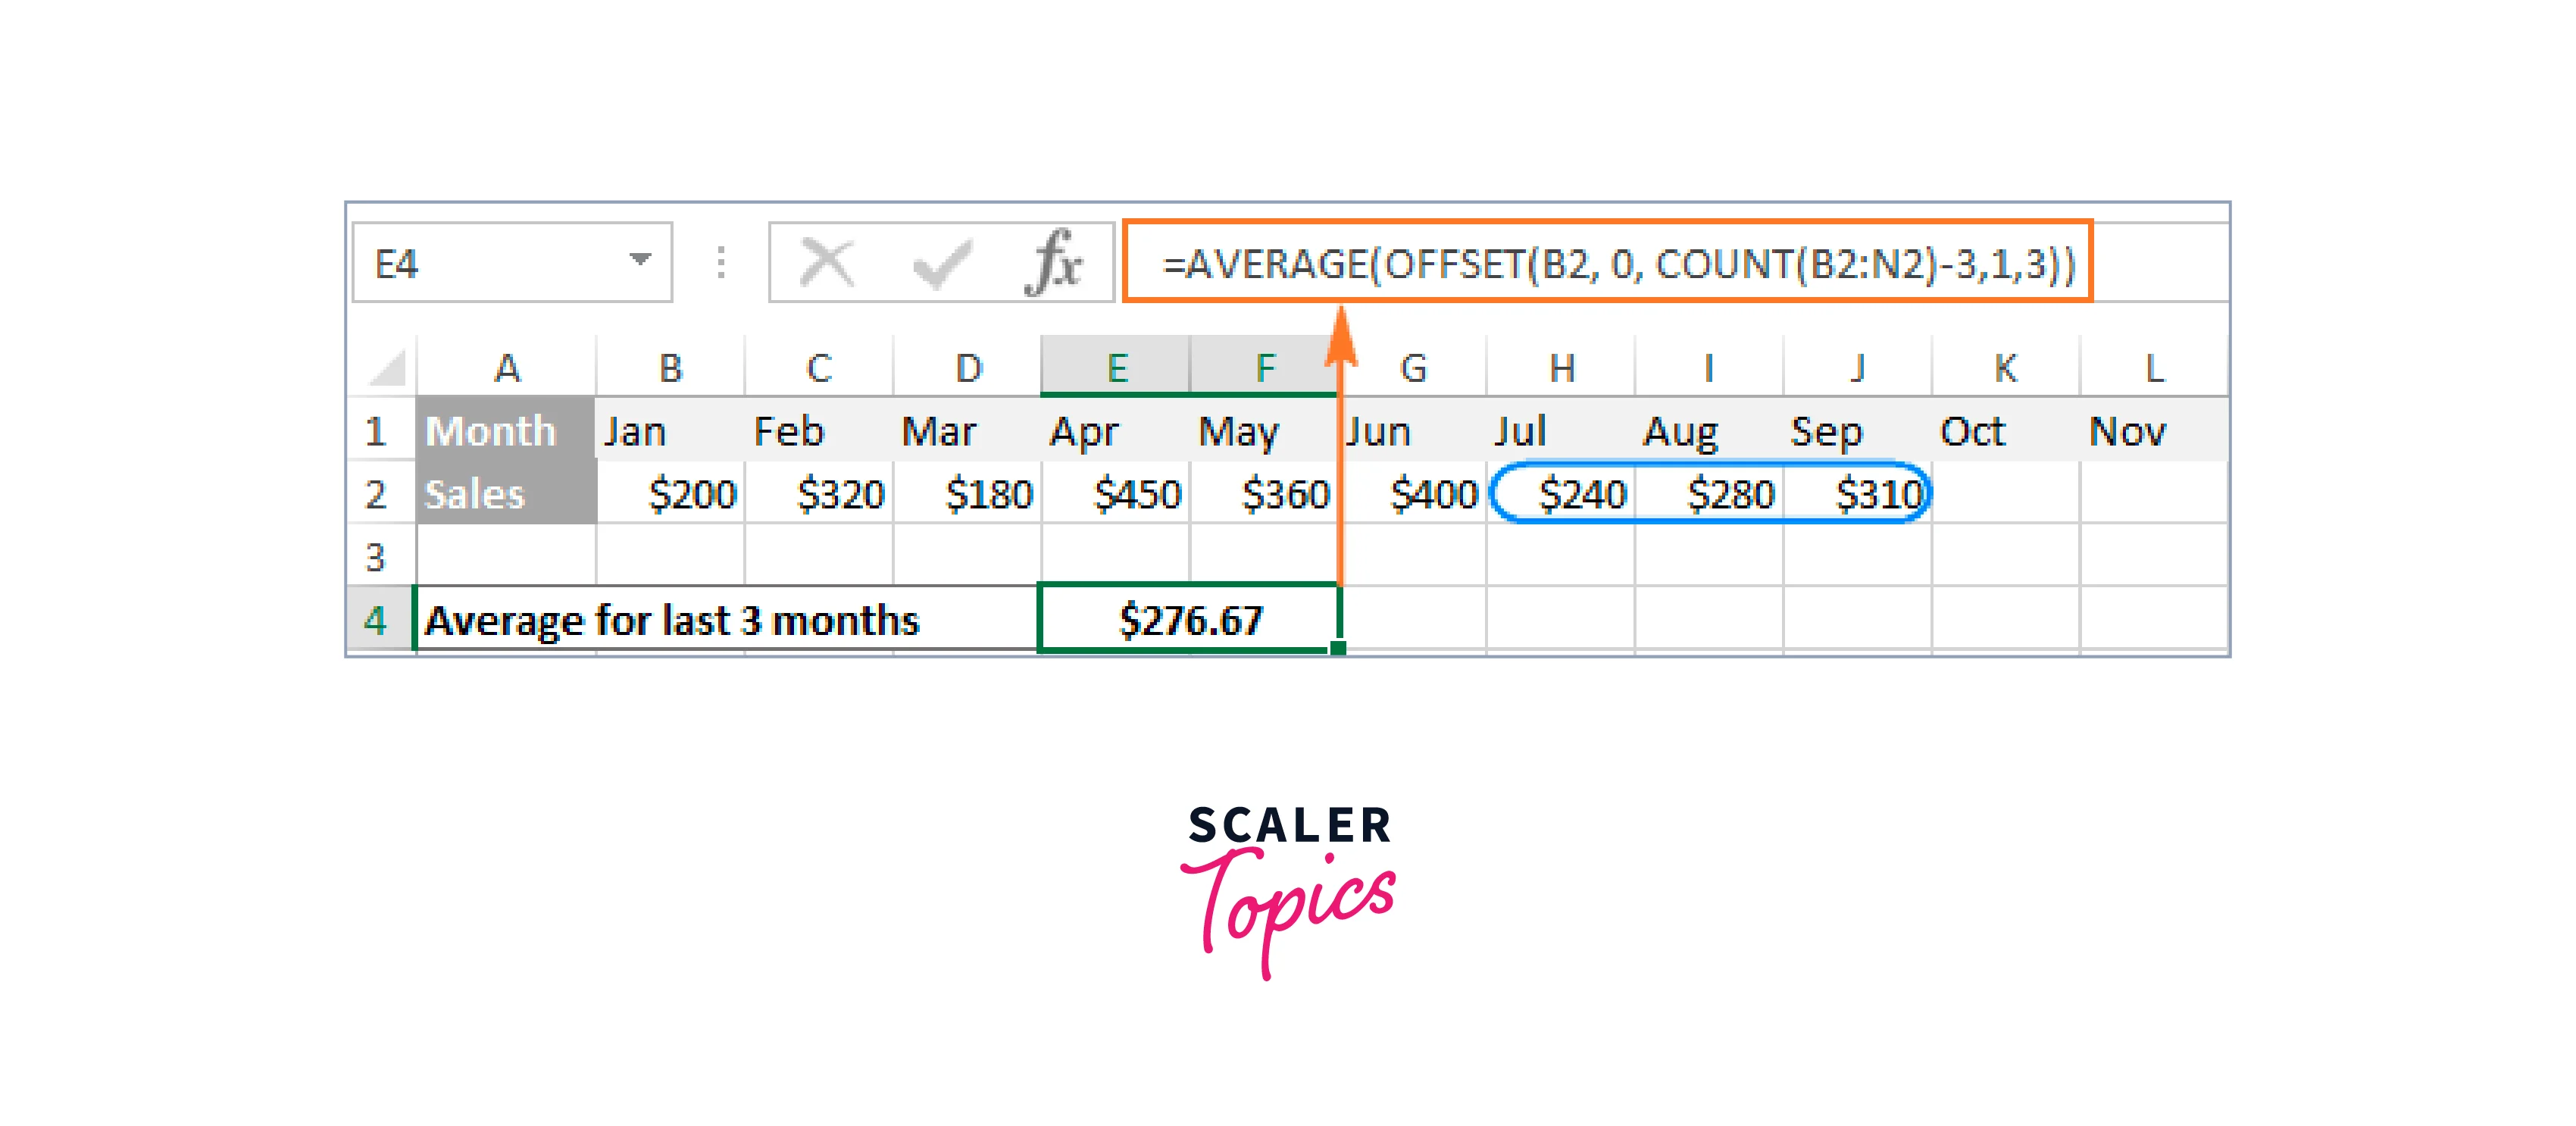
The Offset method can be changed in the following ways if you wish to calculate a moving average for the most recent N days, months, years, etc., in the same row:
The formula looks like this if B2 is the first number in the row and you want to include the last three values in the average:
Creating an Excel Moving Average Chart
Adding an Excel moving average trendline to a chart you've already made for your data only takes a few seconds. The specific methods are listed below, and we'll use Excel's Trendline function.
For this example, I've made a 2-D column chart for our sales data using the Insert tab > Charts group:
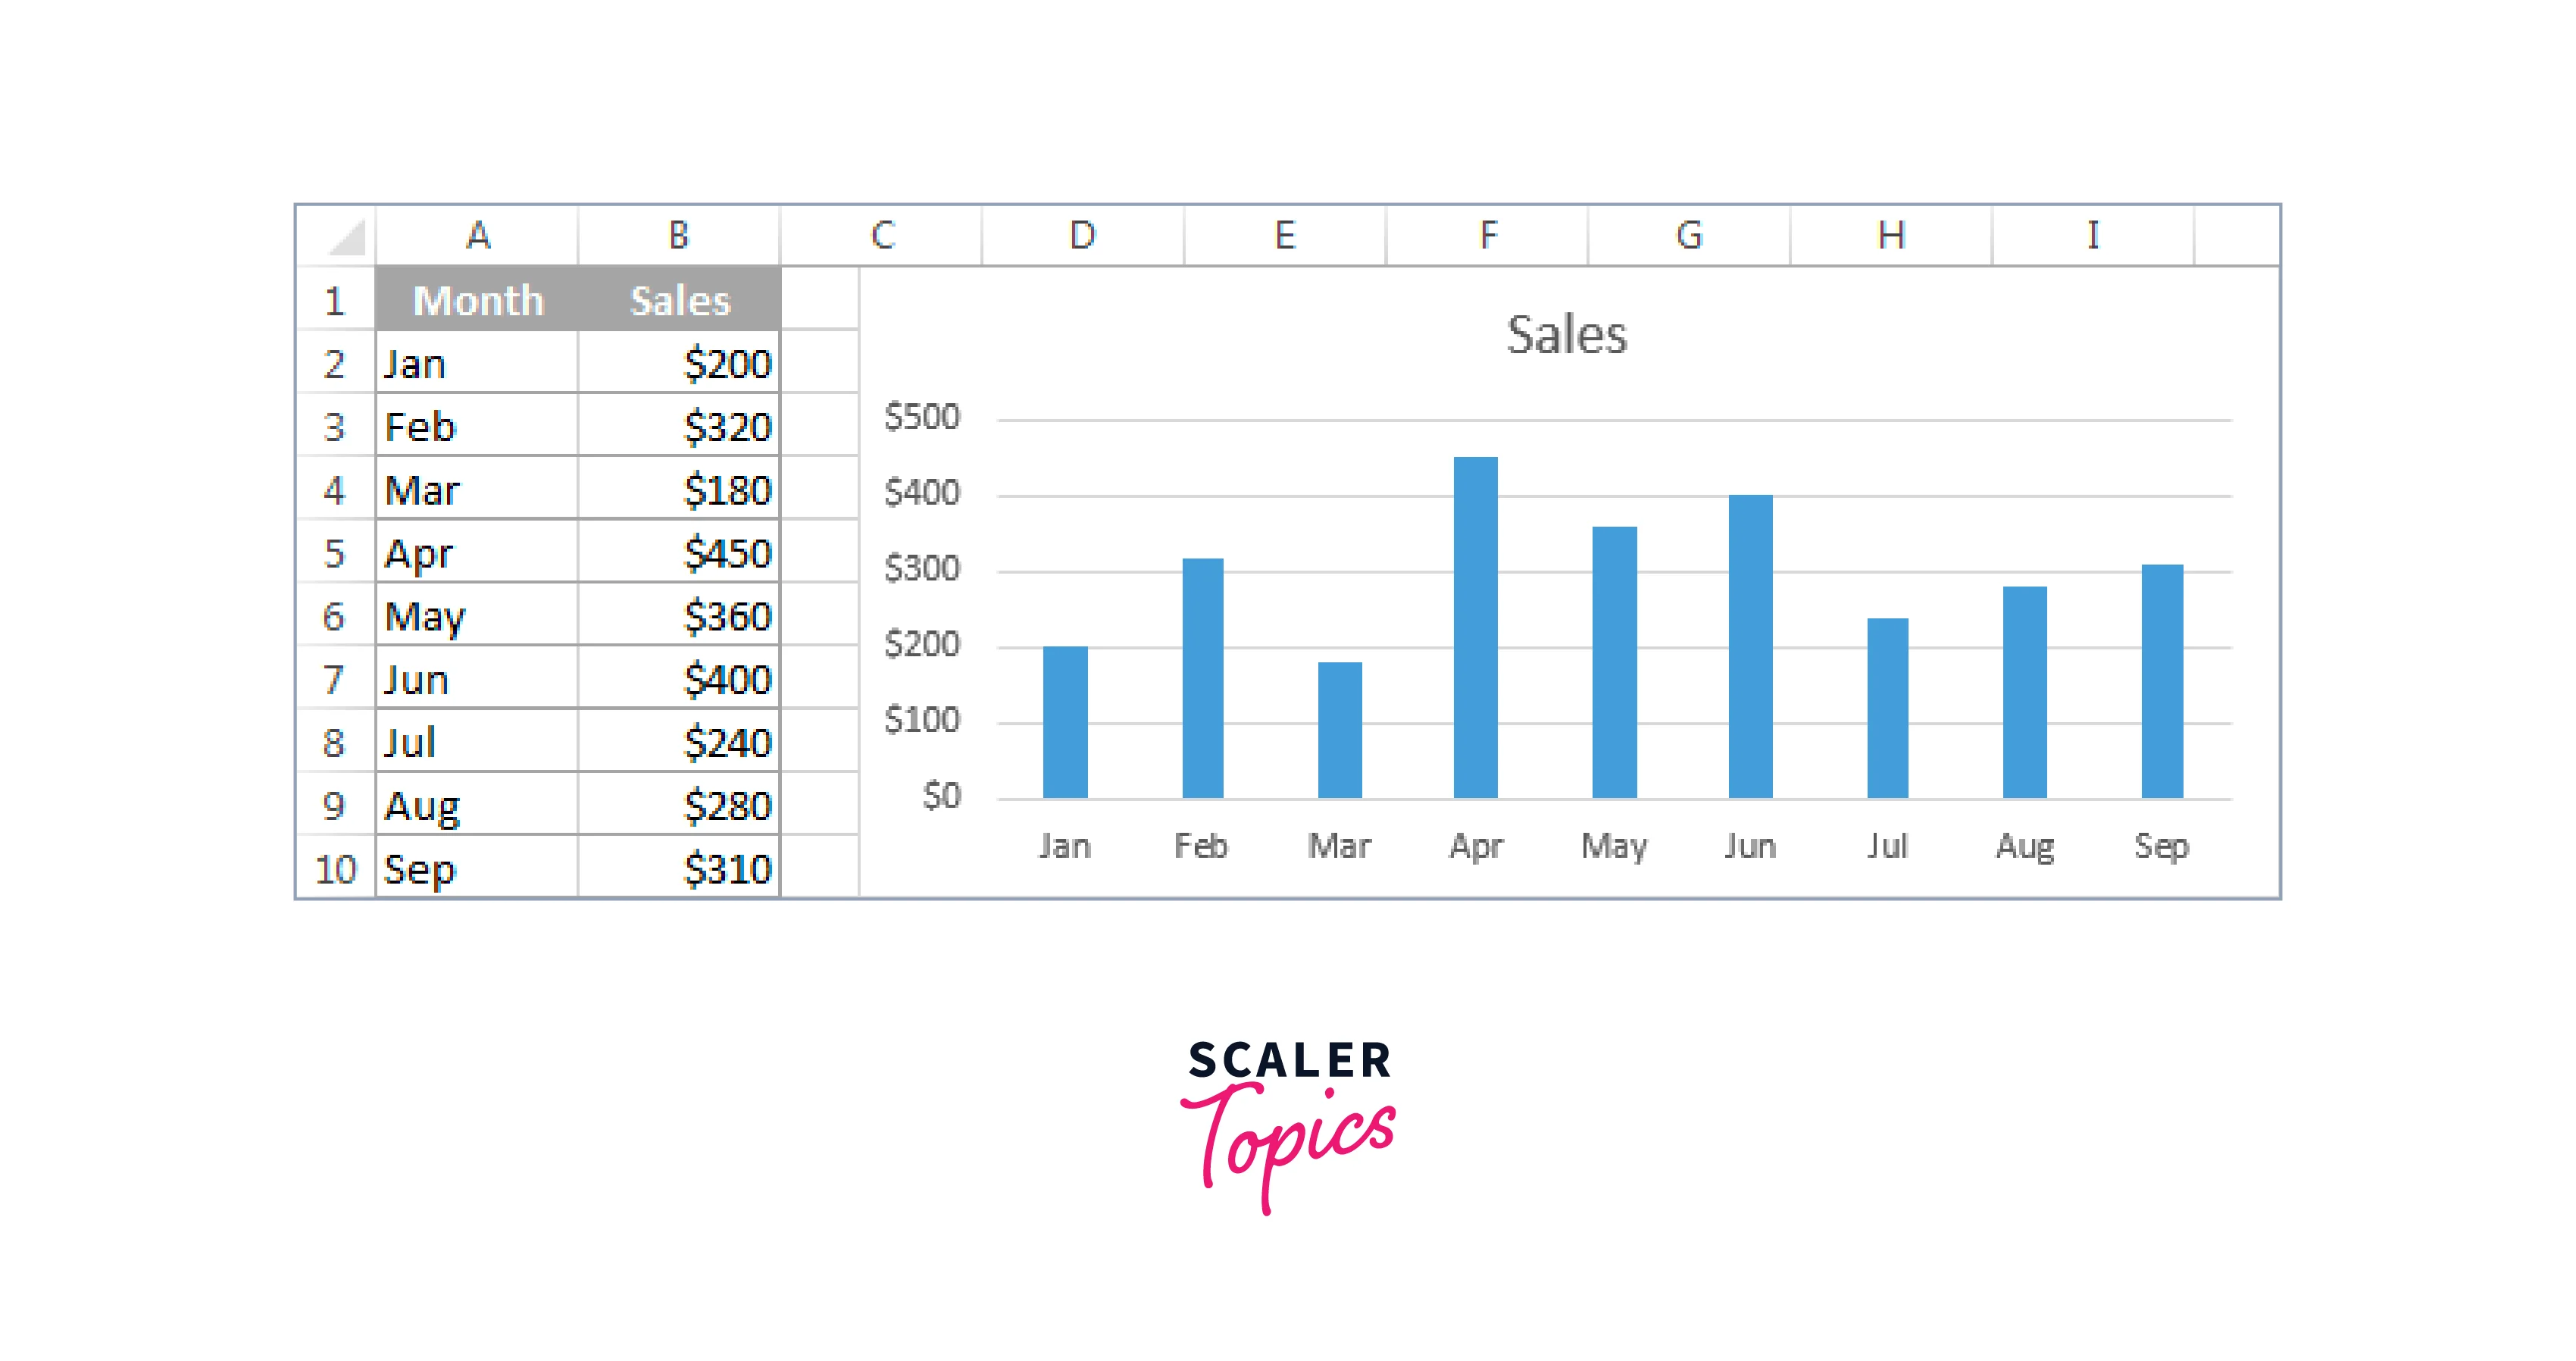
We now wish to "visualize" the moving average over the previous three months.
In Excel 2013, choose the chart, then click Add Chart Element > Trendline > More Trendline Options under the Design tab > Chart Layouts group.
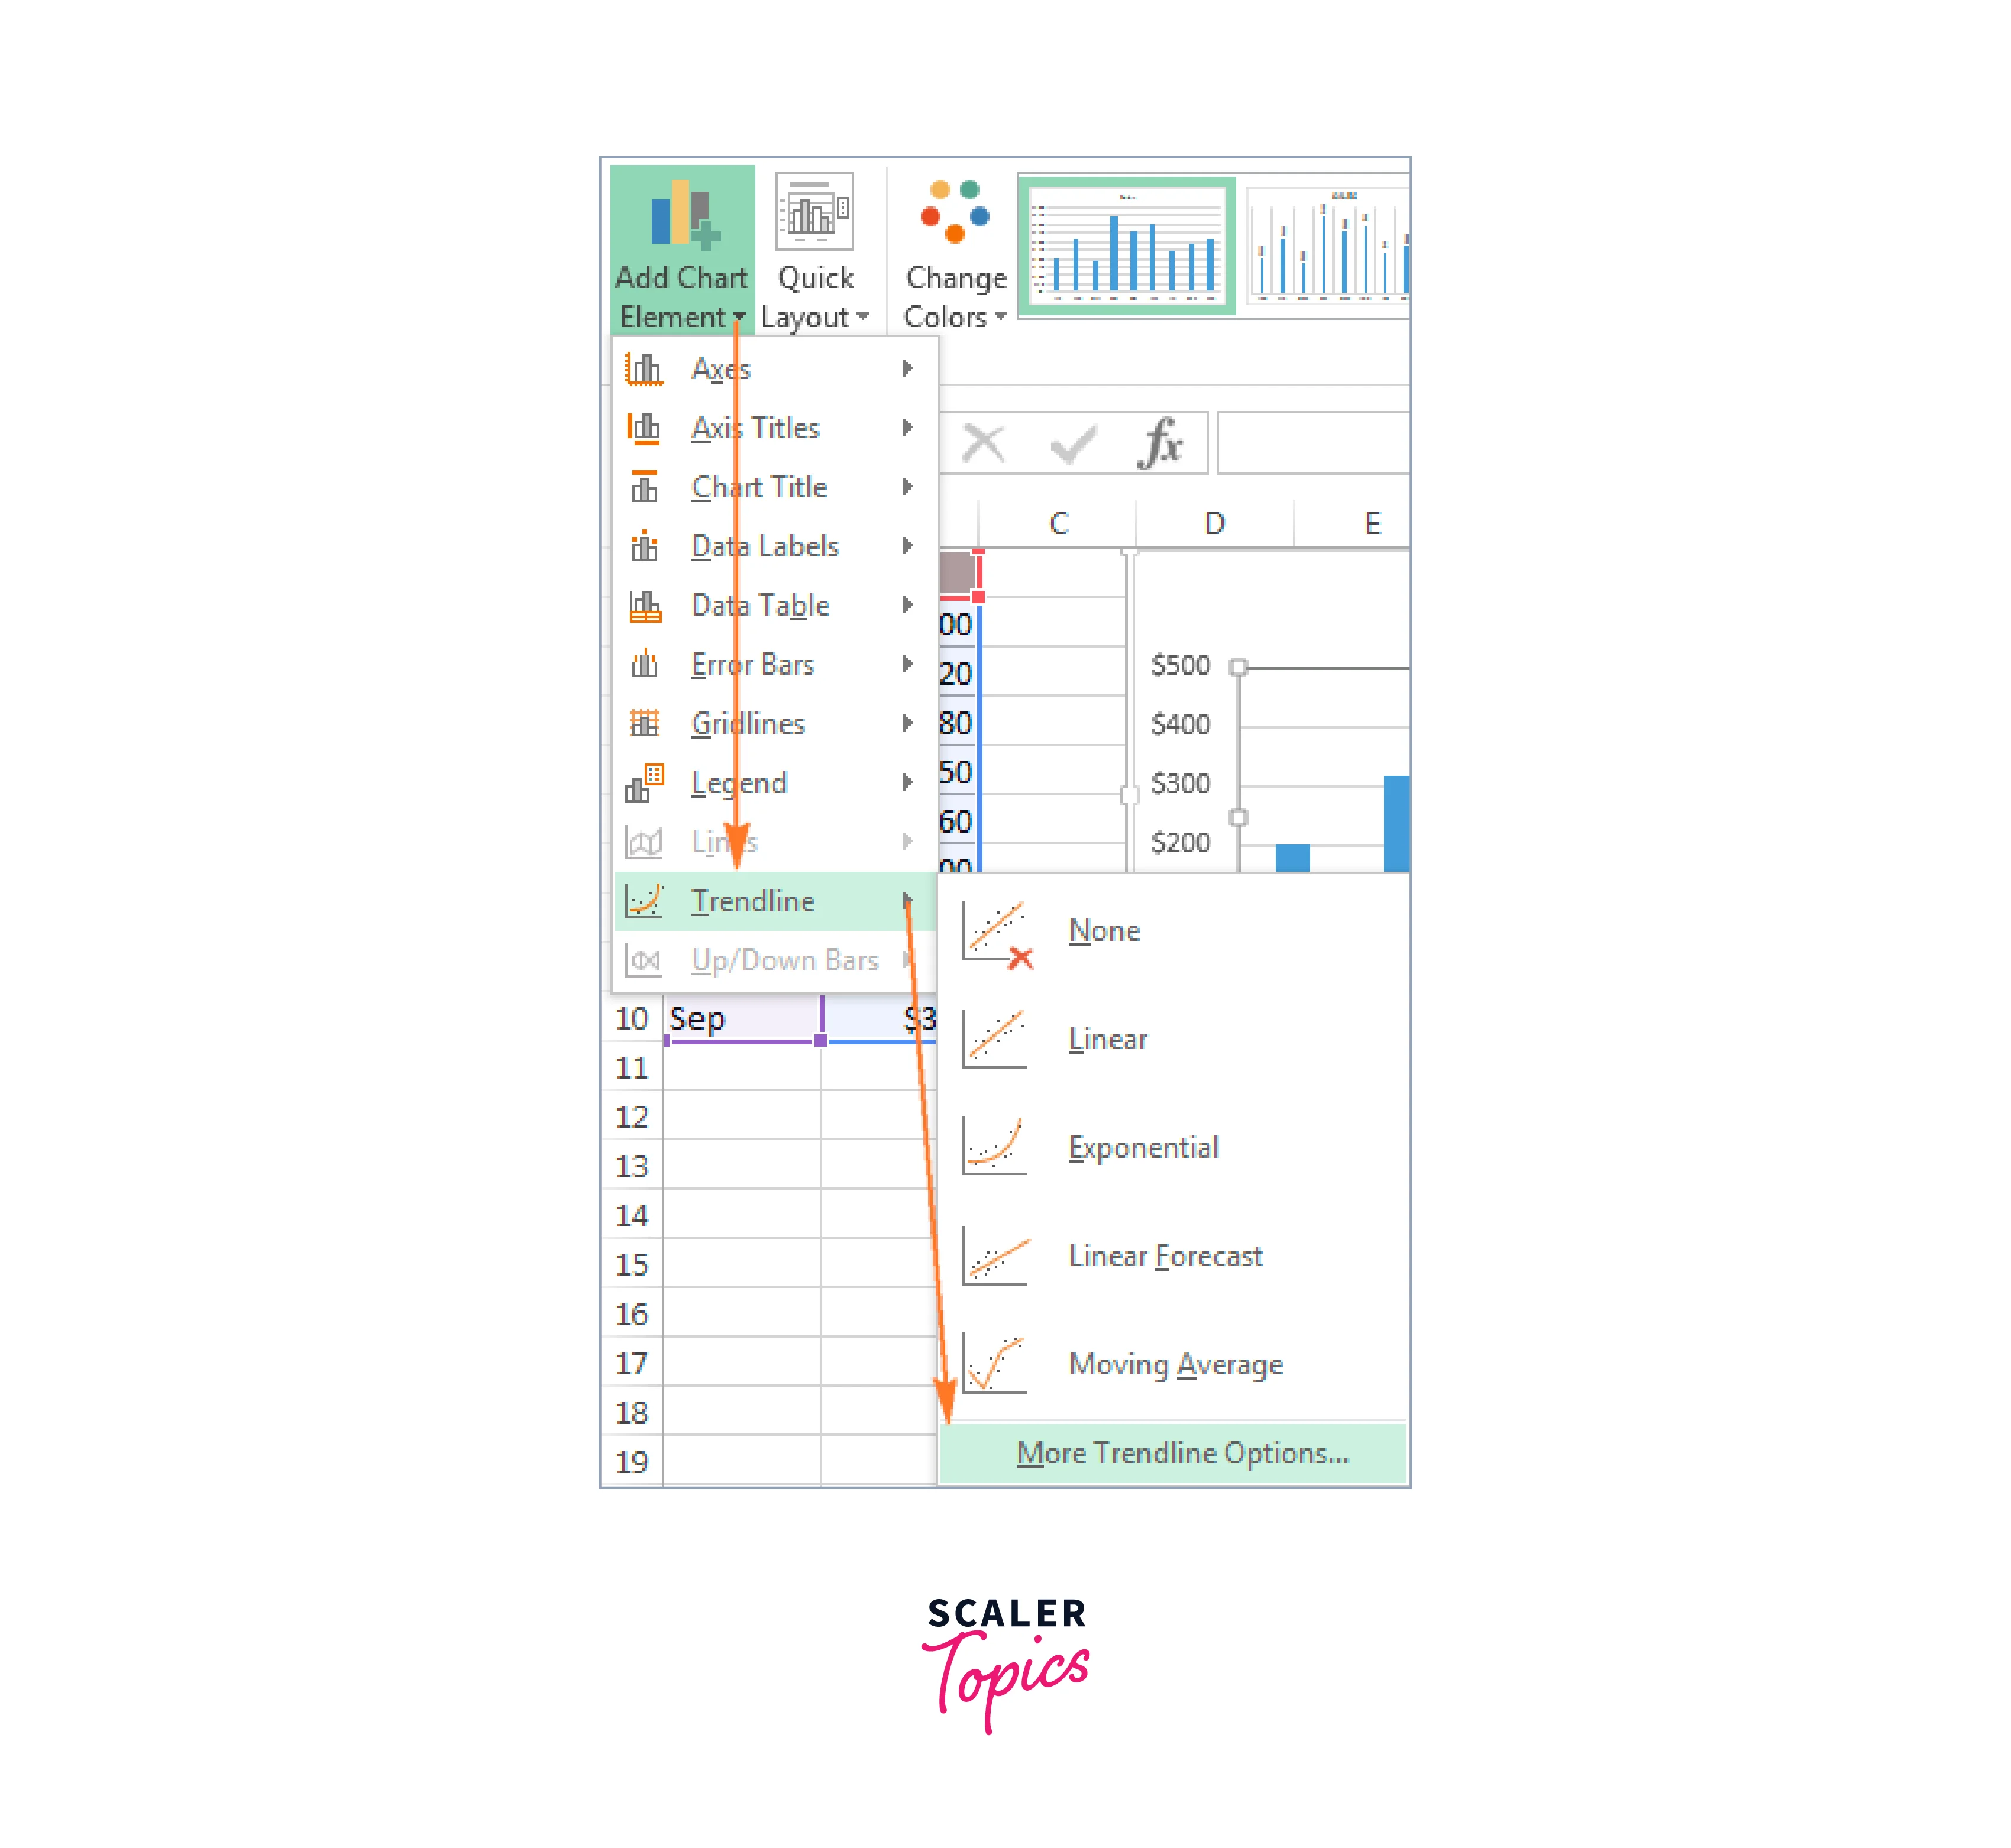
Go to Layout > Trendline > More Trendline Options in Excel 2010 and Excel 2007.
Guidelines:
To get an immediate result, choose Design > Add Chart Element > Trendline > Moving Average if you don't need to give specifics like the moving average interval or names.
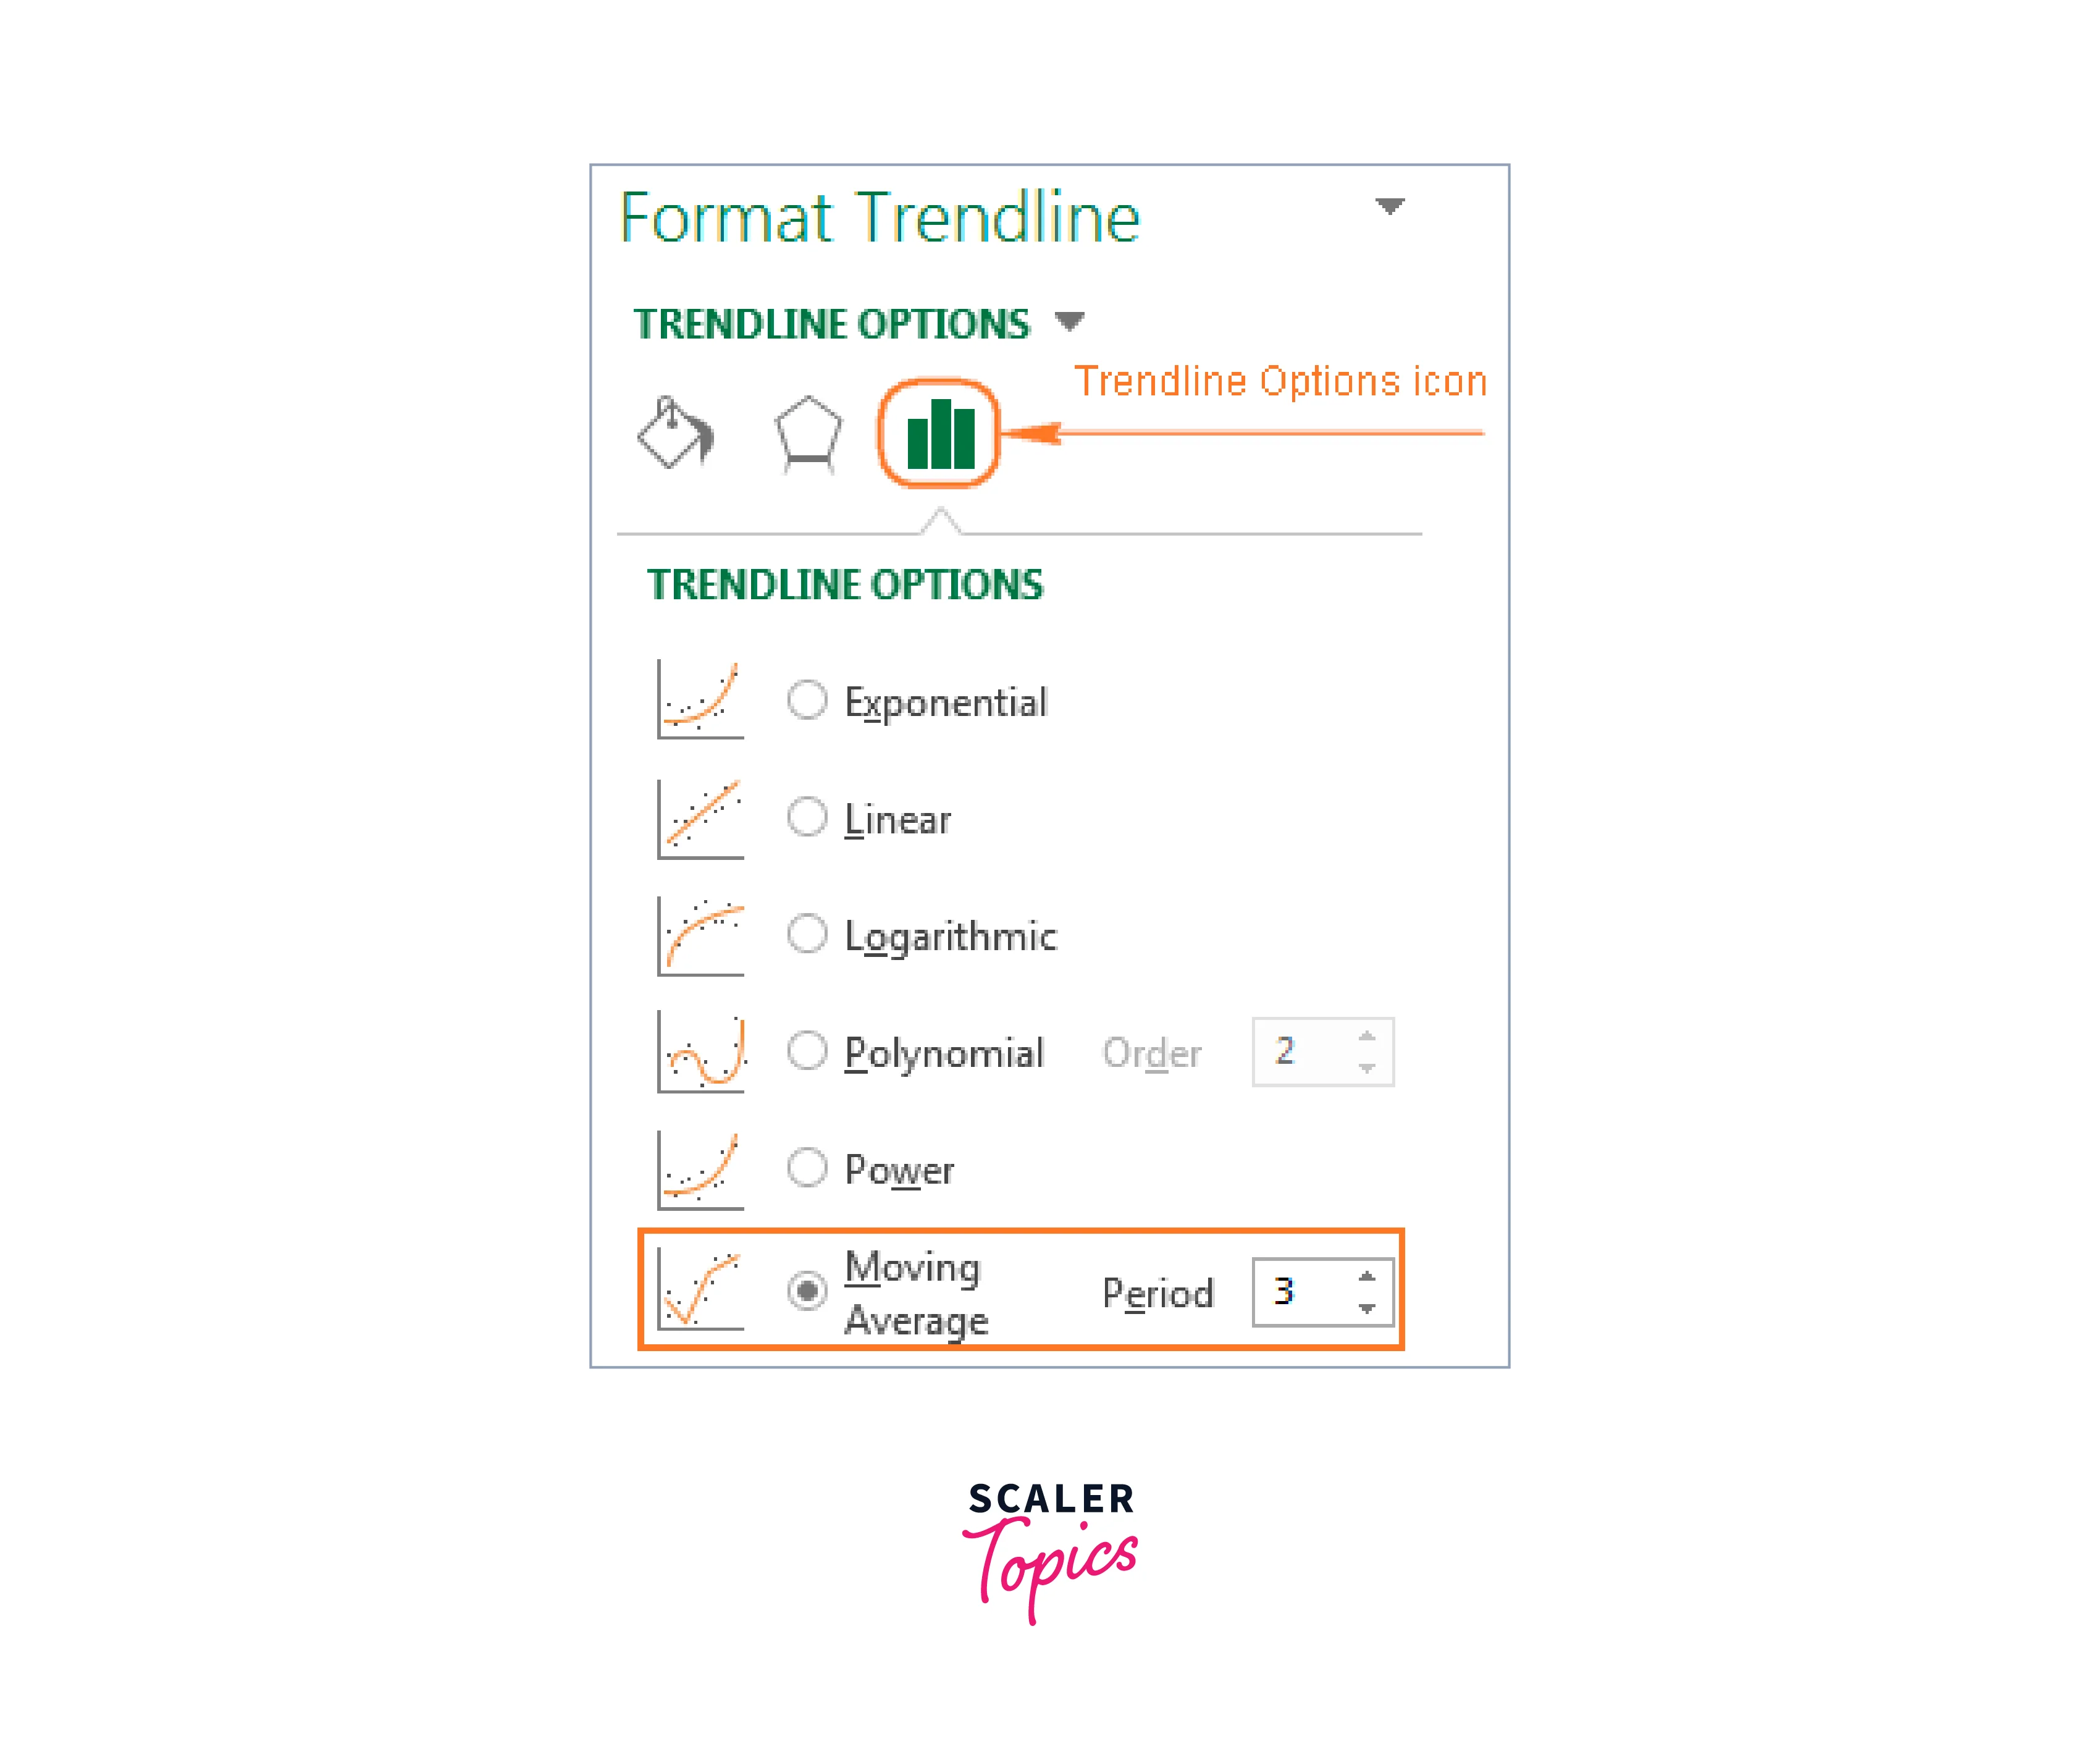
In Excel 2013, the Format Trendline pane will appear on the right side of your worksheet, and in Excel 2010 and 2007, the appropriate dialogue box will appear.
You click the Trendline Options button on the Format Trendline window, choose the Moving Average option, and enter the moving average interval into the Period box:
-
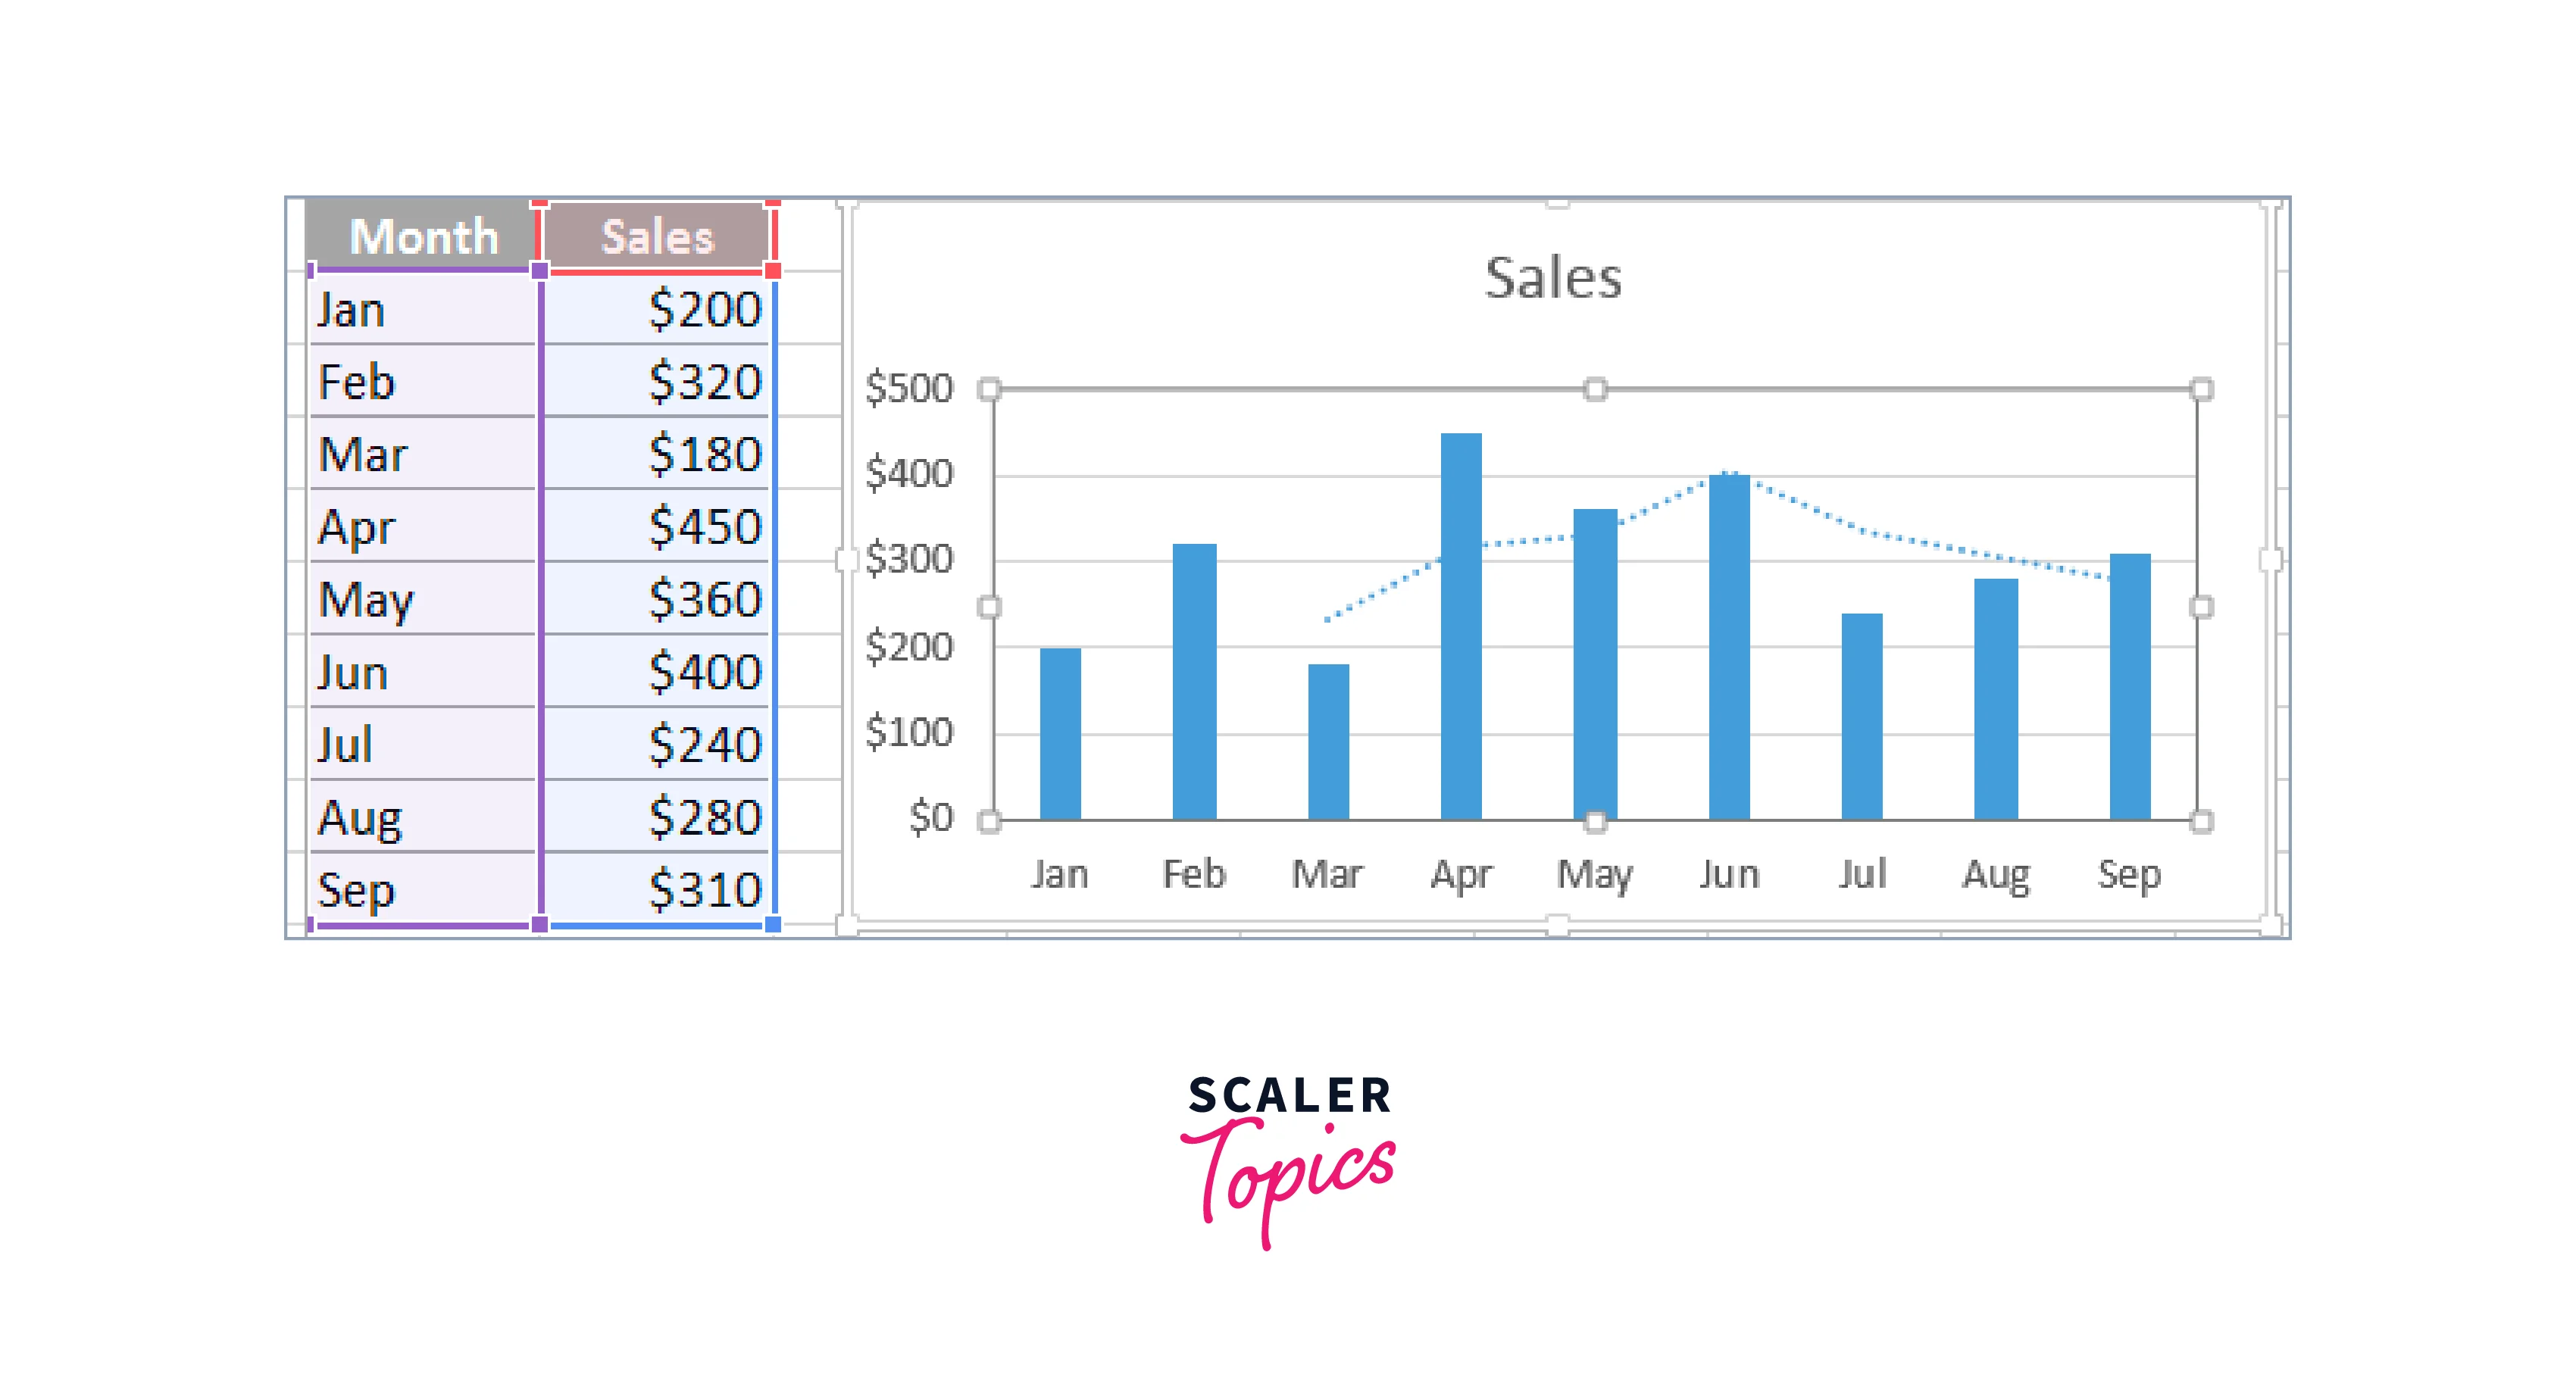
The moving average trendline has been added to your chart; simply close the Trendline tab to see it.
-
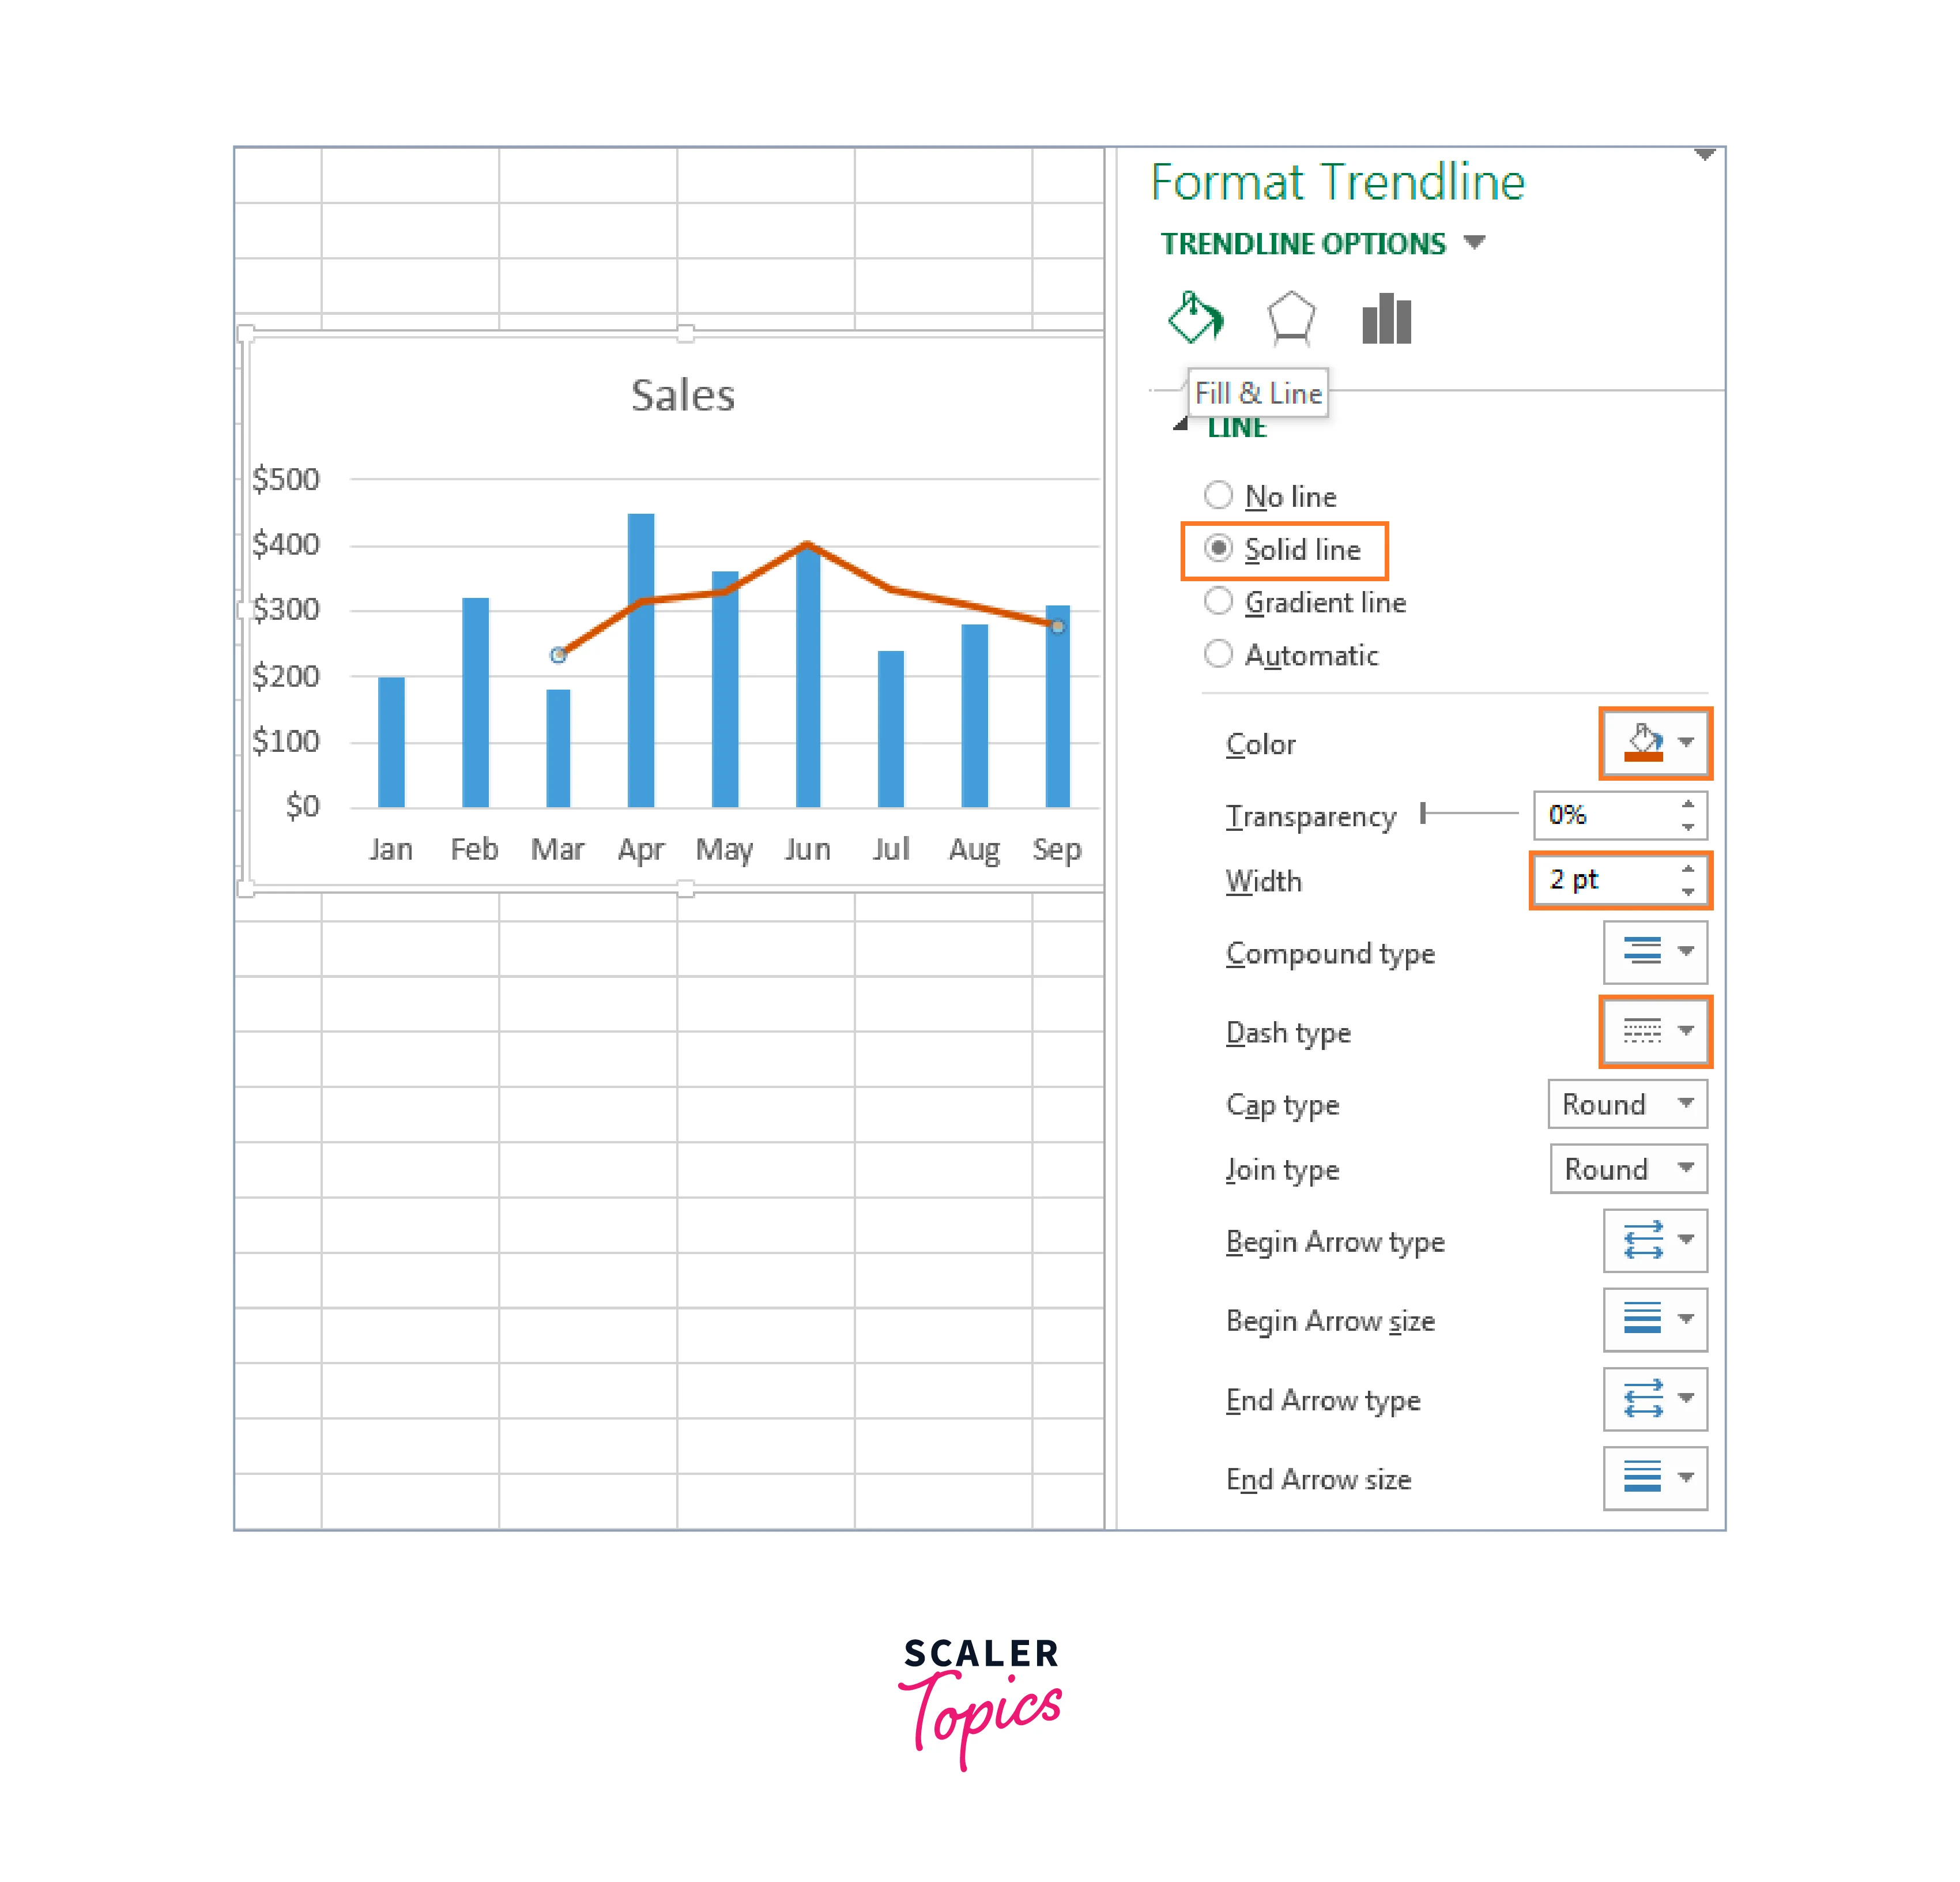
You may play around with different options, including line type, color, and width, by switching to the Fill & Line or Effects tab on the Format Trendline window and refining your chat.
-
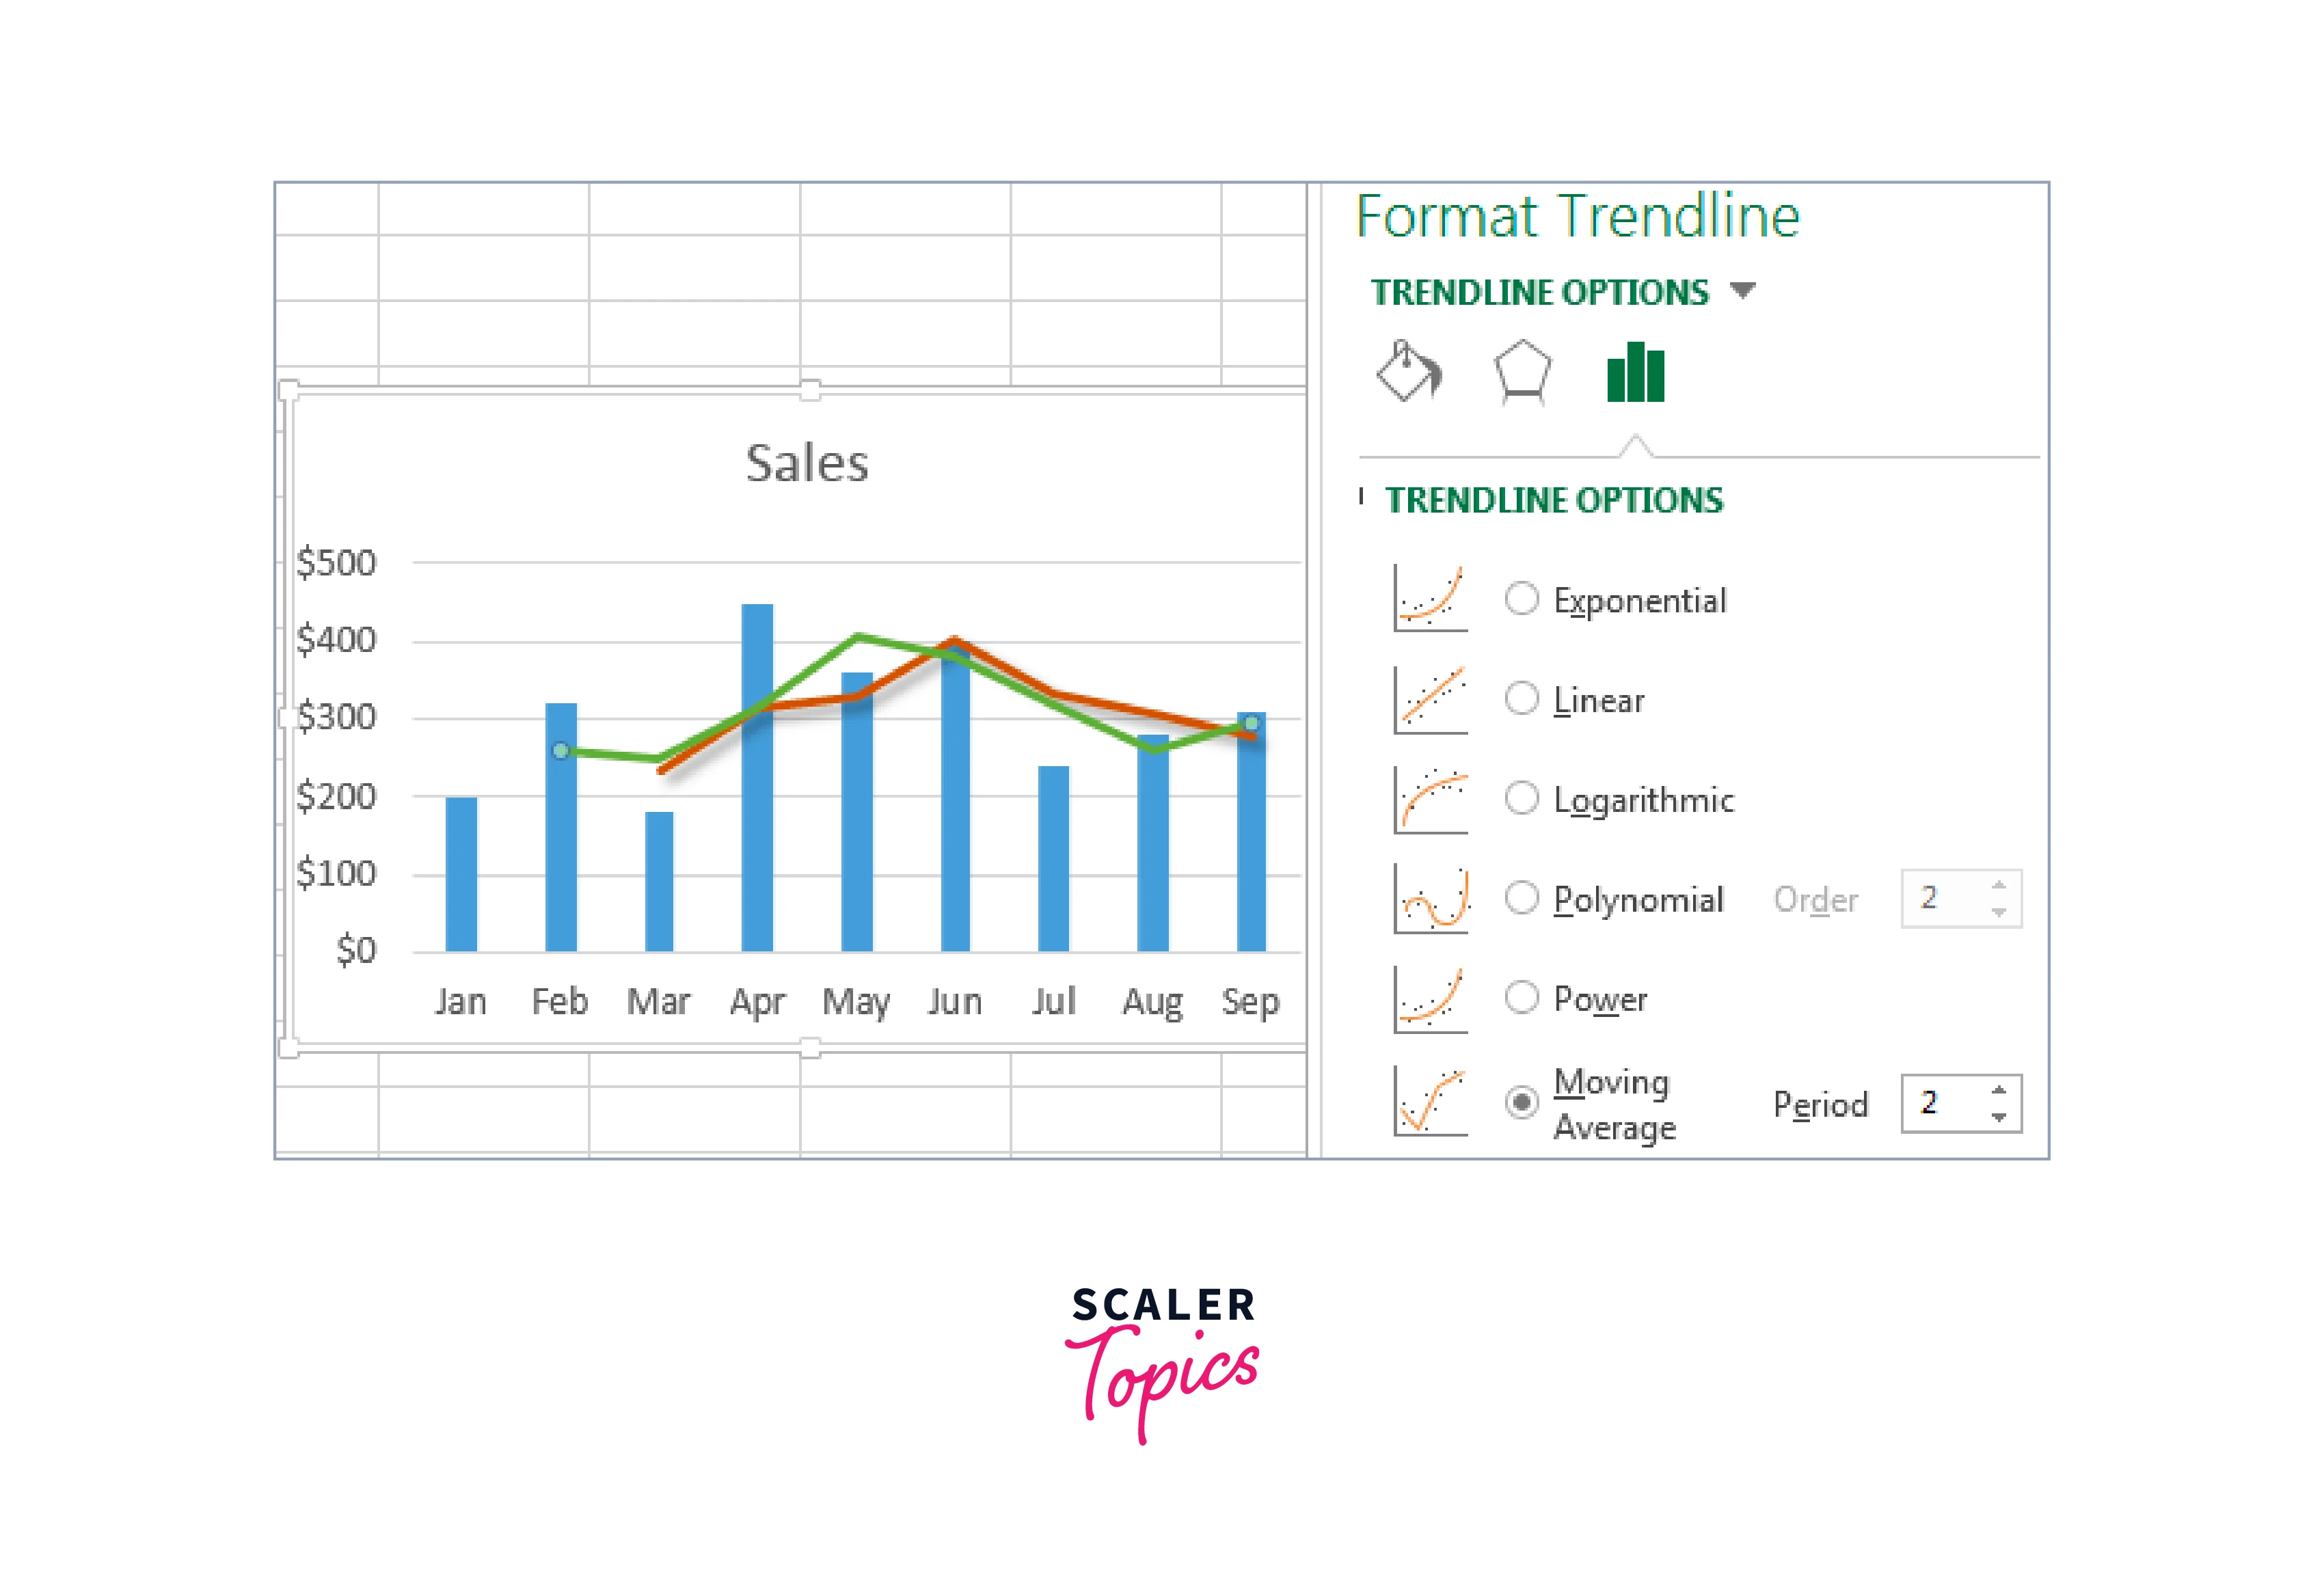
You could wish to add a few moving average trend lines with various time intervals to your data for more effective data analysis to show how the trend changes over time. The 2-month (green) and 3-month (brick red) moving average trend lines are displayed in the following screenshot:
Conclusion
- Excel moving averages are essential tools for statistical analysis and forecasting. They help in smoothing out data to identify underlying trends, making them crucial in areas like finance, sales, and process control.
- Excel facilitates the calculation of moving averages for any given period, and also for the last N days, weeks, months, or years. This flexibility allows users to create tailored analyses to suit specific requirements.
- With Excel's functionality, it's possible to find the moving average for the last N values in a row, offering dynamic insight into data trends.
- Excel also enables users to create moving average charts, a feature that enhances data visualization and aids in the interpretation and presentation of results.
- In conclusion, Excel's robust and flexible features make it an excellent choice for calculating moving averages, allowing users to derive valuable insights from their data.