Financial Projections- What If Scenario Analysis in Excel
Overview
Excel is a powerful tool that can turn numbers into meaningful insights. By creating financial projections in Excel, you can easily transform a blank spreadsheet into a crystal ball, forecasting future profits and losses. The future becomes less mysterious and more manageable with each formula and pivot table.
What if analysis in Excel is a powerful tool that allows users to explore various scenarios and their potential impact on financial outcomes. By changing inputs and assumptions, users can see how different decisions and market factors may affect their bottom line, allowing for more informed decision-making.
What Are We Building
To build a what-if analysis in Excel:
- Identify the variables that may affect your financial projections, such as sales, expenses, and interest rates.
- Create a baseline financial model and input the variables.
- Use Excel's built-in tools, such as data tables, scenarios, and Goal Seek, to simulate various scenarios and analyze their impact on your financial outcomes.
- Review the results and use them to inform your decision-making process.
Imagine you are the captain of a ship, navigating through a treacherous sea of uncertainty. One wrong move could lead to disaster, but you can chart a course to success with the right tools. That's where Excel's what-if scenario analysis comes in.
Think of Excel as your trusty compass, allowing you to input various scenarios and see how they impact your destination. Like adjusting your sail to catch the wind, you can adjust your inputs and see how they affect your outcomes. With the click of a button, you can quickly see the ripple effect of changes, whether it be adjusting the price of a product or changing the number of resources allocated to a project.
But Excel isn't just a compass; it's also your map. With dynamic arrays and data modeling, you can plot a course with pinpoint accuracy, avoiding potential pitfalls. And with powerful visualization tools like Power BI, you can even see your journey in real-time, with charts and graphs that update as you adjust your inputs.
As you sail on, Excel continues evolving with cloud-based services and AI integration, providing even more advanced tools to help you navigate the choppy waters of uncertainty. With Excel's what-if scenario analysis, you can steer your ship toward success, no matter the storms ahead.
Prerequisites
- What if scenario analysis
What if scenario analysis is a valuable feature of Excel financial projections, allowing users to test potential scenarios and their impact on financial outcomes. Users can simulate best-case, worst-case, and other scenarios by adjusting inputs and assumptions, helping them make informed decisions and identify potential risks and opportunities. - Types of Scenario Analysis
Several types of scenario analysis can be performed in Excel, including:- Sensitivity Analysis: This type of analysis involves changing one input variable at a time to see how it affects the output.
- Data Tables: Data tables allow you to test multiple combinations of input variables at once.
- Scenario Manager: This tool enables you to create and compare multiple scenarios with different inputs and assumptions.
- Goal Seek: This feature allows you to find the input value necessary to achieve a specific output value.
- Monte Carlo Simulation: This advanced technique involves running multiple iterations of a model with random variables to analyze the probability of various outcomes.
How Are We Going to Build This?
To build a what-if scenario analysis model in Excel, you need to:
- Define your baseline scenario:
Start by defining your baseline scenario, which should reflect your current financial situation and assumptions. This will serve as a point of reference for comparing other scenarios. - Identify key drivers:
Identify the key drivers of your business, such as sales, expenses, and cash flow. These drivers will be the inputs to your financial model. - Create a financial model:
Create a financial model in Excel that captures the inputs, formulas, and assumptions necessary to calculate your financial outcomes. Be sure to organize your model clearly and logically, with inputs and assumptions on one sheet and calculations on another. - Test different scenarios:
Use Excel's built-in tools, such as Scenario Manager, Data Tables, Goal Seek, and Sensitivity Analysis, to test different scenarios and assumptions. You can also use Monte Carlo simulation tools to test multiple scenarios simultaneously. - Analyze the results:
Analyze the results of your what-if scenarios to identify potential risks and opportunities. Use this information to make informed business decisions and plan for the future.
Final Output
Requirements
Since what-if scenario analysis for financial projections is typically done in Excel, no specific libraries or modules are required. However, you may need to have a certain version of Excel or Microsoft Office to access the necessary tools and features, such as:
- Excel 2016 or later:
Scenario Manager and other what-if analysis tools are available in Excel 2016 and later versions. - Data Tables:
Excel data tables allow users to perform sensitivity analysis by automatically calculating and comparing different scenarios based on changing inputs. As a result, they are powerful financial modeling, forecasting, and decision-making tool, enabling users to make informed decisions based on various scenarios and outcomes. - Goal Seek:
Goal seek in Excel is a tool that allows users to determine the value of an input cell that will result in a desired output. It is a form of reverse calculation where users can set a target value for a formula, and the tool will adjust the input value accordingly to reach that target. - Sensitivity Analysis:
Sensitivity Analysis is a built-in Excel feature that allows you to change one input variable at a time and observe how it affects the output. - Monte Carlo Simulation:
Although not a built-in feature of Excel, several add-ins and software tools are available that allow you to run Monte Carlo simulations within Excel. - Financial Model:
You will need to create a financial model in Excel that captures the inputs, formulas, and assumptions necessary to calculate your financial outcomes.
Building Financial Projections using What If Scenario Analysis
What is a Scenario Manager?
Scenario Manager in what-if scenario analysis is a tool in Excel that enables users to create and compare different scenarios based on changing inputs. In addition, it allows users to manage and organize multiple scenarios in a single worksheet, making analyzing and comparing the results easier.
The Scenario Manager consists of three components: input cells, scenarios, and result cells. Input cells are the variables users want to change and tests, such as sales figures or production costs. Scenarios are the different combinations of input values that users want to test, such as high, medium, and low scenarios. Finally, result cells are the output values affected by the input values, such as profit or revenue.
Using Scenario Manager, users can easily create and save different scenarios and switch between them to compare the results. They can also create a summary report showing each scenario's results, making it easier to analyze and interpret the data.
Scenario Manager is a powerful tool for what-if scenario analysis, providing users with an efficient and organized way to test different scenarios and compare the results. It can be used for various purposes, such as financial modeling, risk analysis, and strategic planning, making it a valuable tool for decision-makers in various industries.
For example: What if I cut down my monthly traveling expenses? How much will I save? Here, we can store scenarios to apply them with a mouse click.
Scenarios help us to explore a group of possible outcomes. They also support the following:
- Varying as many as 32 input sets.
- Merging the scenarios from several different worksheets or workbooks.
Initial Values for Scenarios
In scenario analysis, "what-if" scenarios involve considering alternative future states or events that could affect a particular outcome or decision. Therefore, to conduct a scenario analysis, defining the initial values or assumptions for each scenario is essential.
The initial values for scenarios can vary depending on the situation or problem being analyzed. However, here are some general guidelines to follow when defining the initial values for what-if scenarios:
- Identify the Key Drivers:
Identify the factors that are most likely to influence the outcome of the scenario. For example, if you're analyzing the impact of a new product launch, key drivers include market size, consumer behavior, pricing, and distribution channels. - Define a Range of Values:
Once you've identified the key drivers, define a range of values for each driver. For example, if the market size is a key driver, you might define a range of values from pessimistic to optimistic. - Assign probabilities:
Assign probabilities to each value in the range. For example, if you think the pessimistic market size is unlikely, you assign a probability of 10% to that value and a probability of 70% to the optimistic market size. - Create scenarios:
Once you've defined the range of values and assigned probabilities, you can create scenarios by selecting values for each driver that make sense. For example, you might create a scenario where the market size is optimistic, but pricing is pessimistic. - Test the scenarios:
Finally, test each scenario to see how it affects the outcome you're analyzing. This will help you identify the most likely outcomes and inform decision-making.
Example
Let's consider an example of a company wanting to buy Metals for their needs. However, due to the scarcity of funds, the company wants to understand how much cost will be incurred for different buying possibilities.
The scenario manager is used to apply different scenarios to understand the situation based on different results.
Here are the steps for setting up the initial values for Scenarios:
- Data Collection:
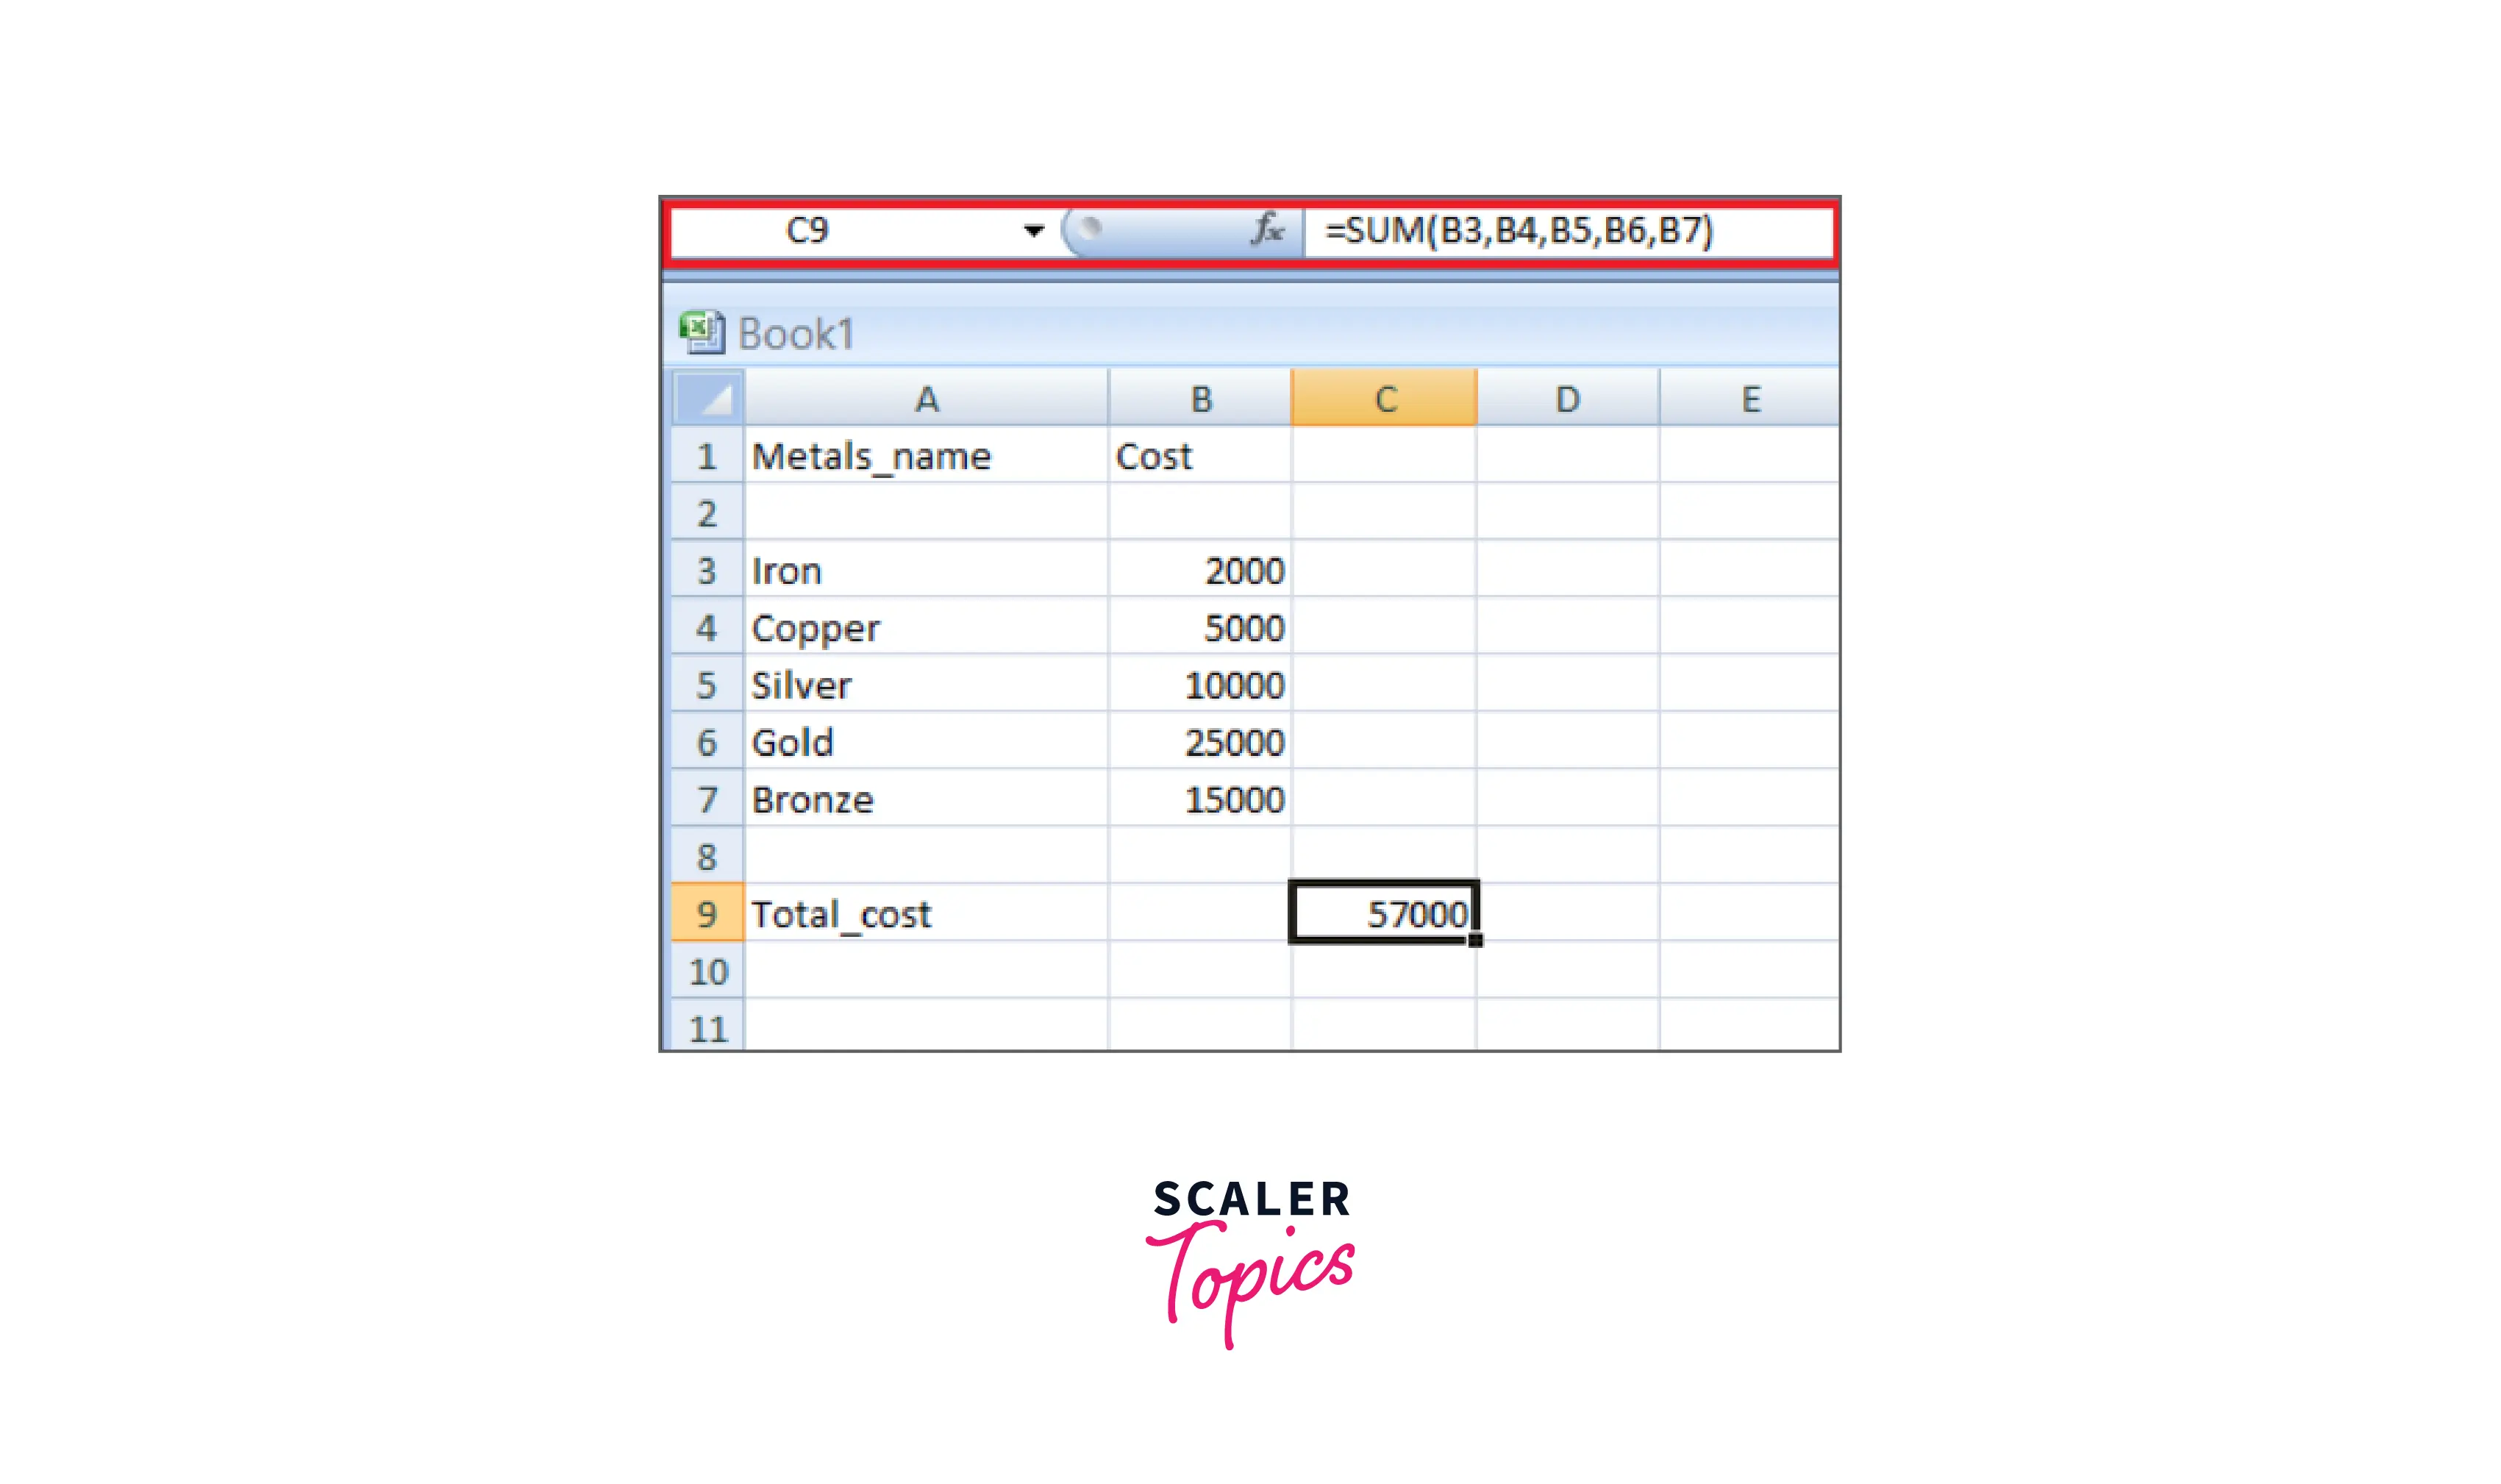
- First, we must define the cells containing the input values. Let their name be Metals_name and Cost.
- Then, we define the cells which contain the input. Let the result cell be Total_cost.
- We place the required formula in the result cell and create the following table.
- Create an analysis report:
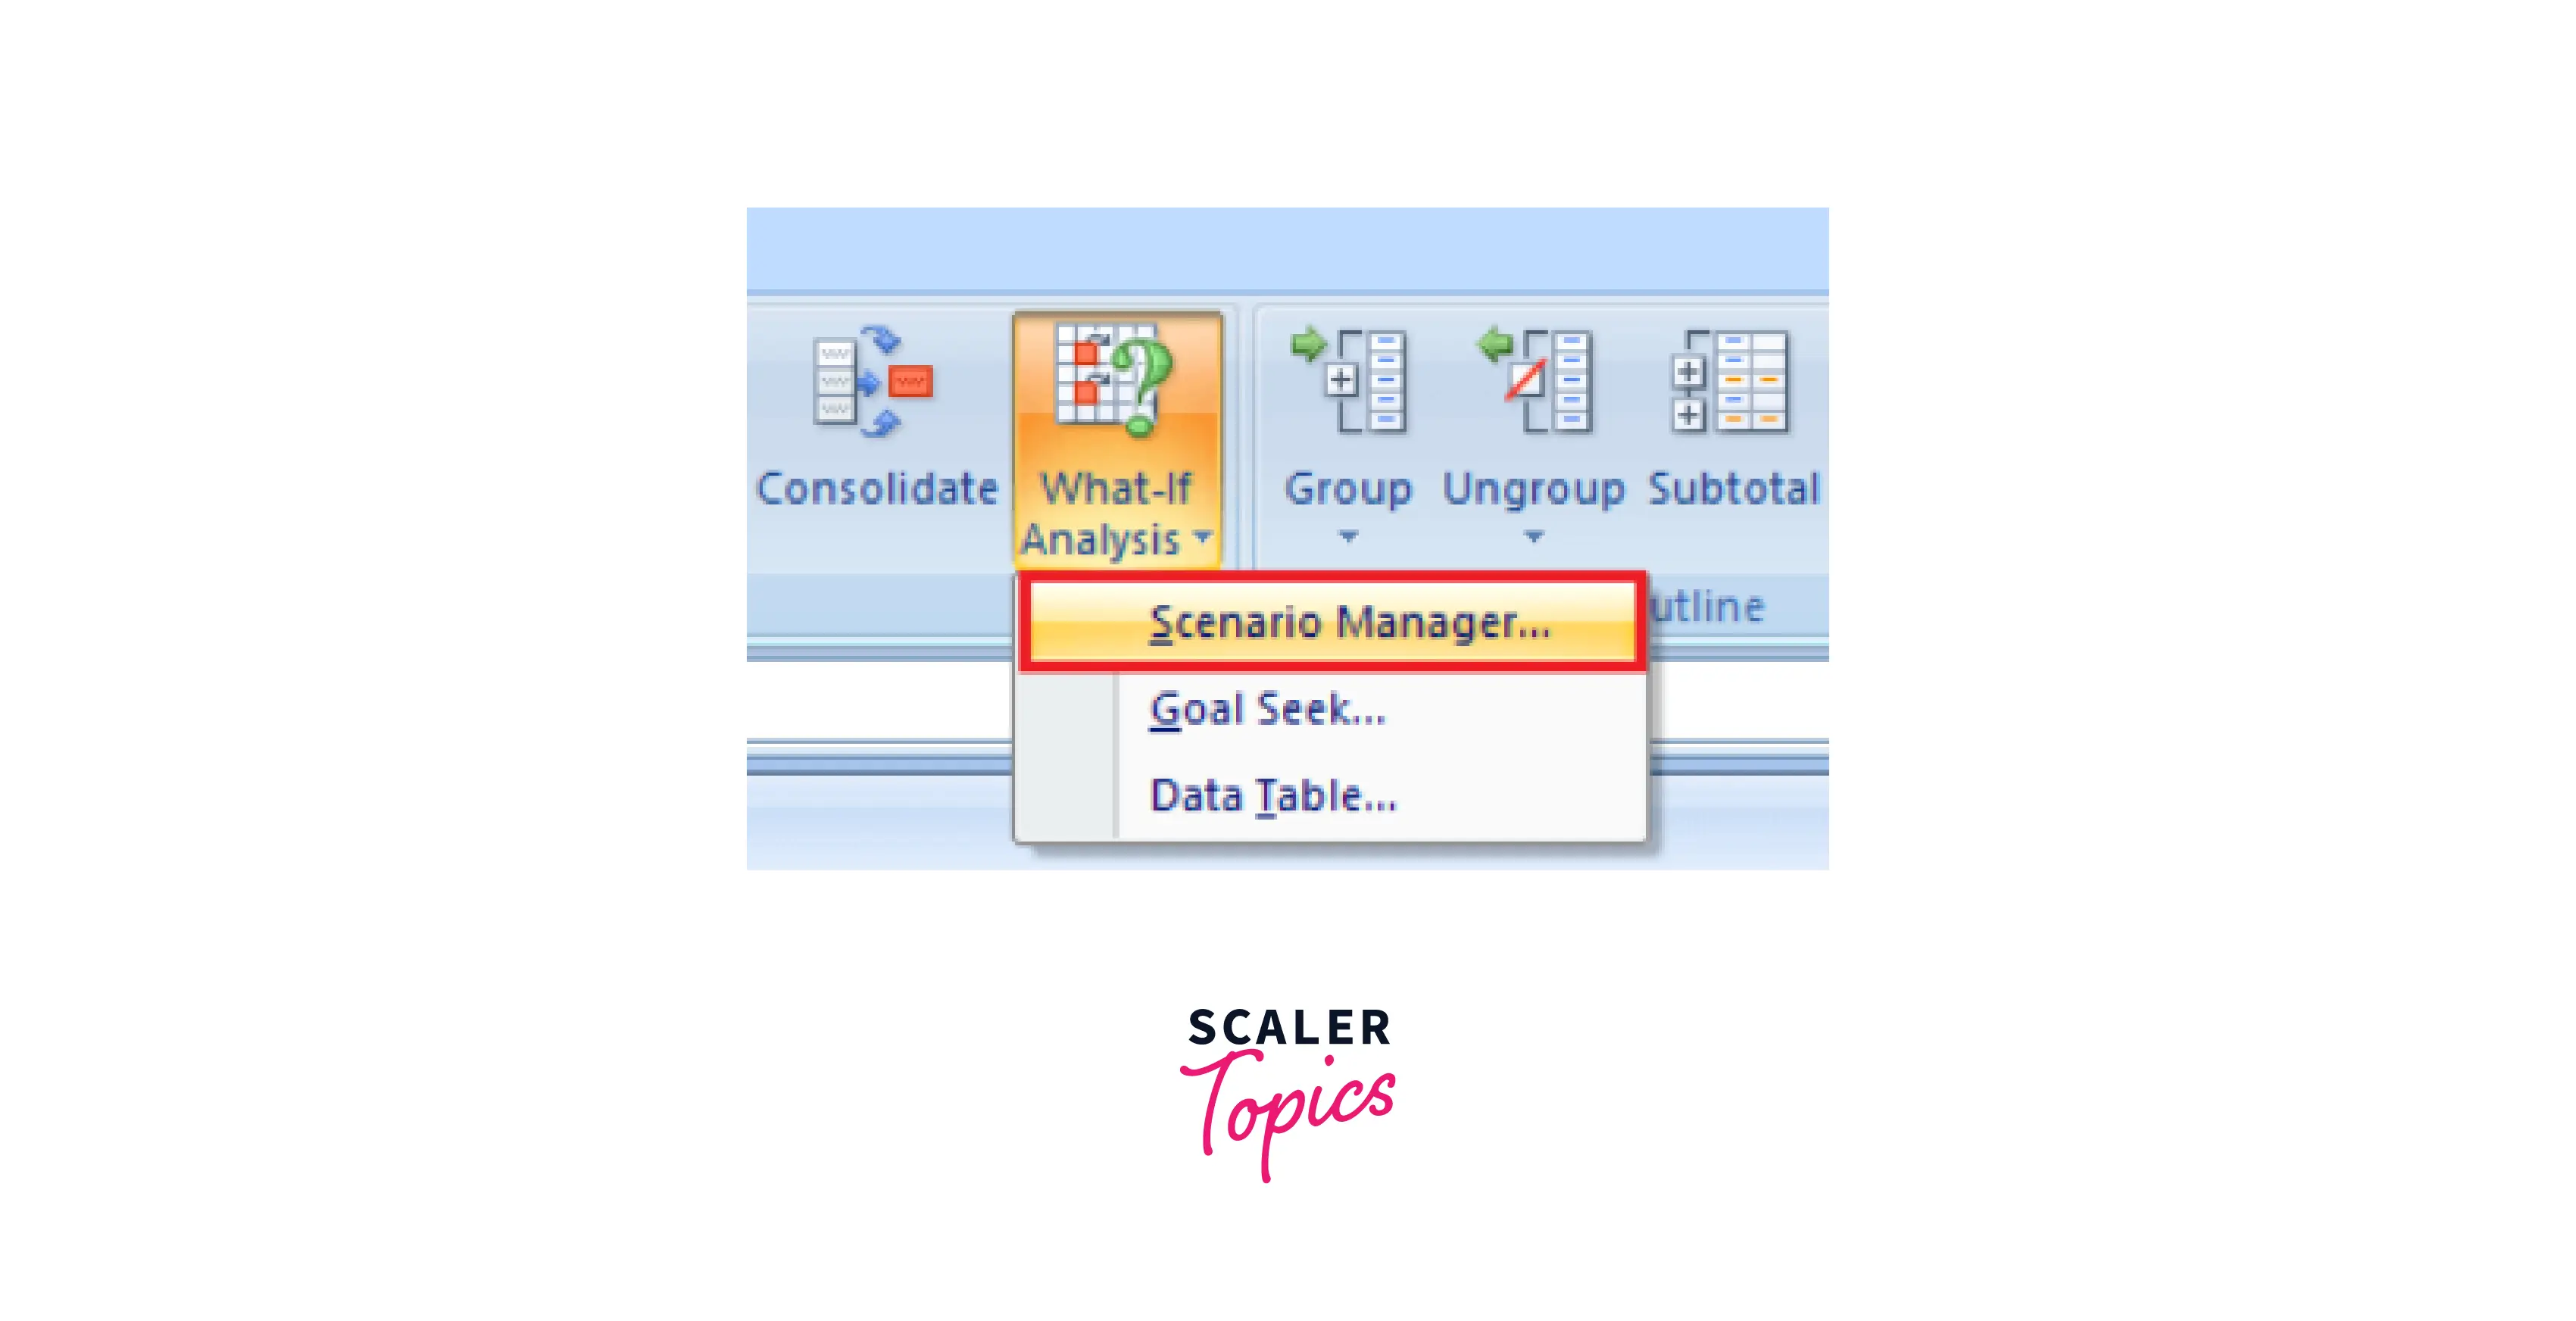
- We click on the data tab.
- Then go to the What-If Analysis button and click on the Scenario Manager from the dropdown list.
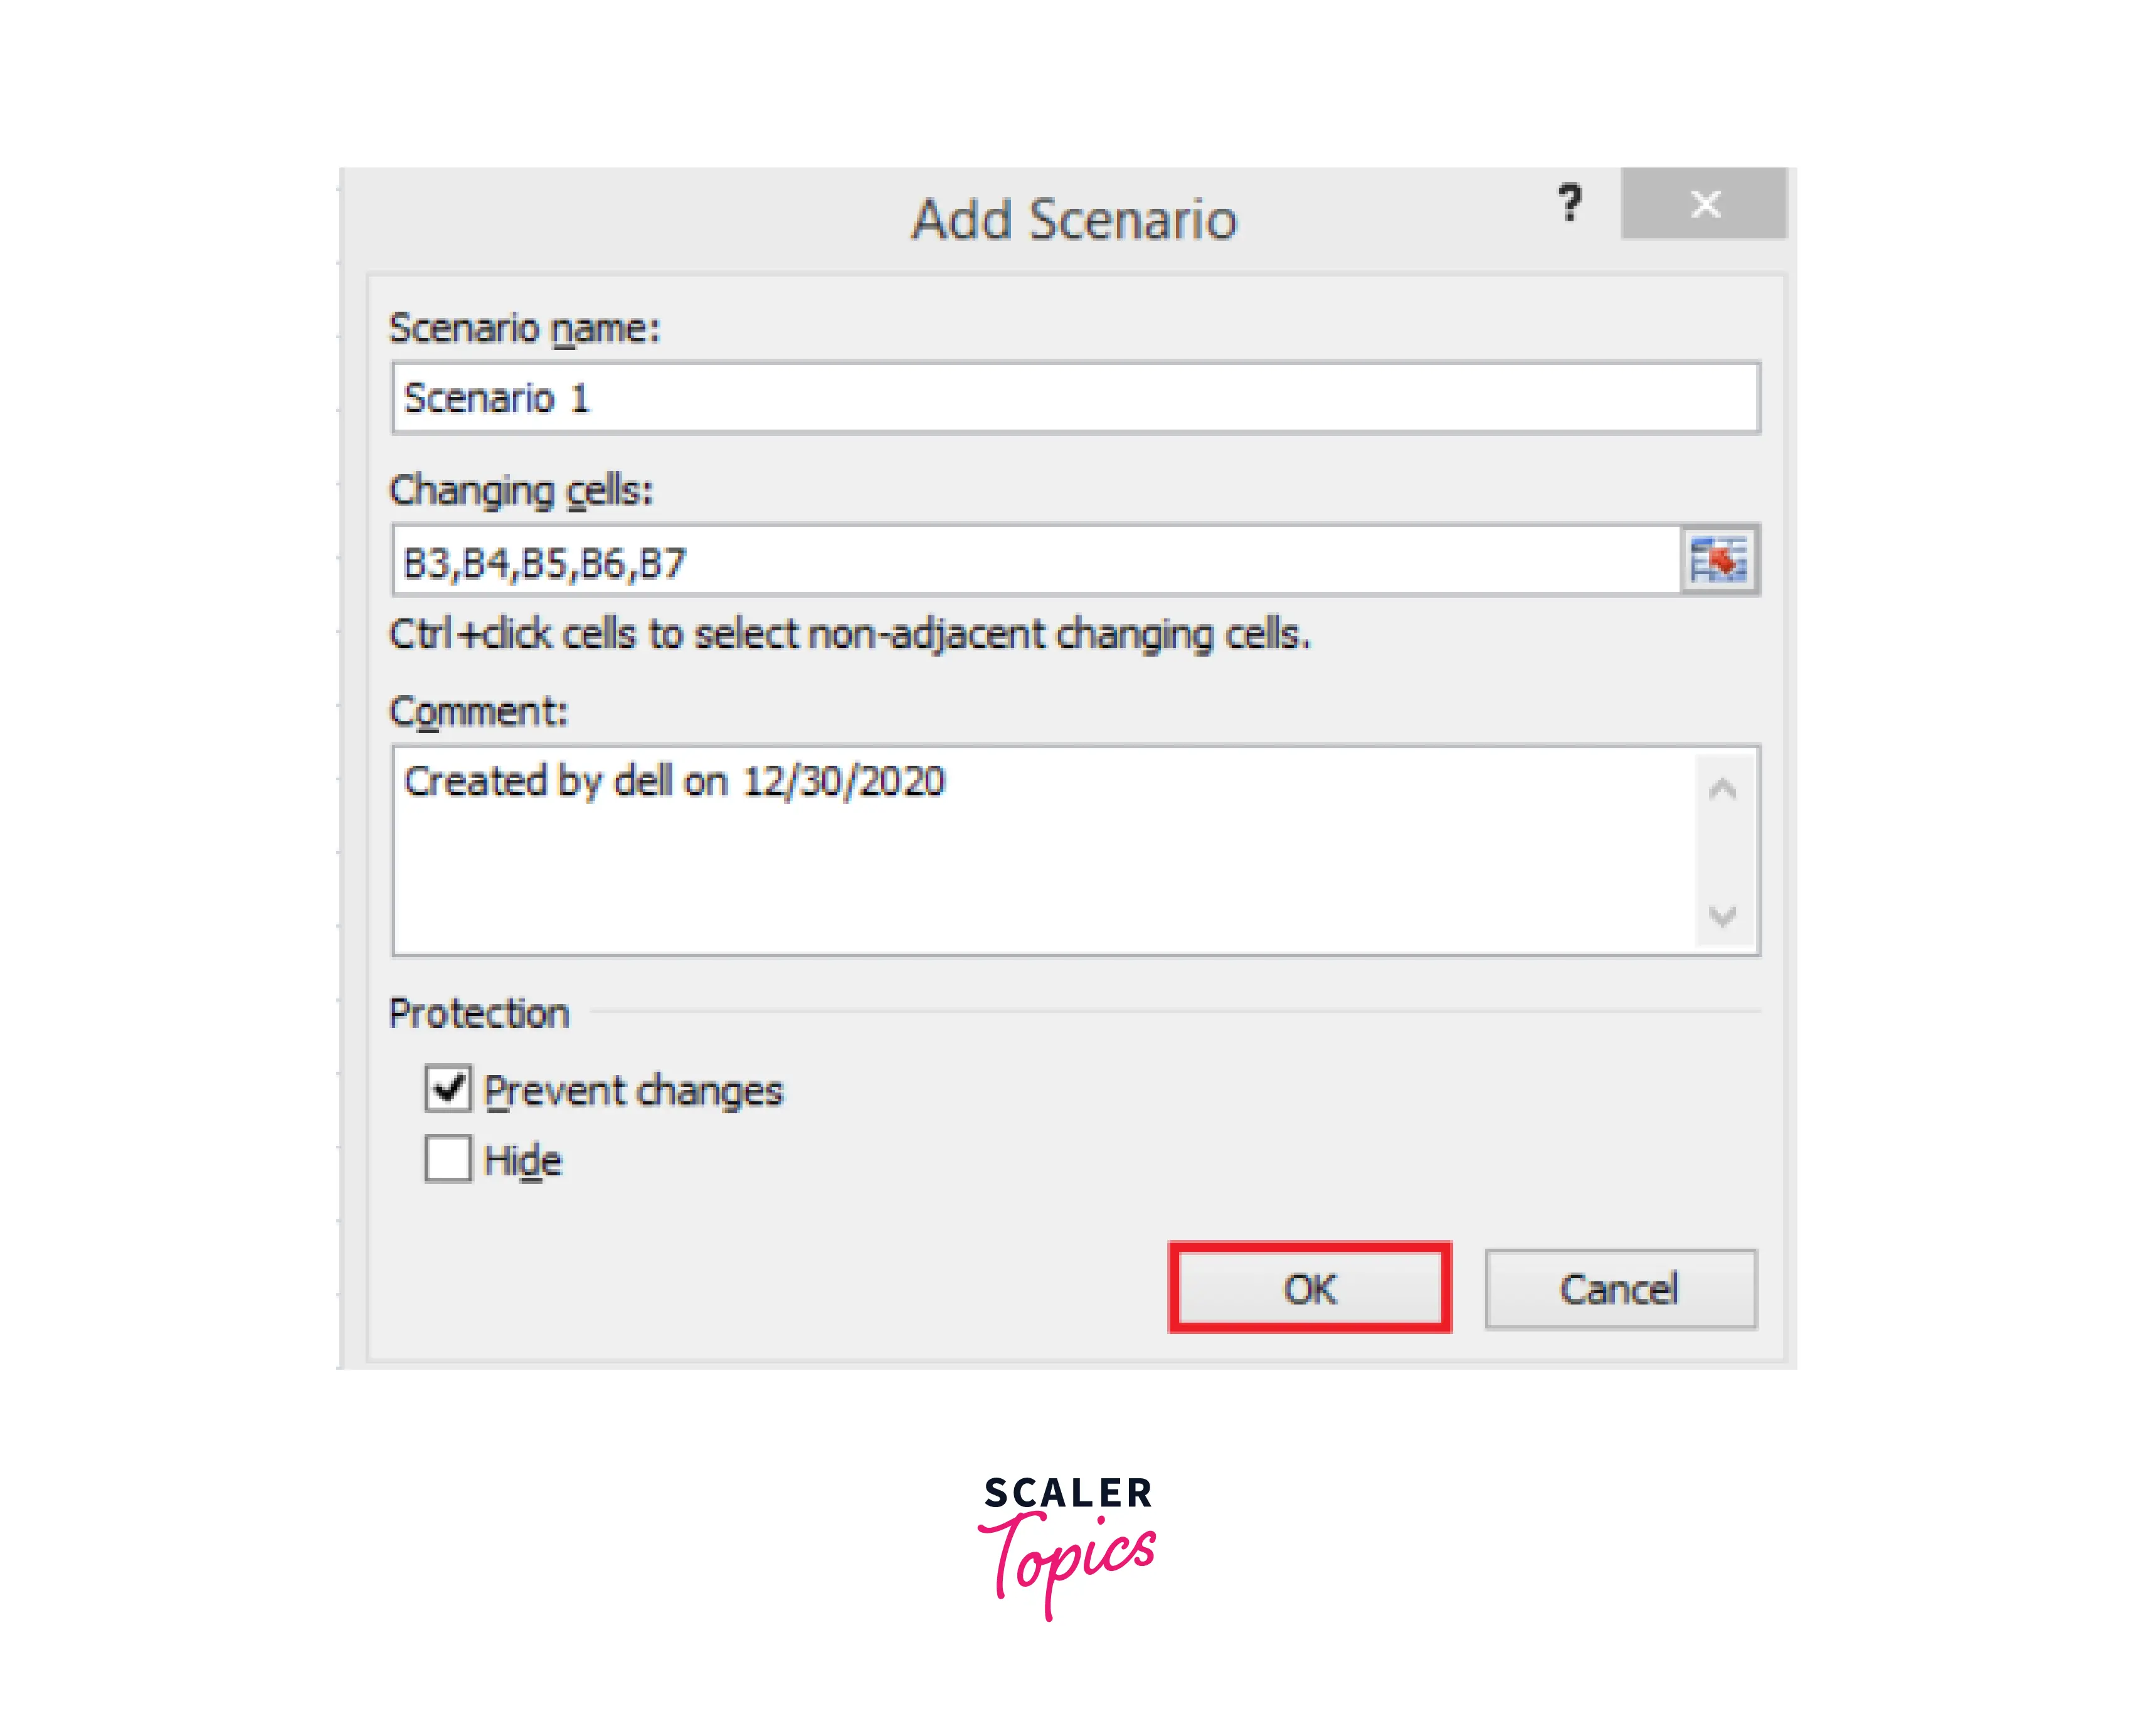
- Next, a scenario manager dialog box will appear. Click on the Add button to create a scenario.
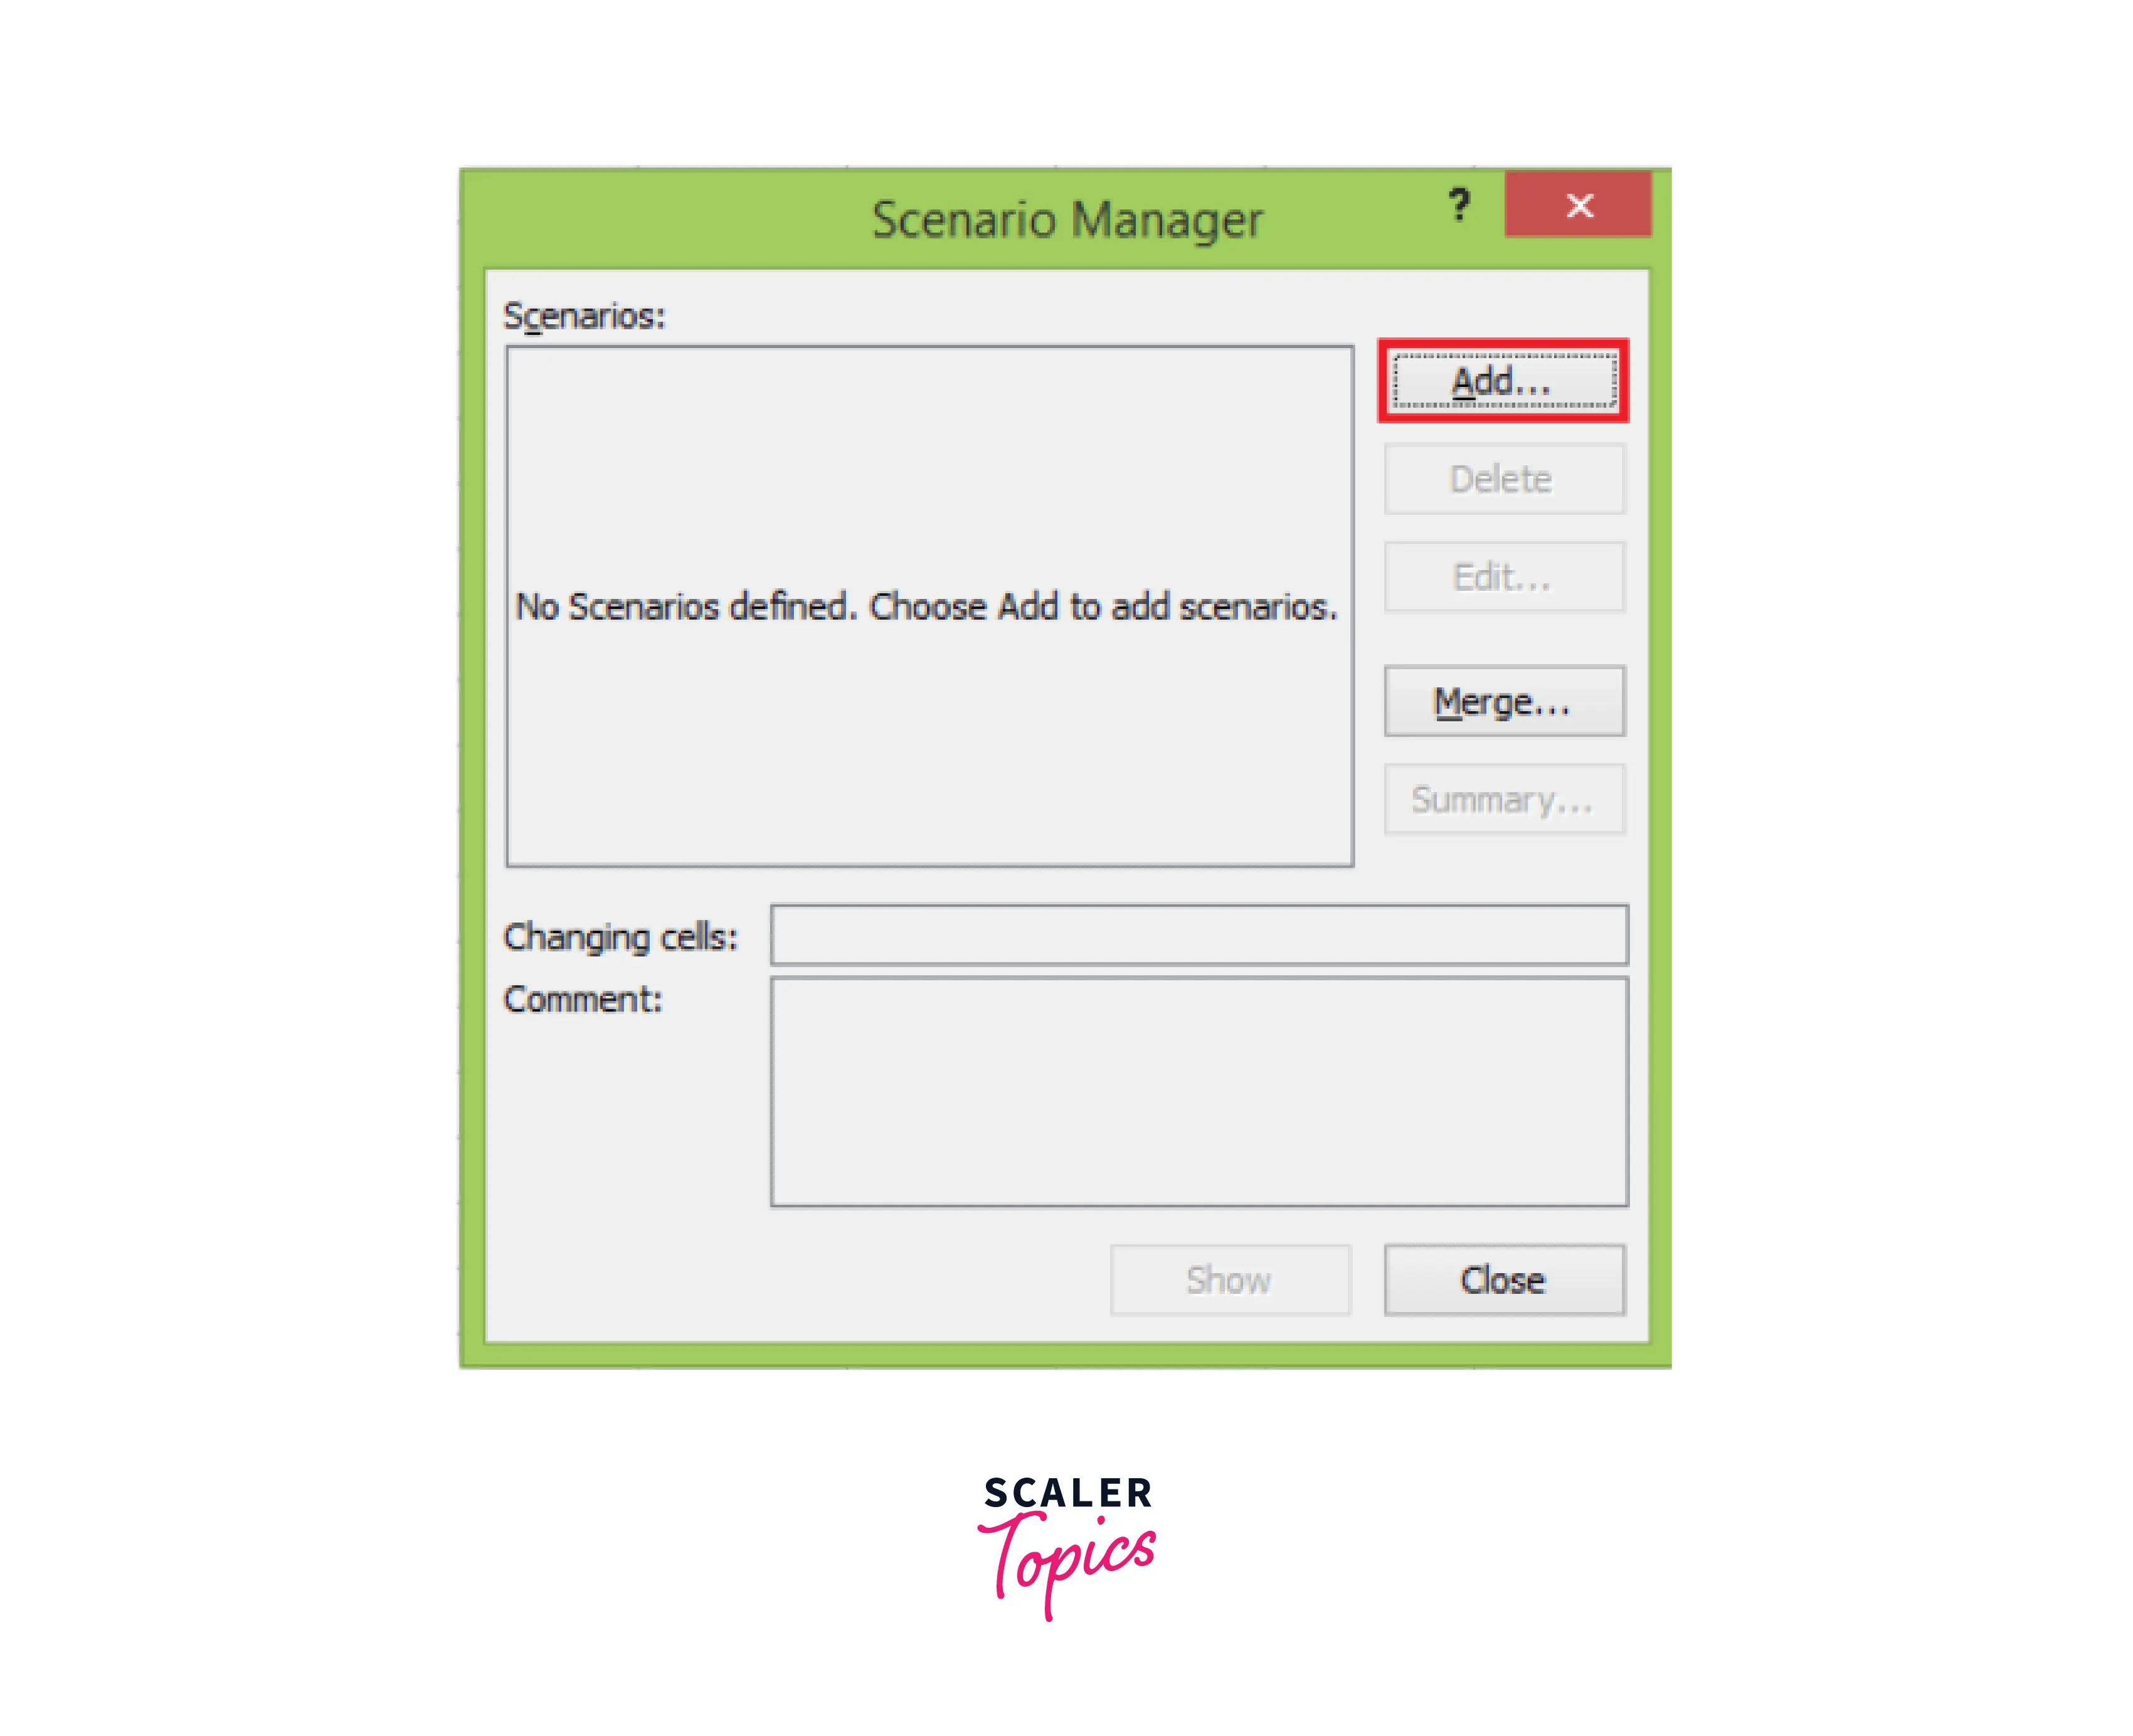
- Create the scenario, name the scenario, enter the value for each changing input cell for that scenario, and then click the Ok button.
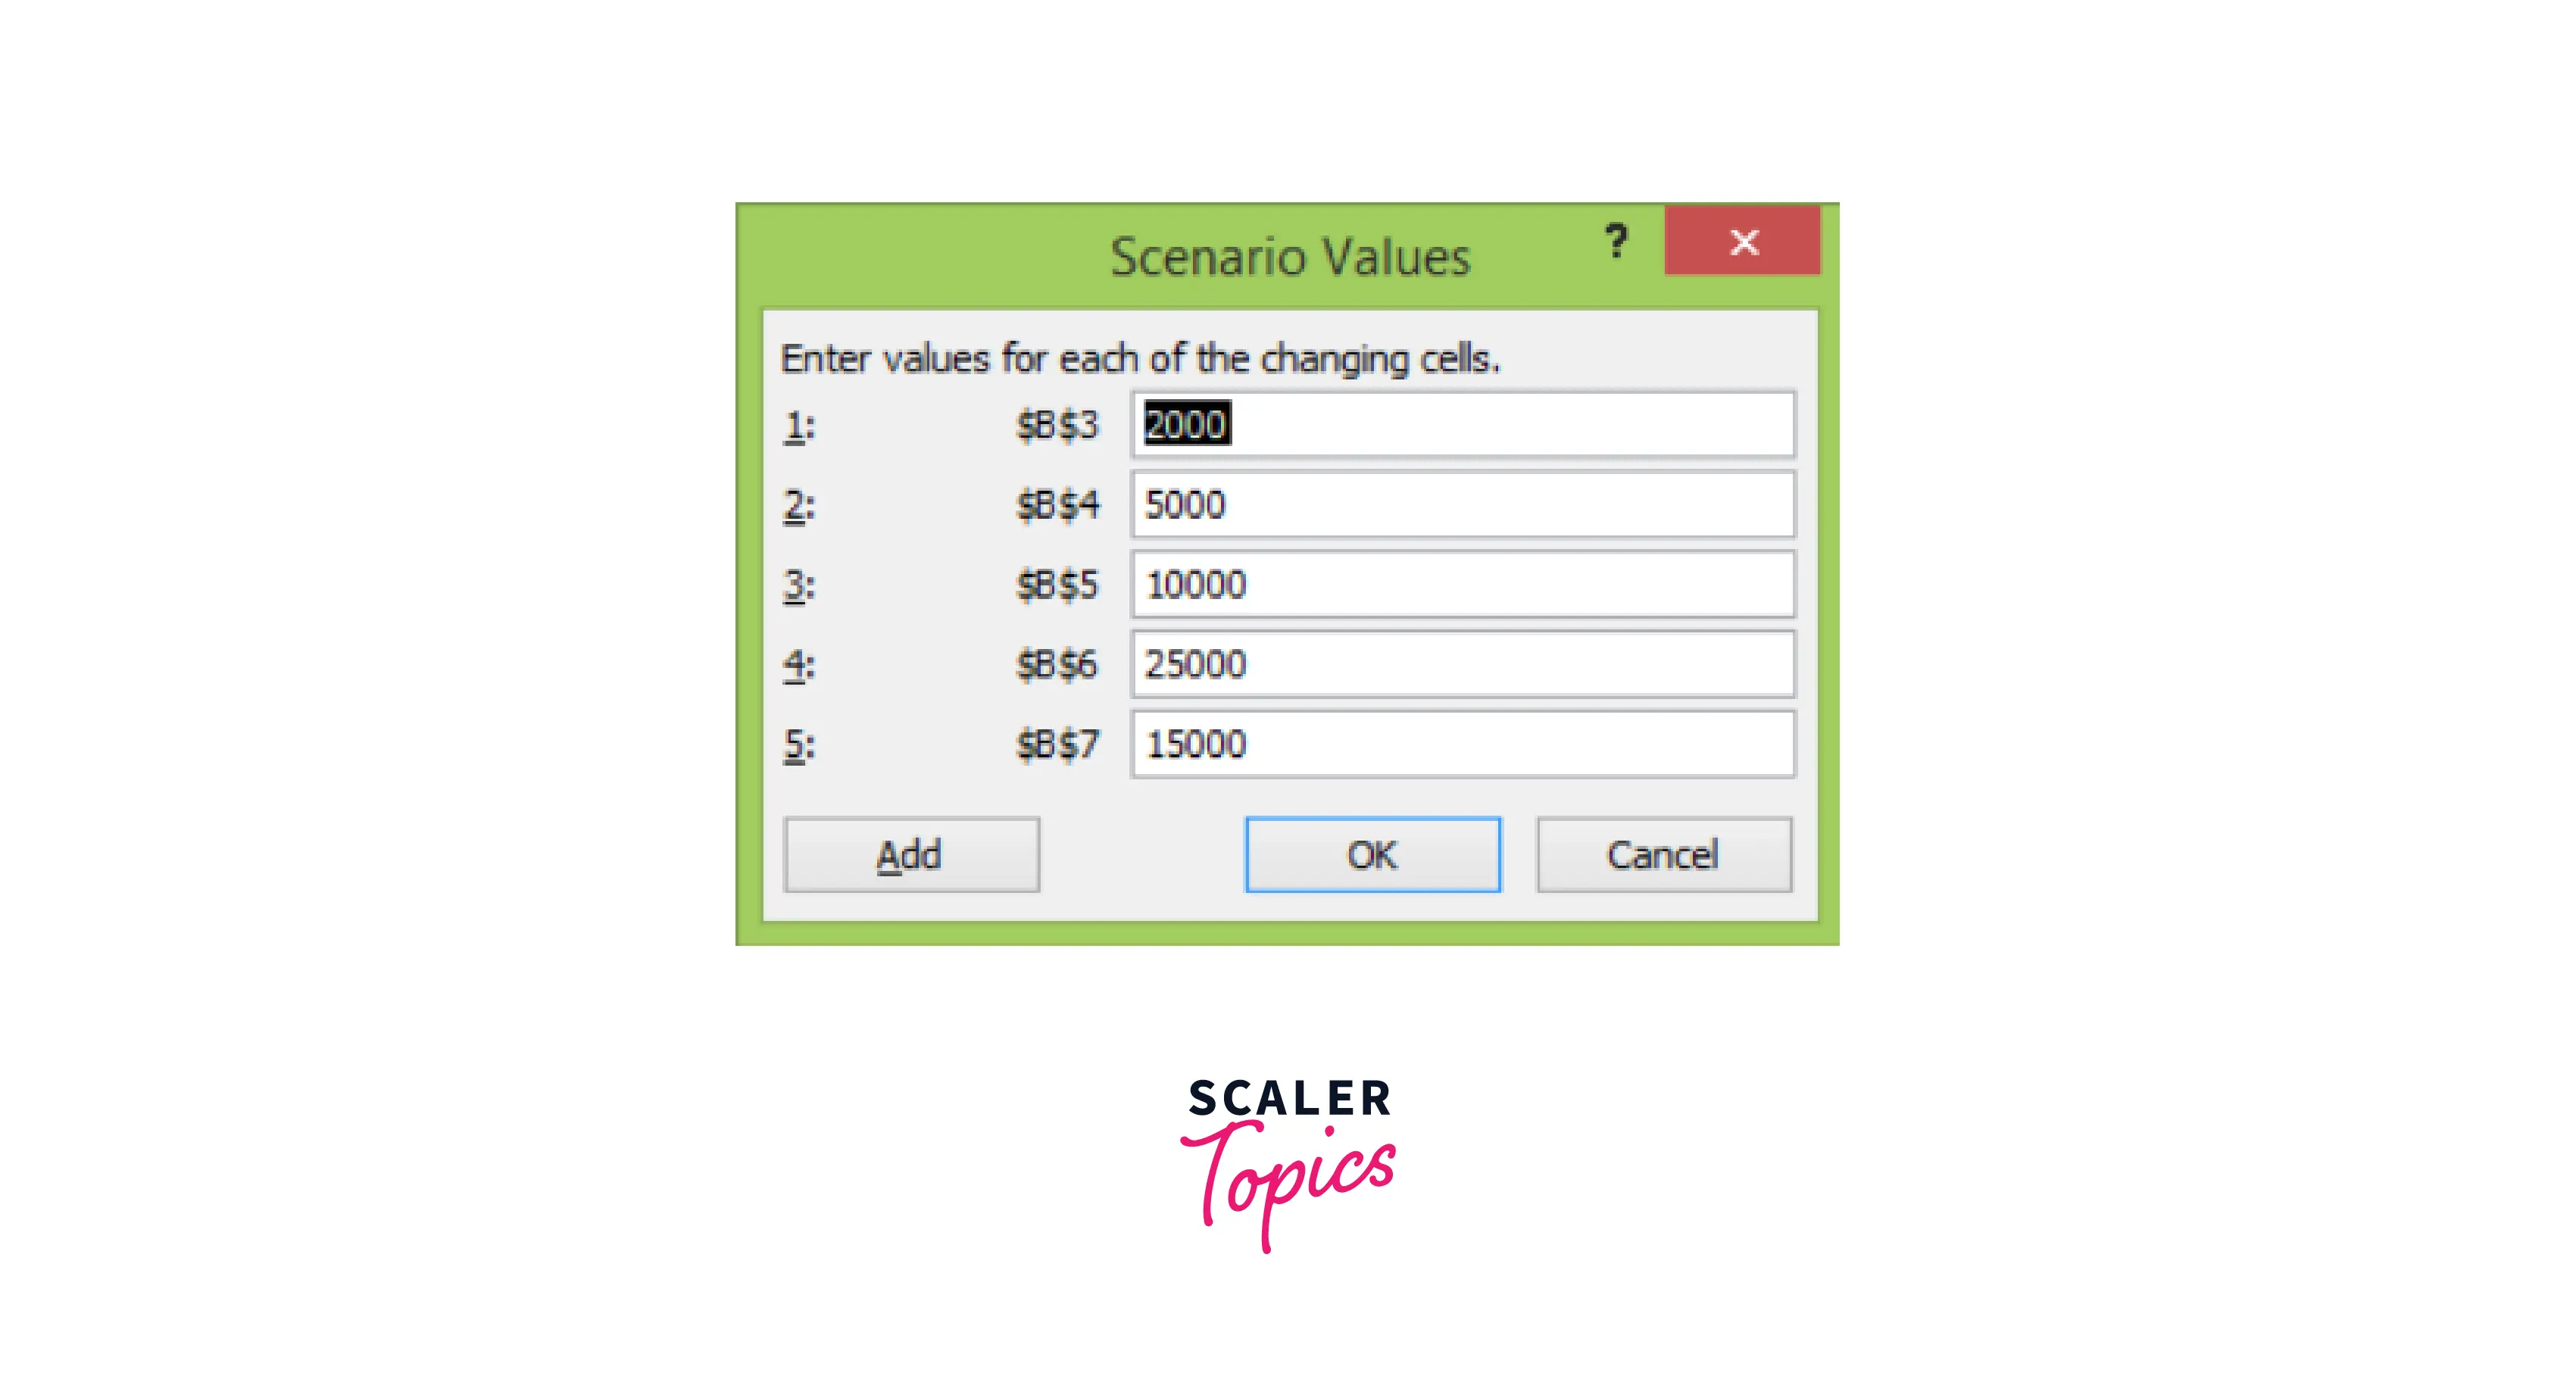
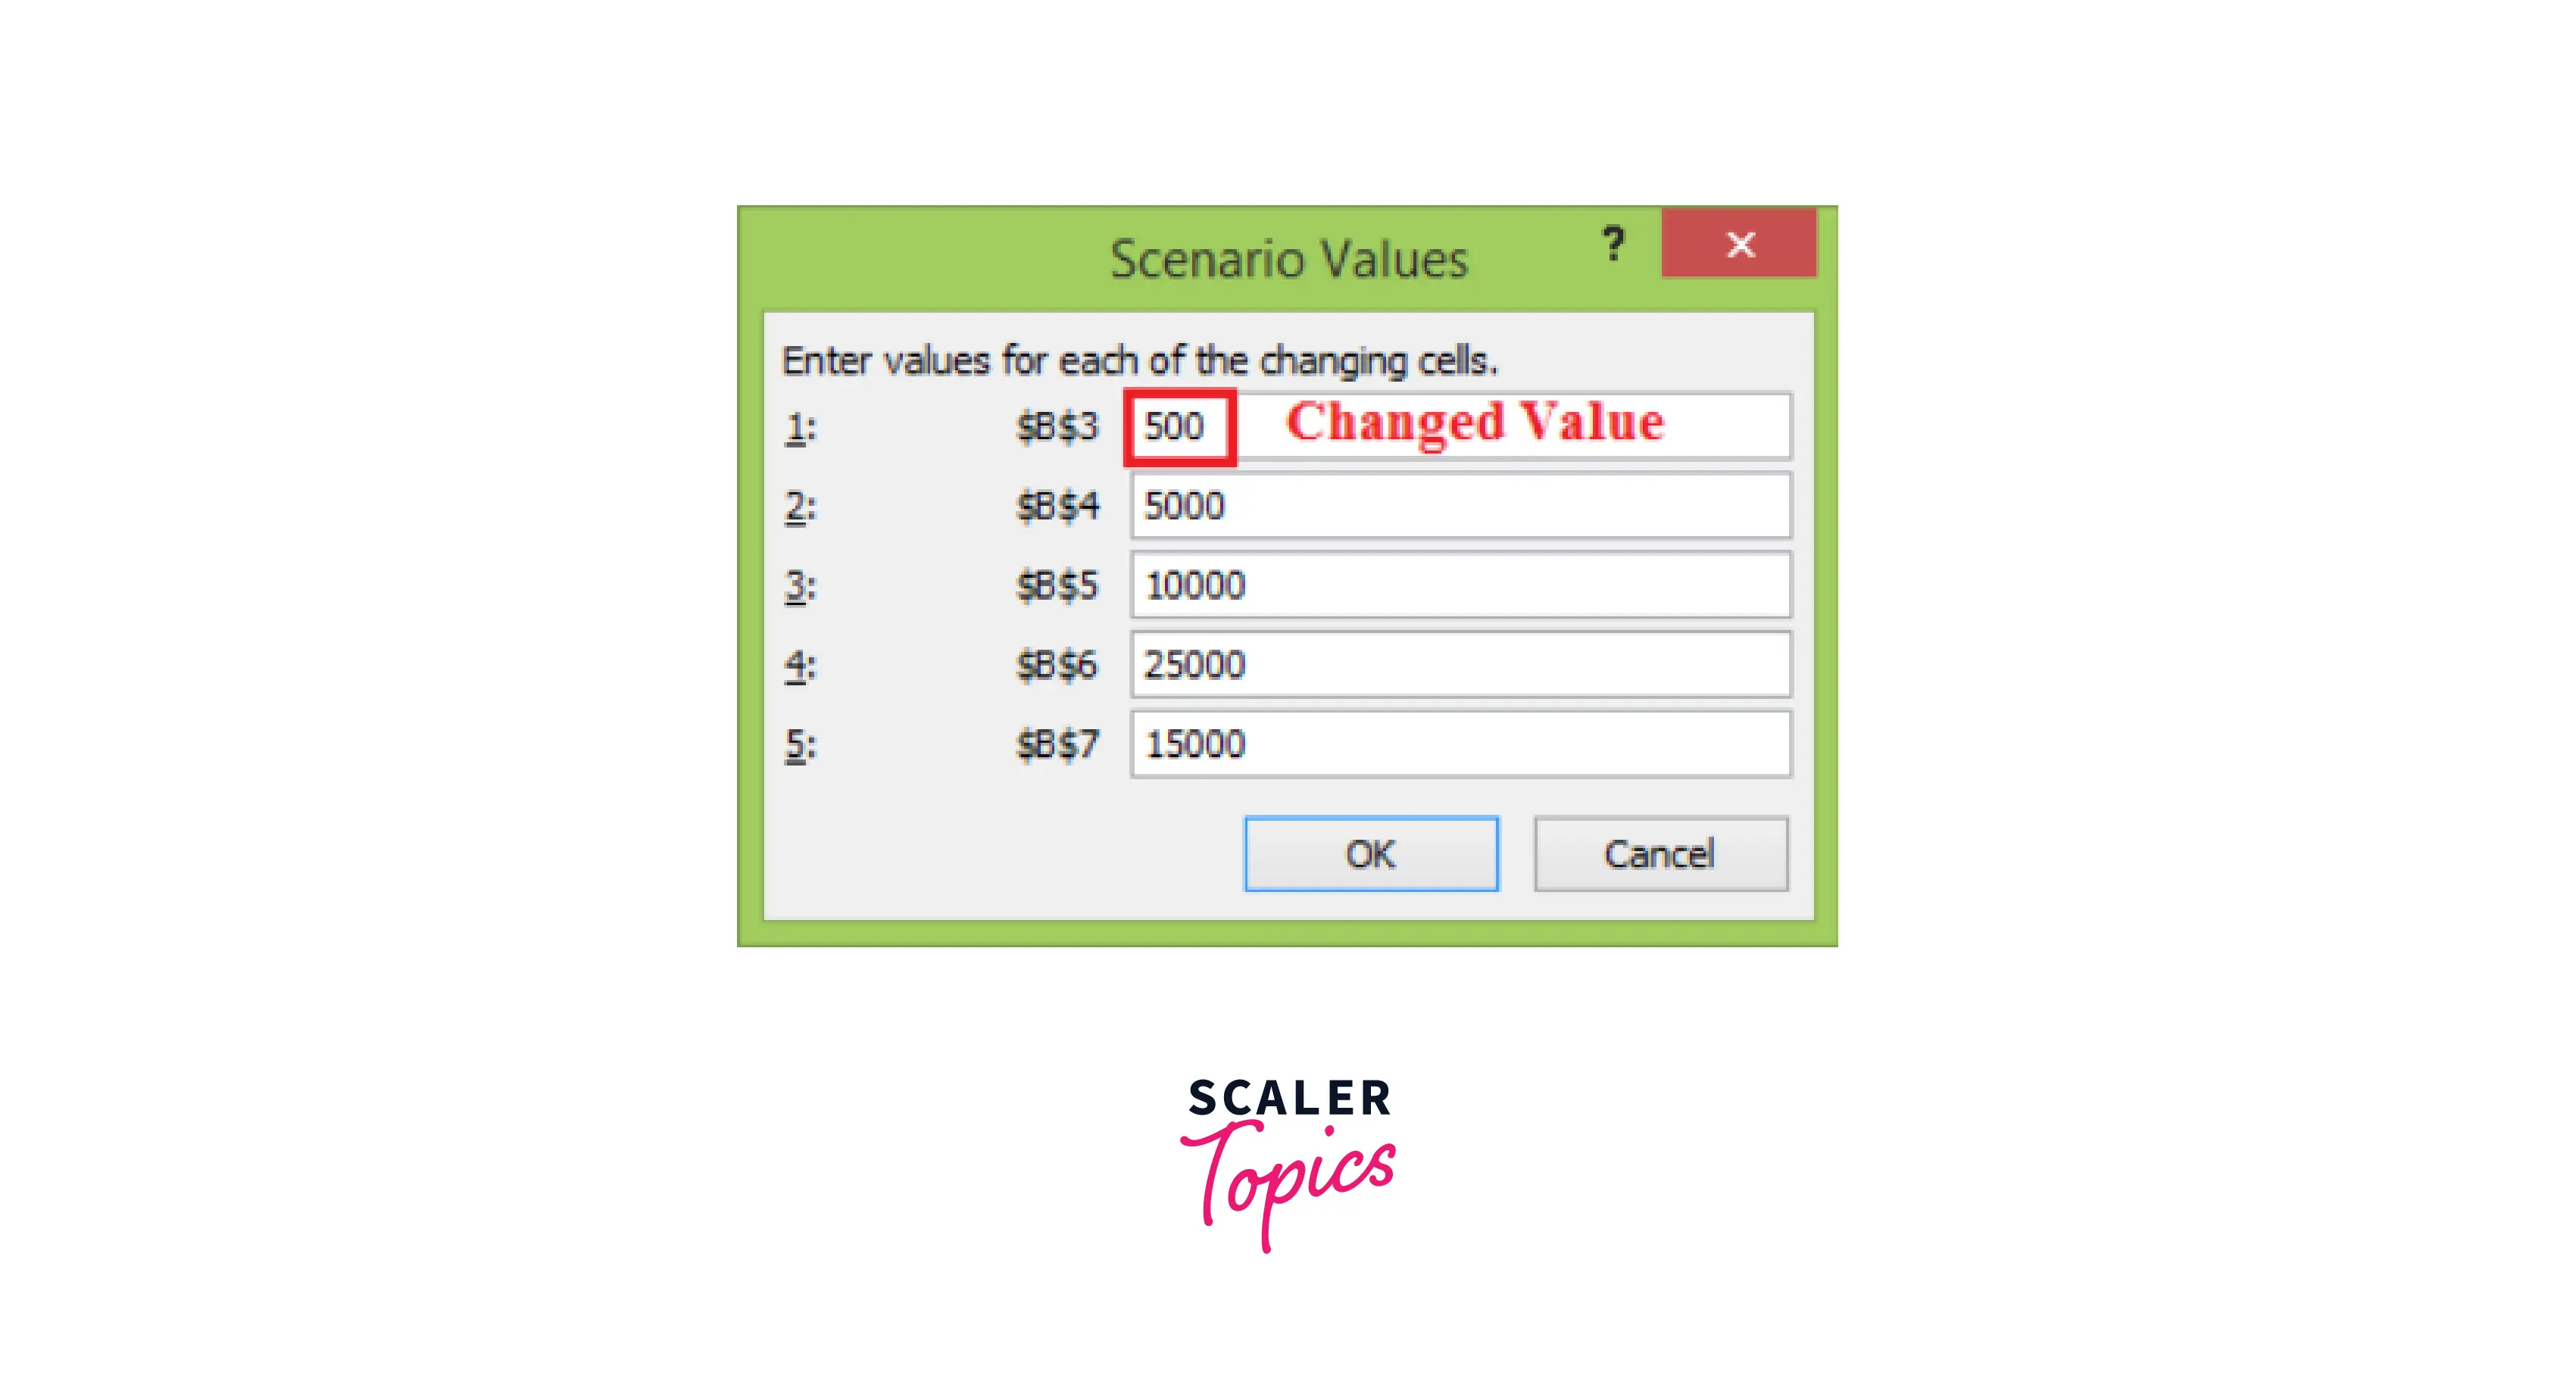
- Now, B3, B4, B5, B6, and B7 appear in the cells box.
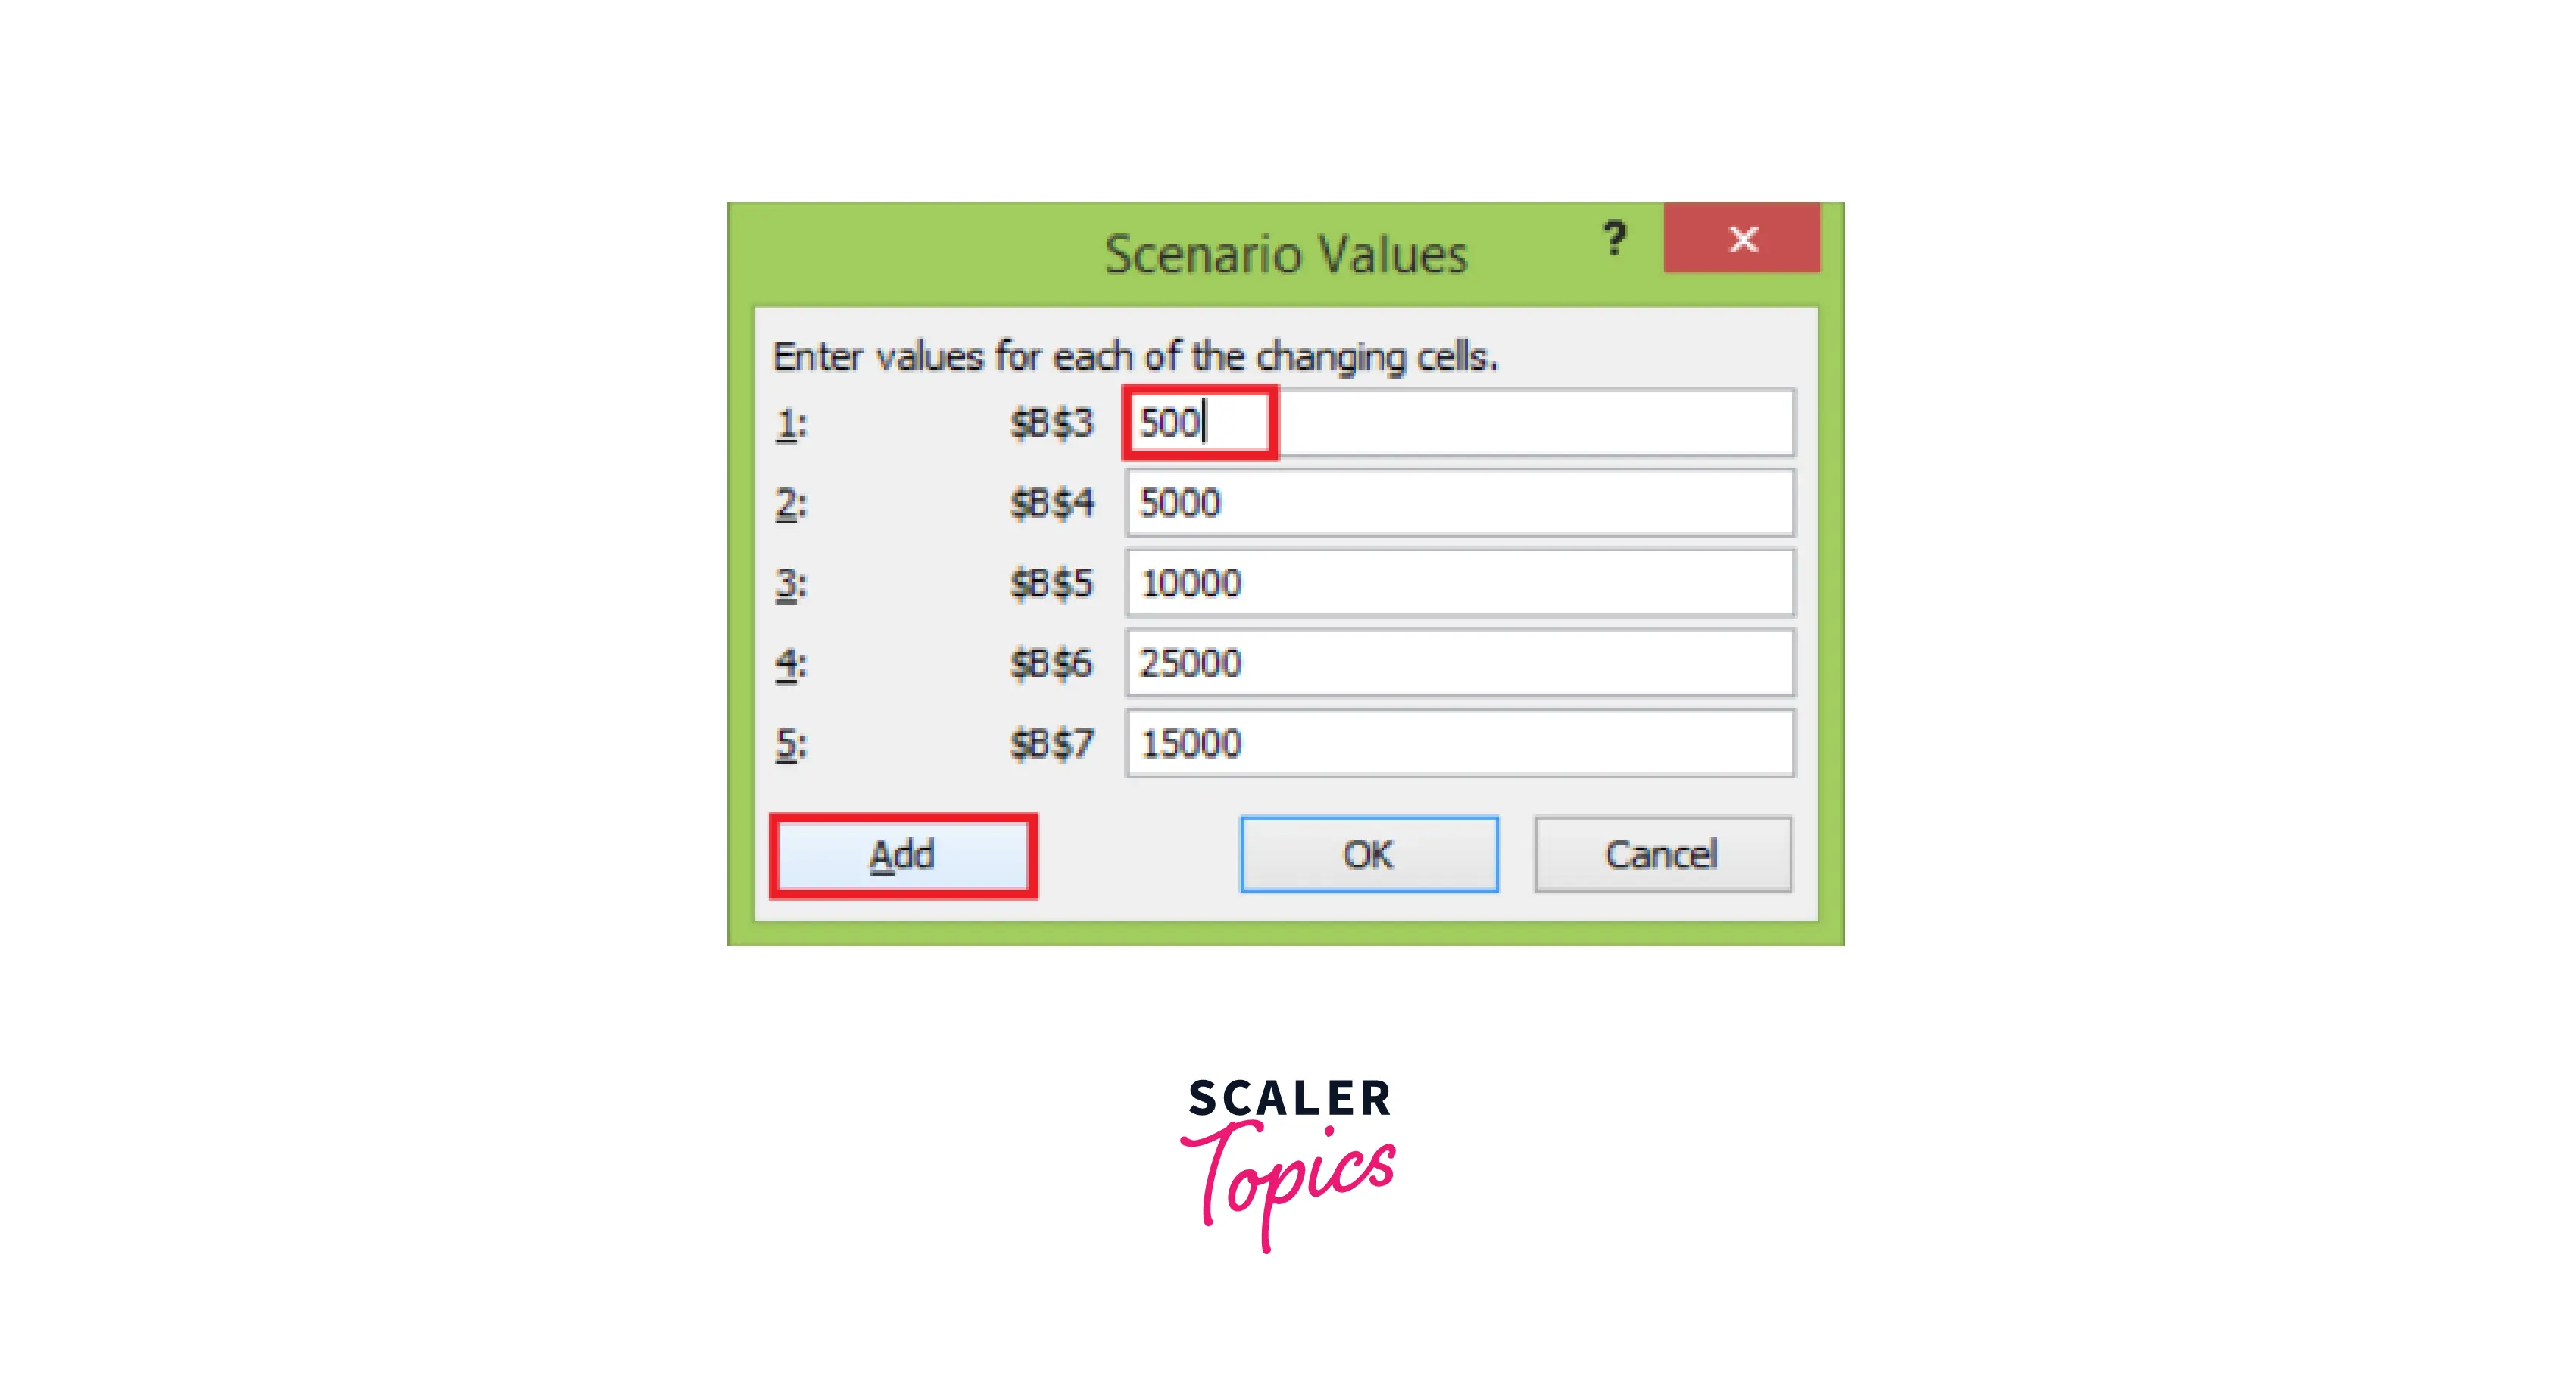
- Now, change the value of B3 to 500 and click the Add button.
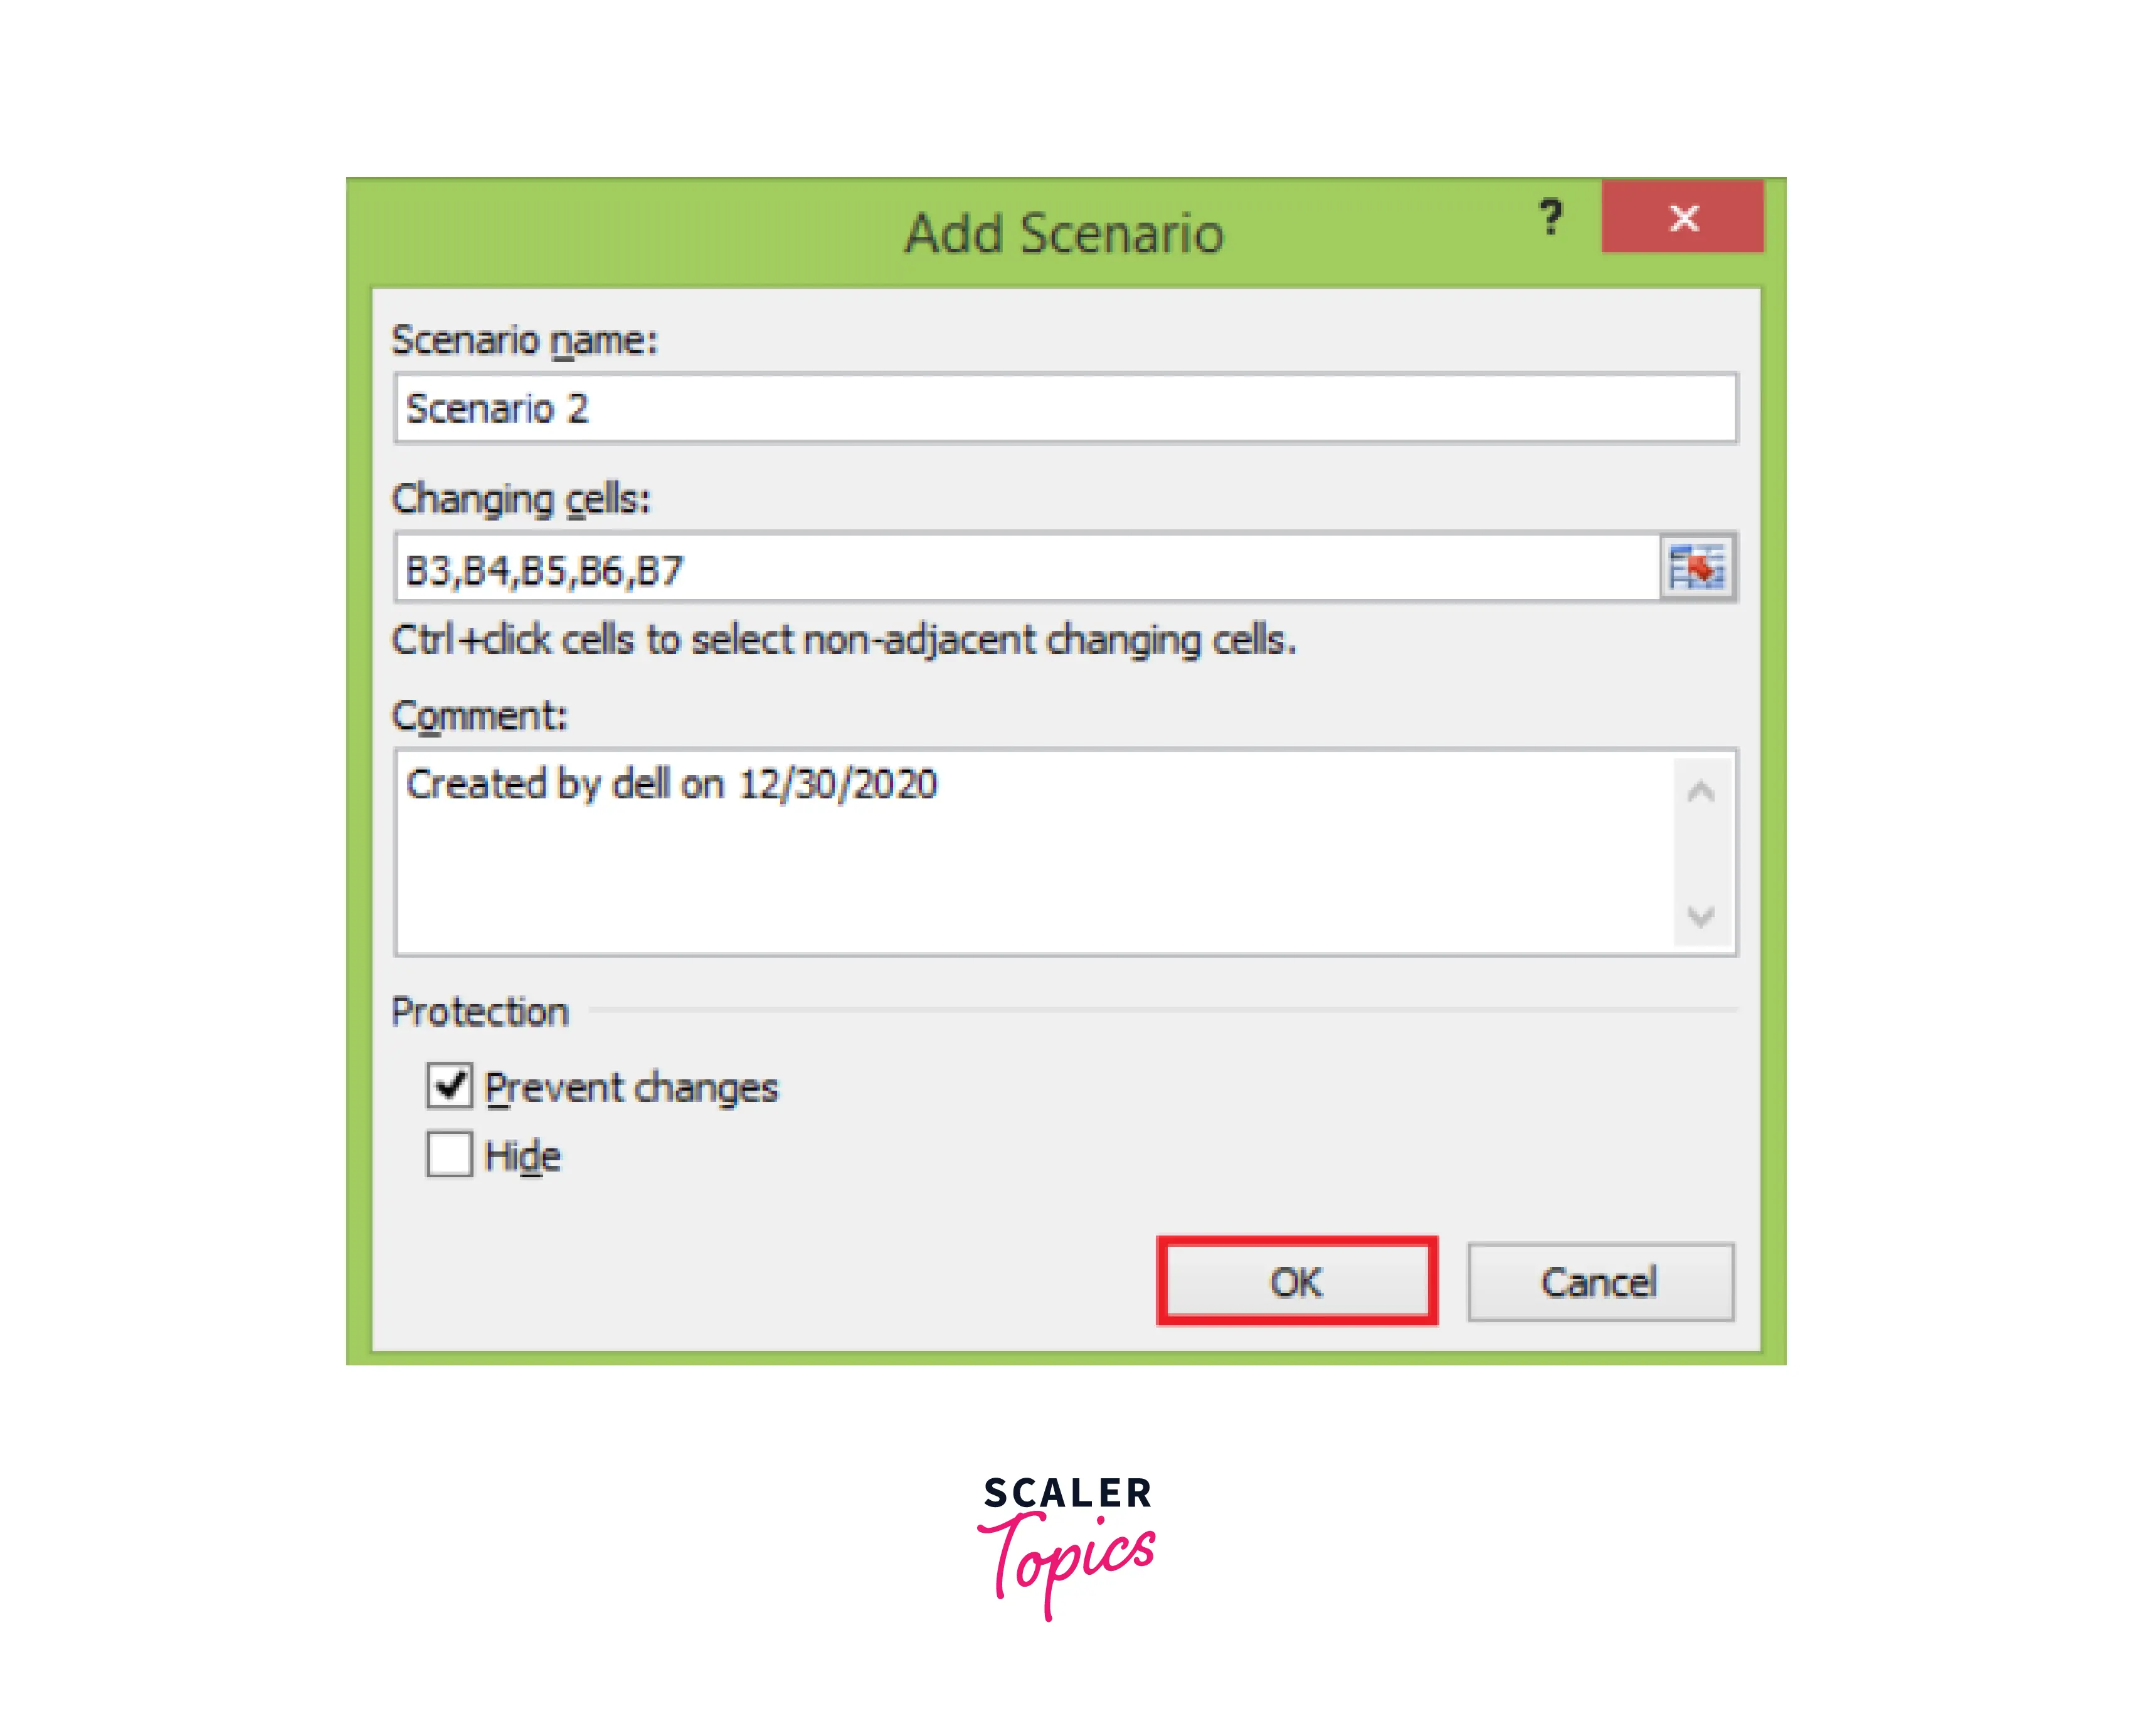
- After clicking the Add button, the add scenario dialog box reappears. We have to create scenario 2, select the prevent changes, and click on OK.
- Again, appears scenario values box appears with the changed value of the B3 cell.
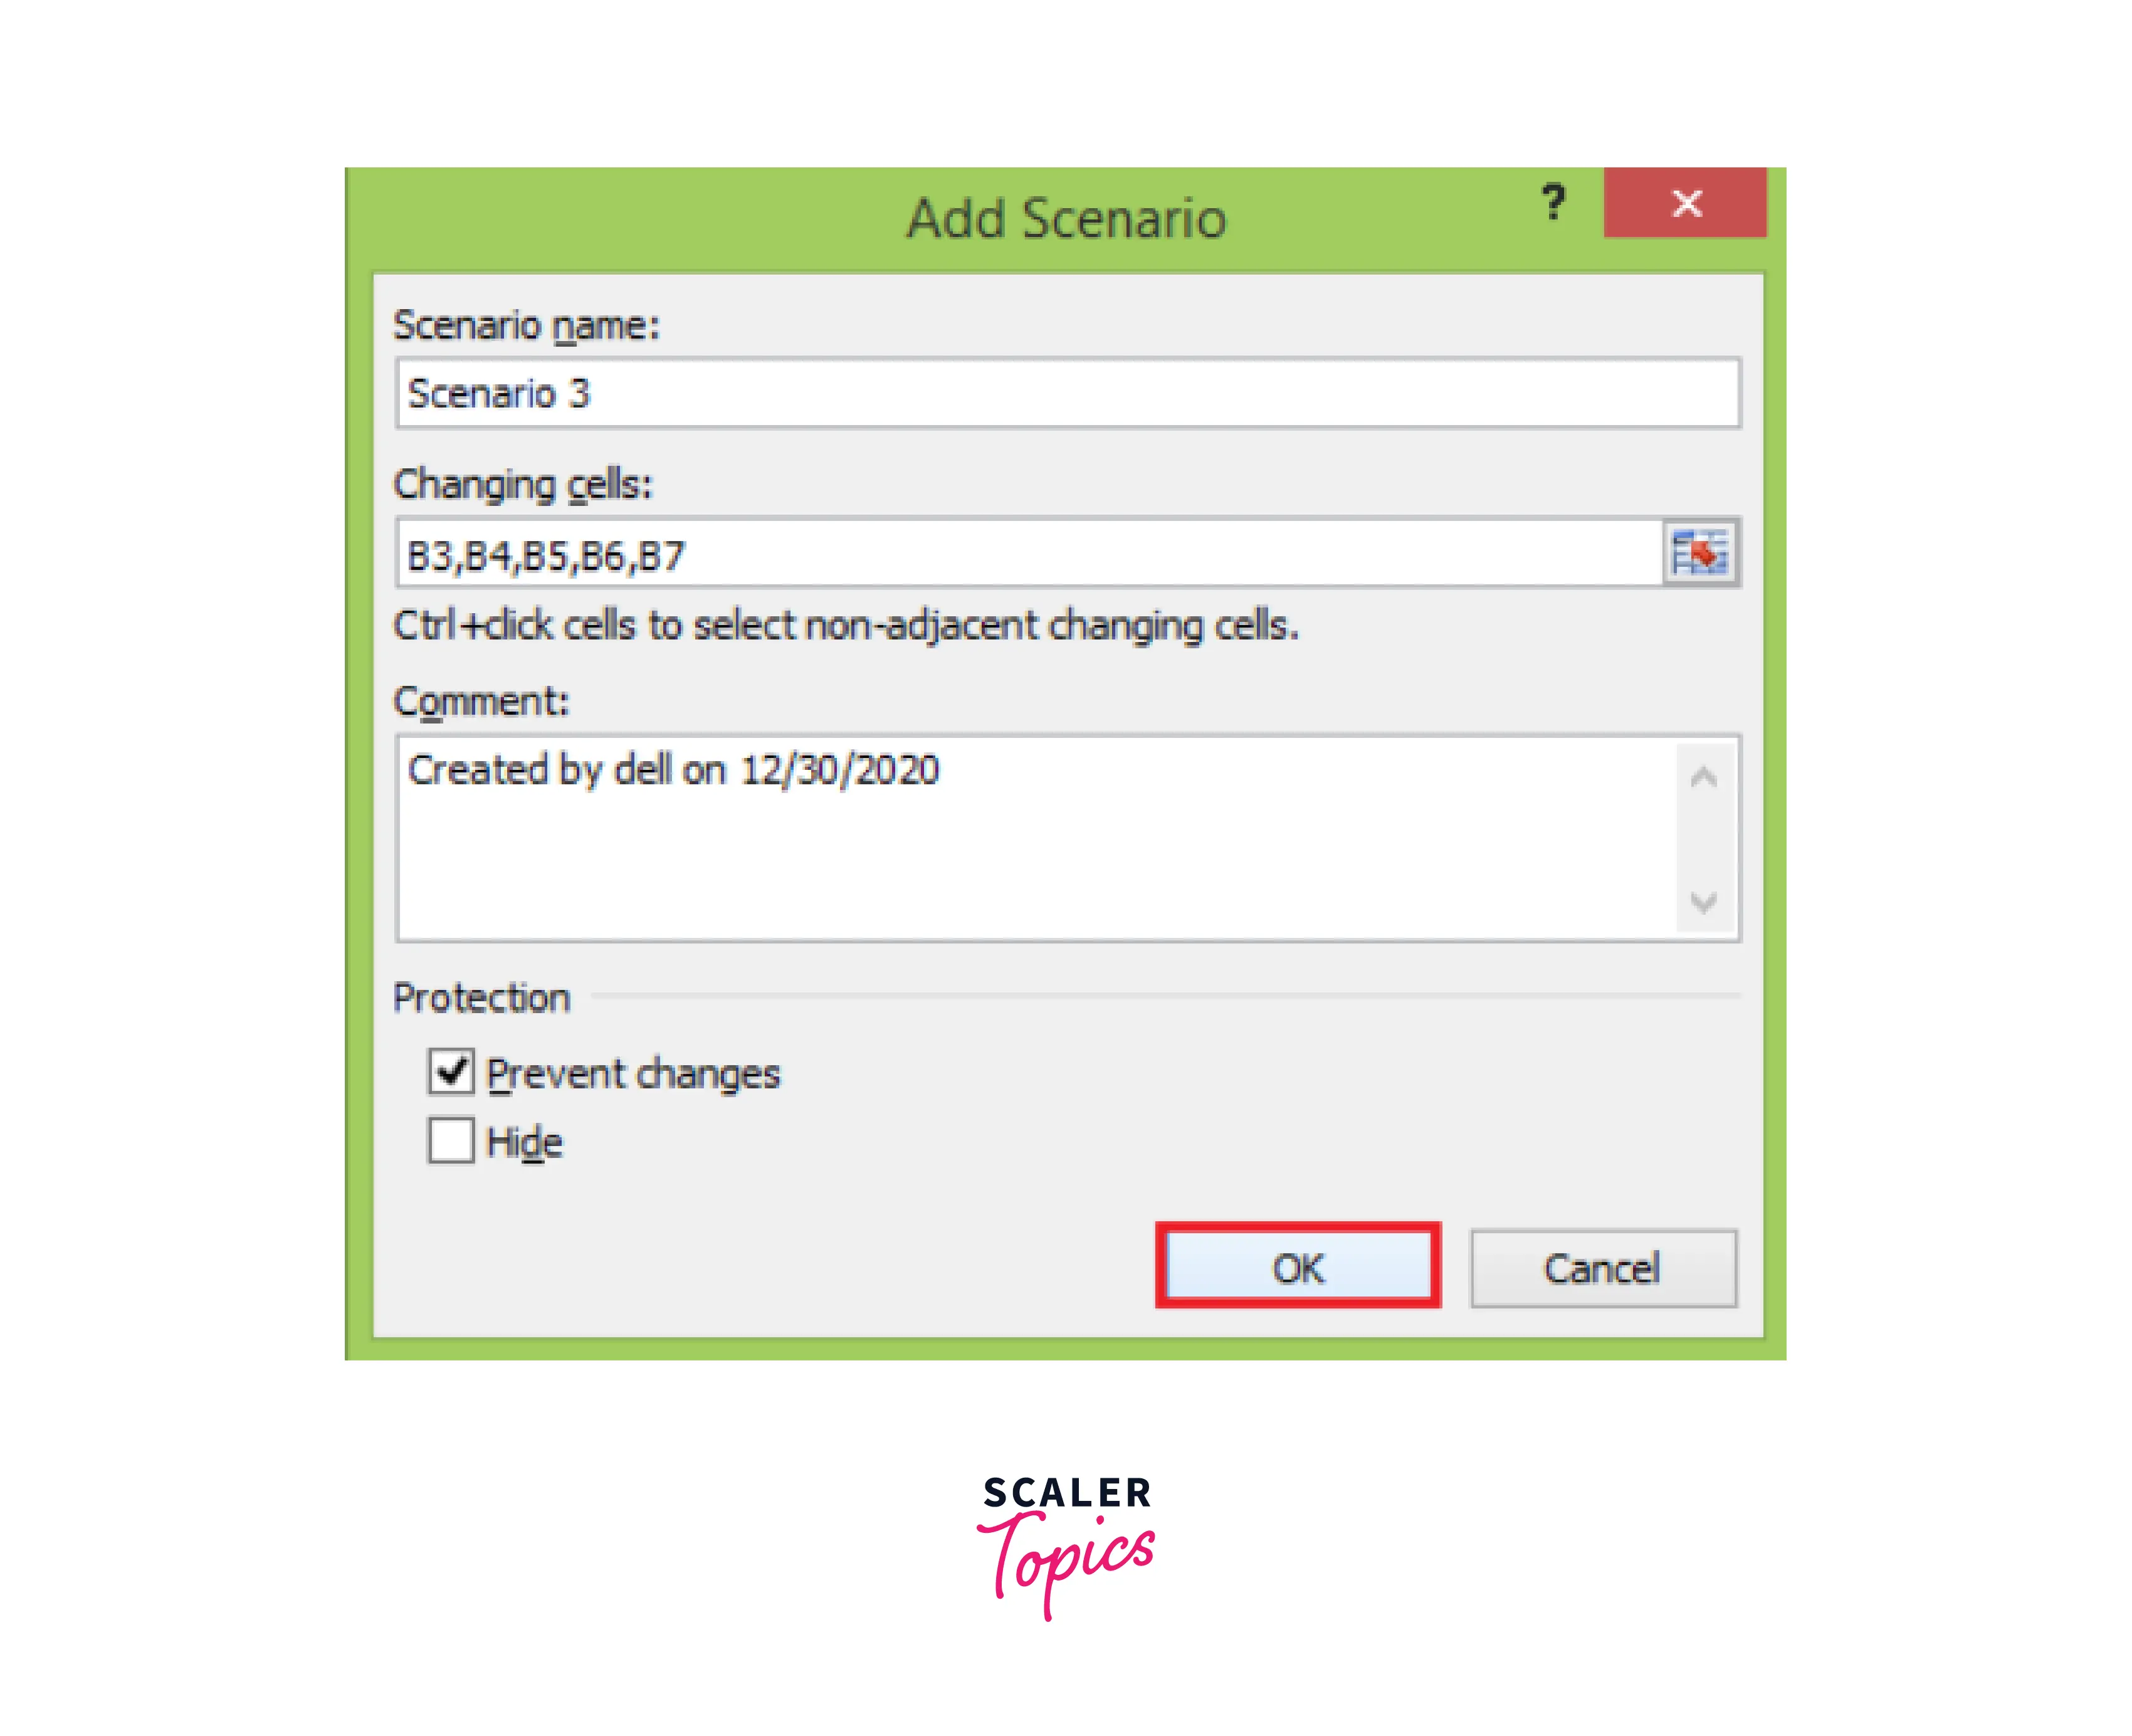
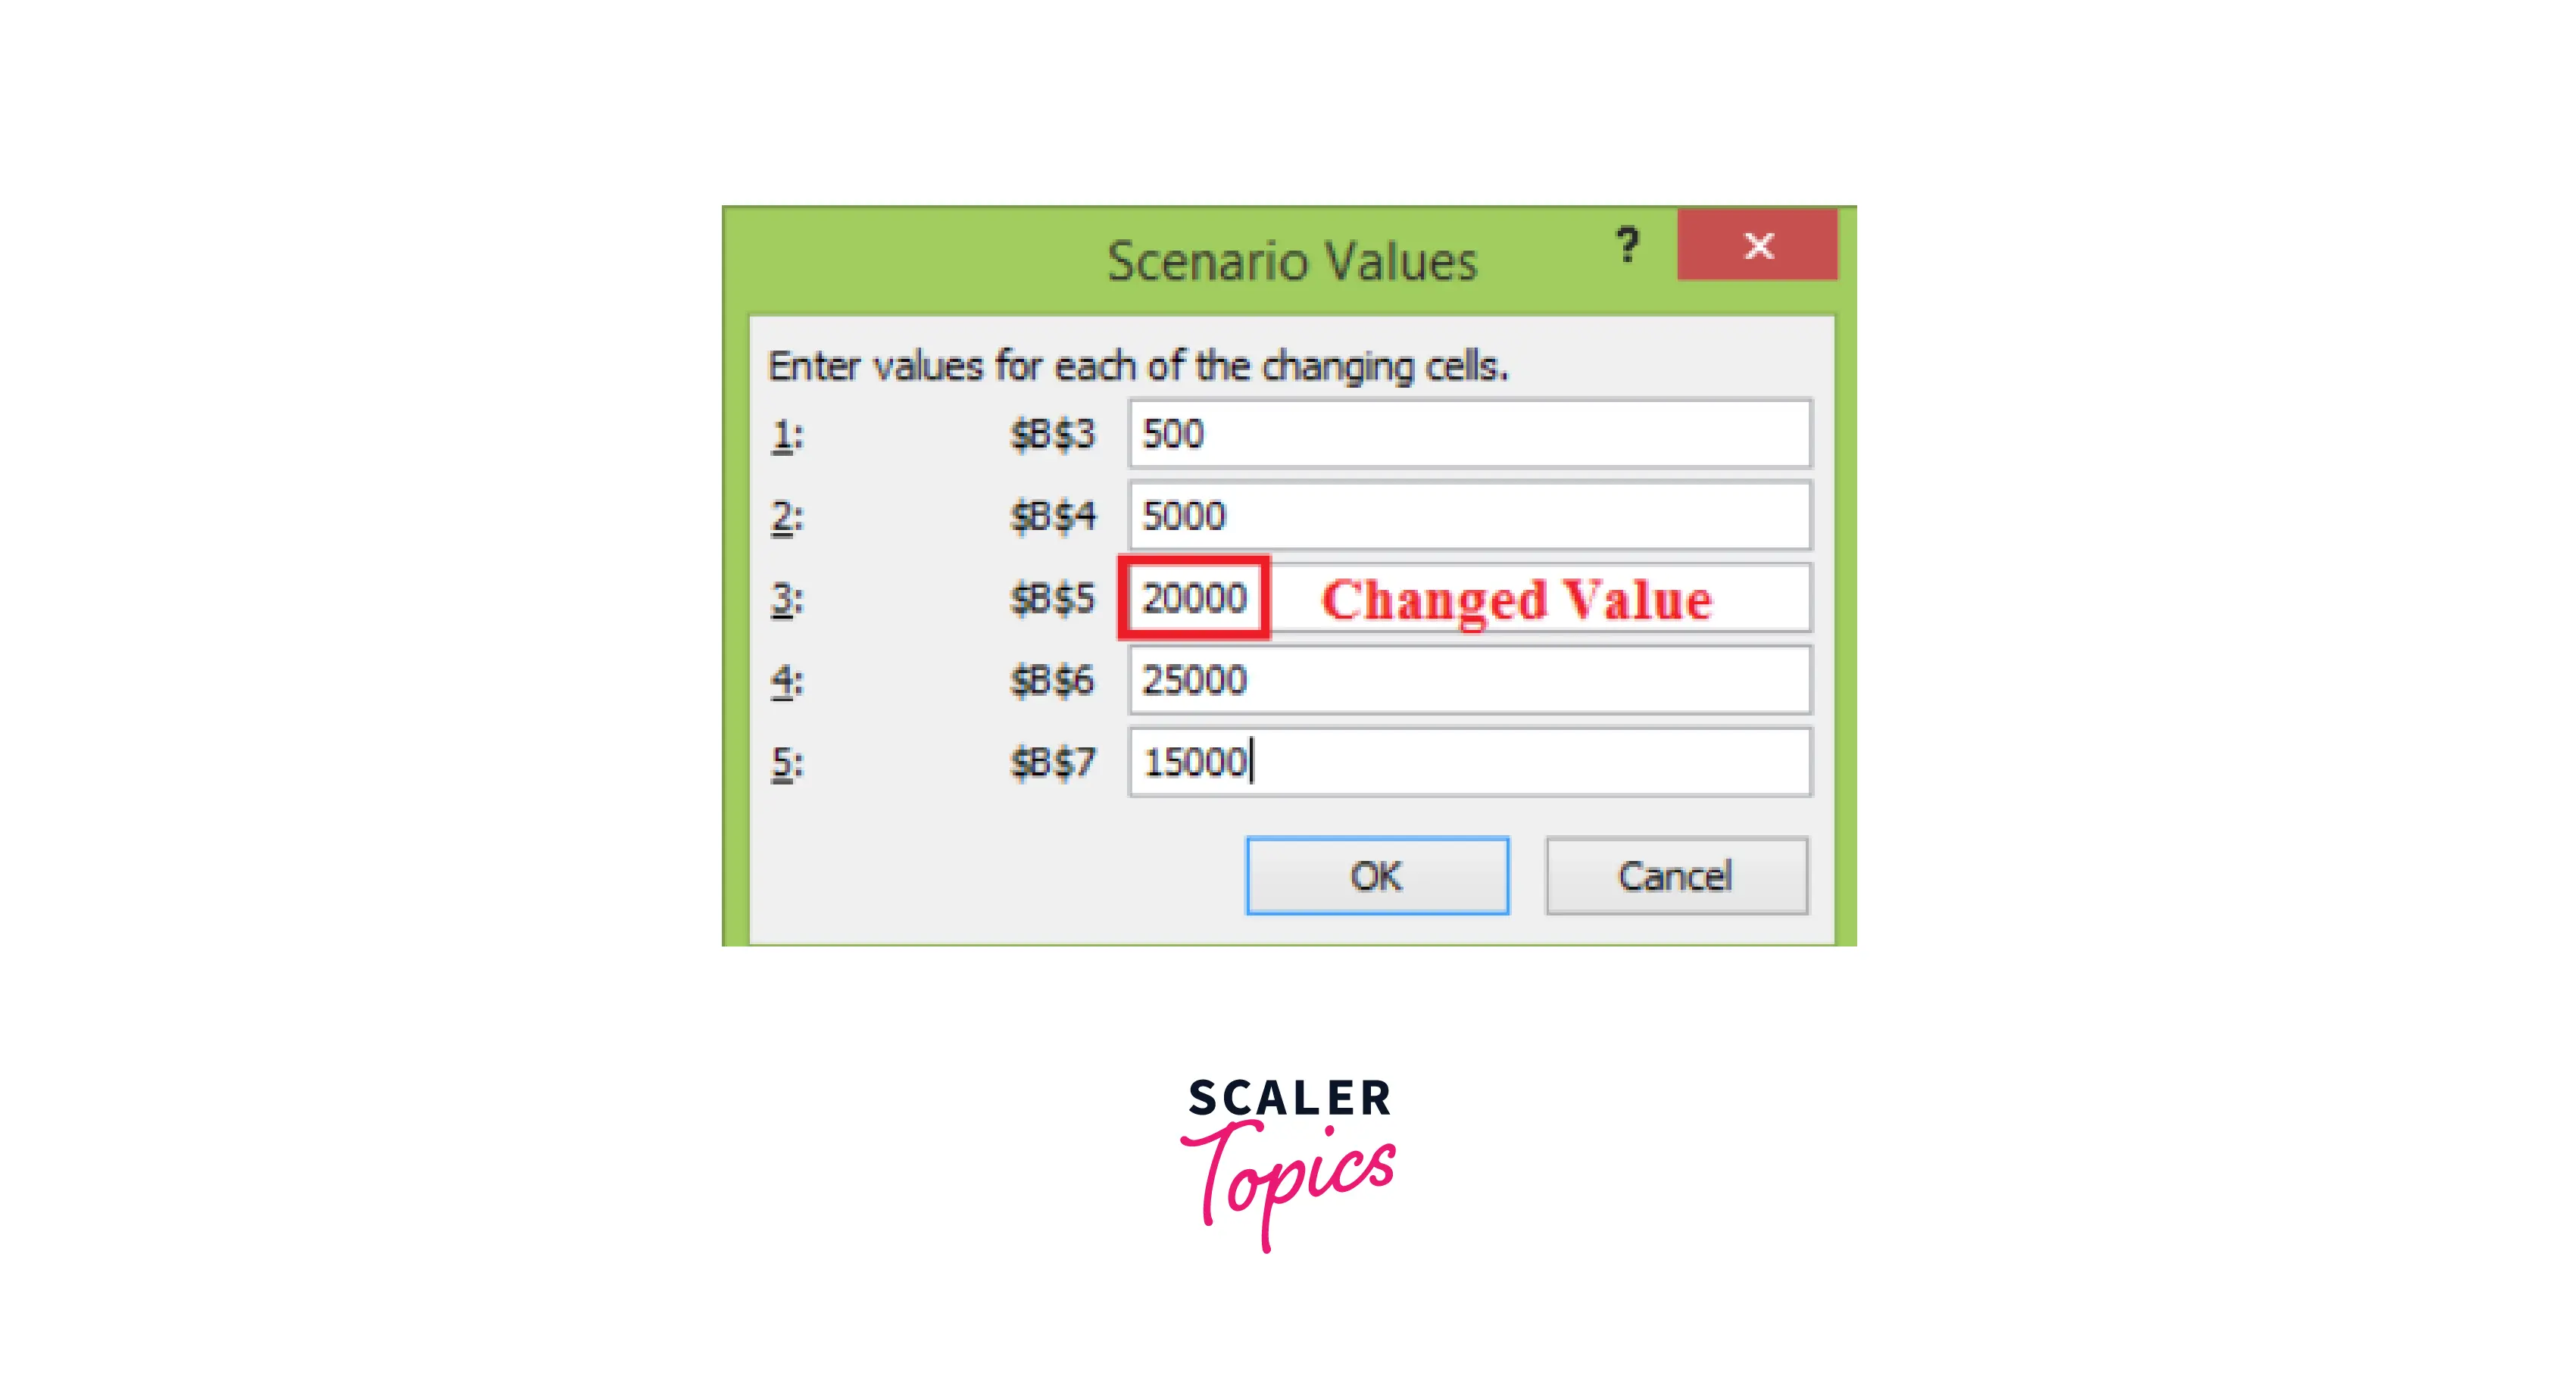
- Similarly, create Scenario 3 and click the Ok button.
- Again, appears scenario values box appears with a changed value of the B5 cell.
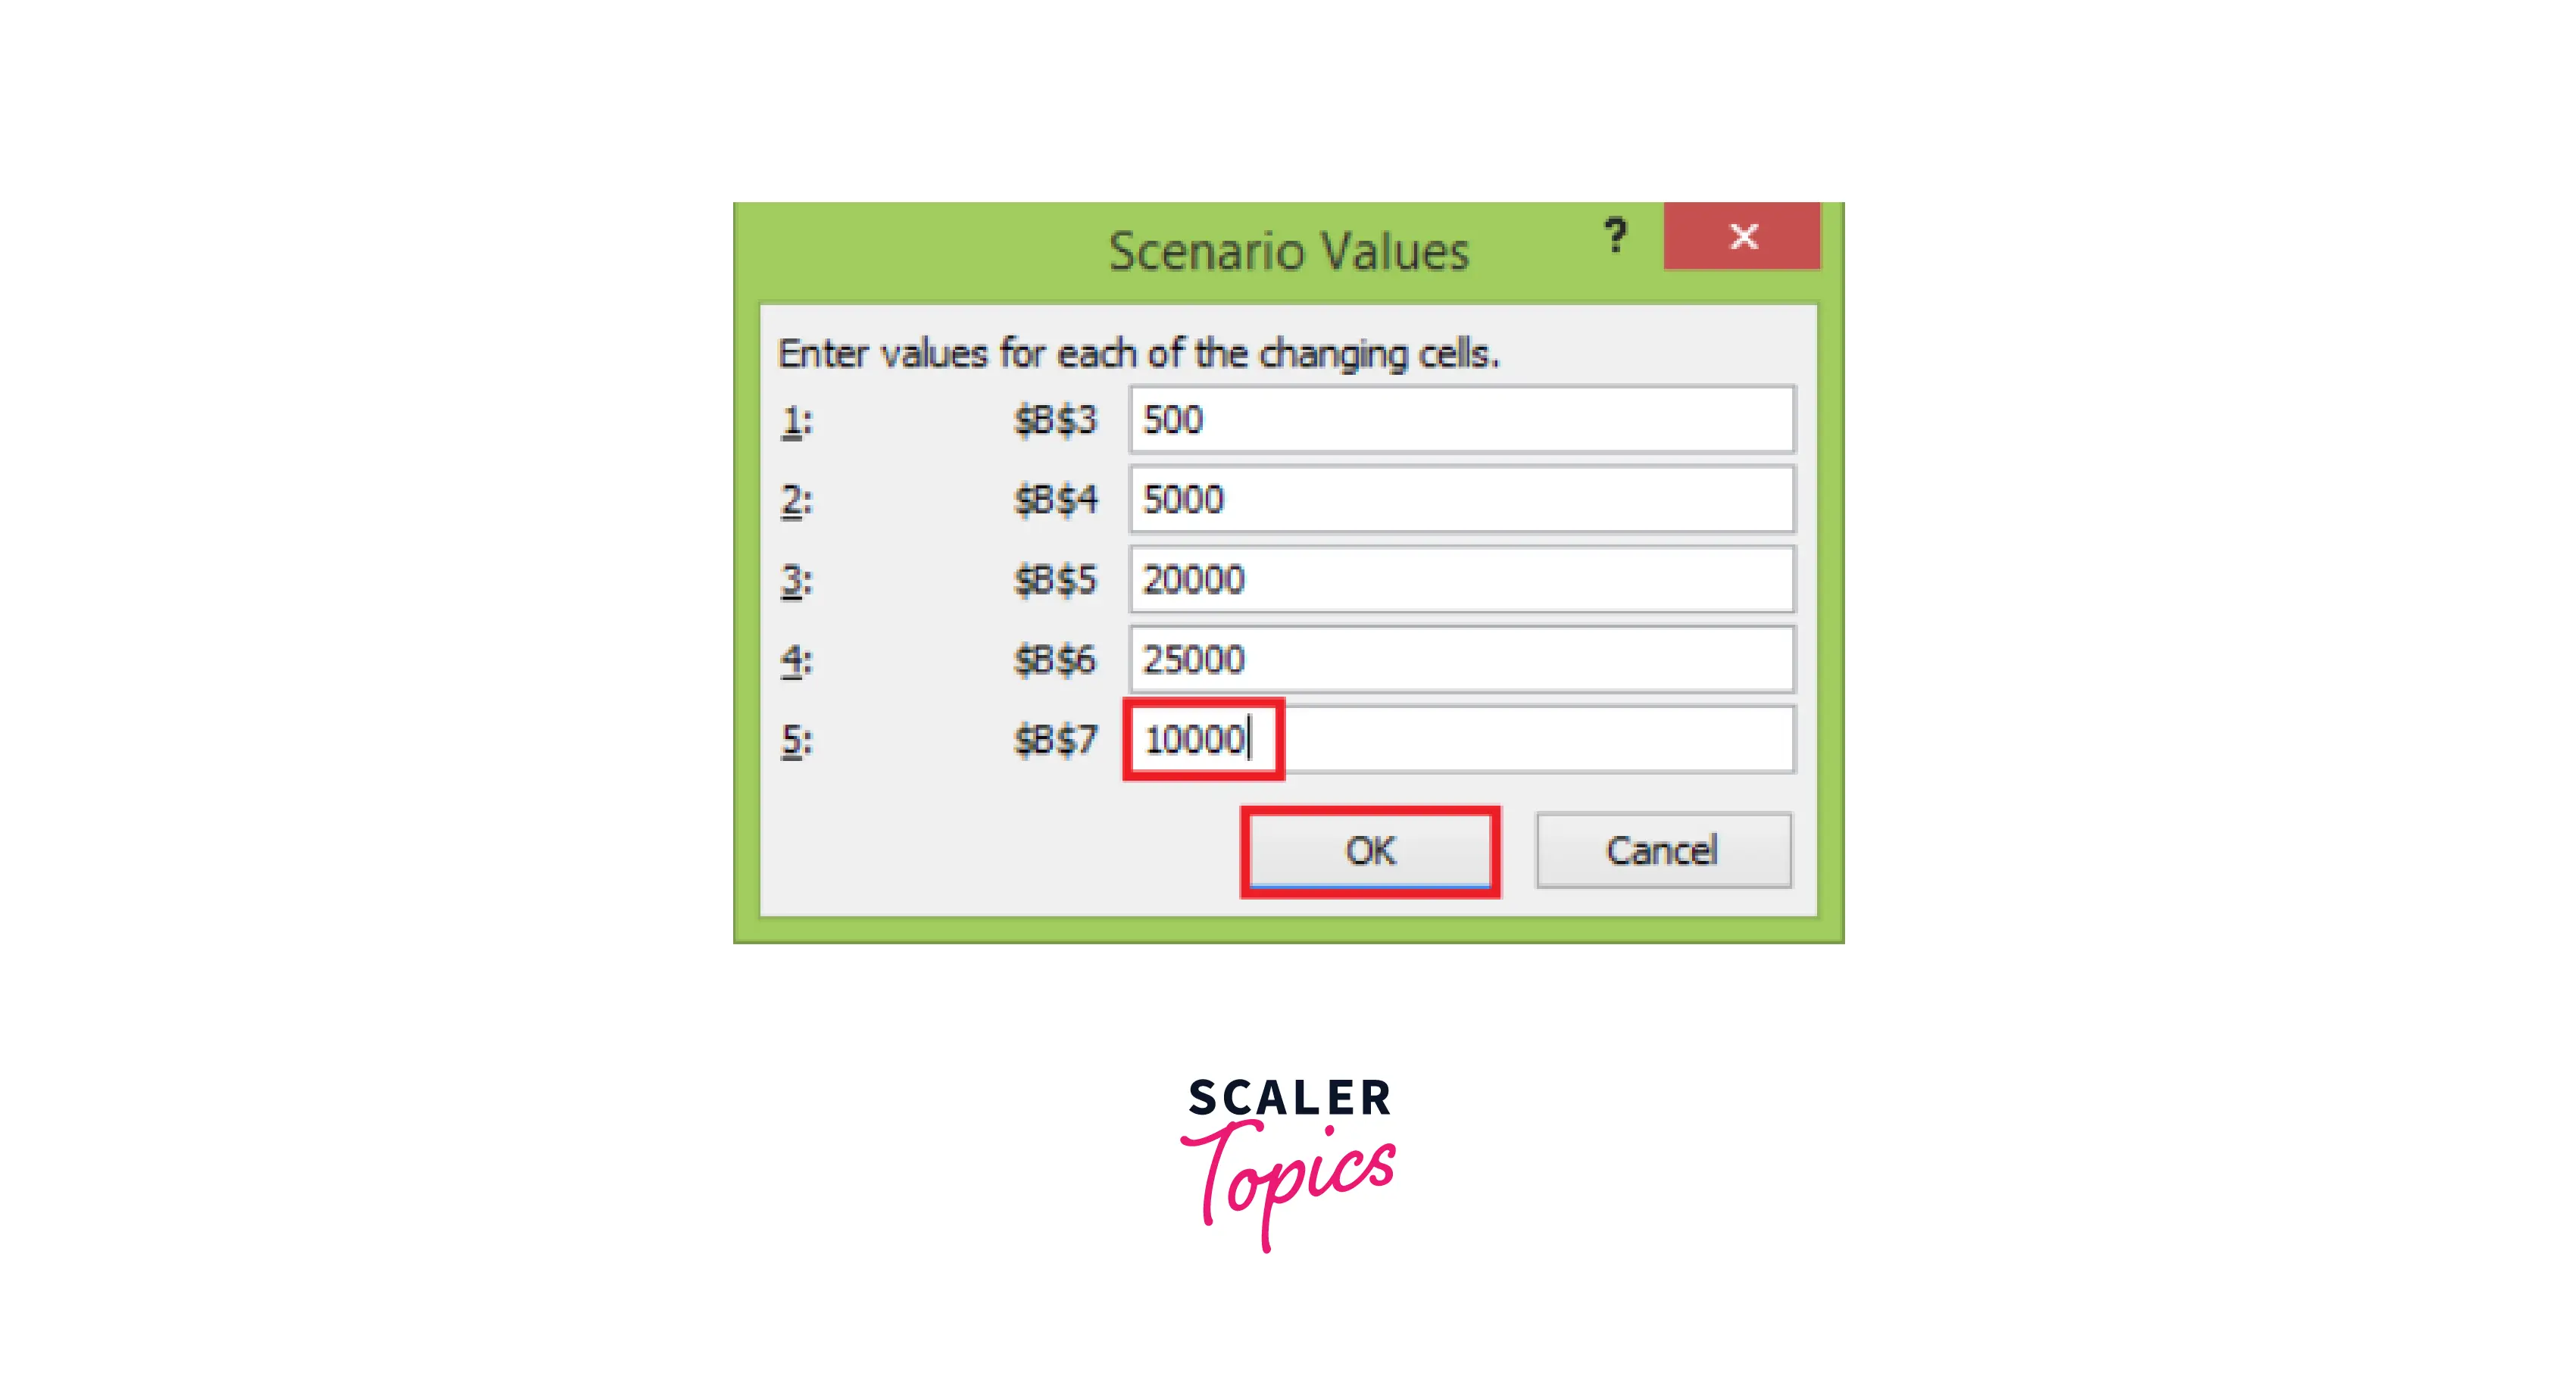
- Change the value of B7 to 10000 and click the Ok button
The Scenario Manager Dialog box appears. In the box under Scenarios, You will find the names of all the scenarios you created.
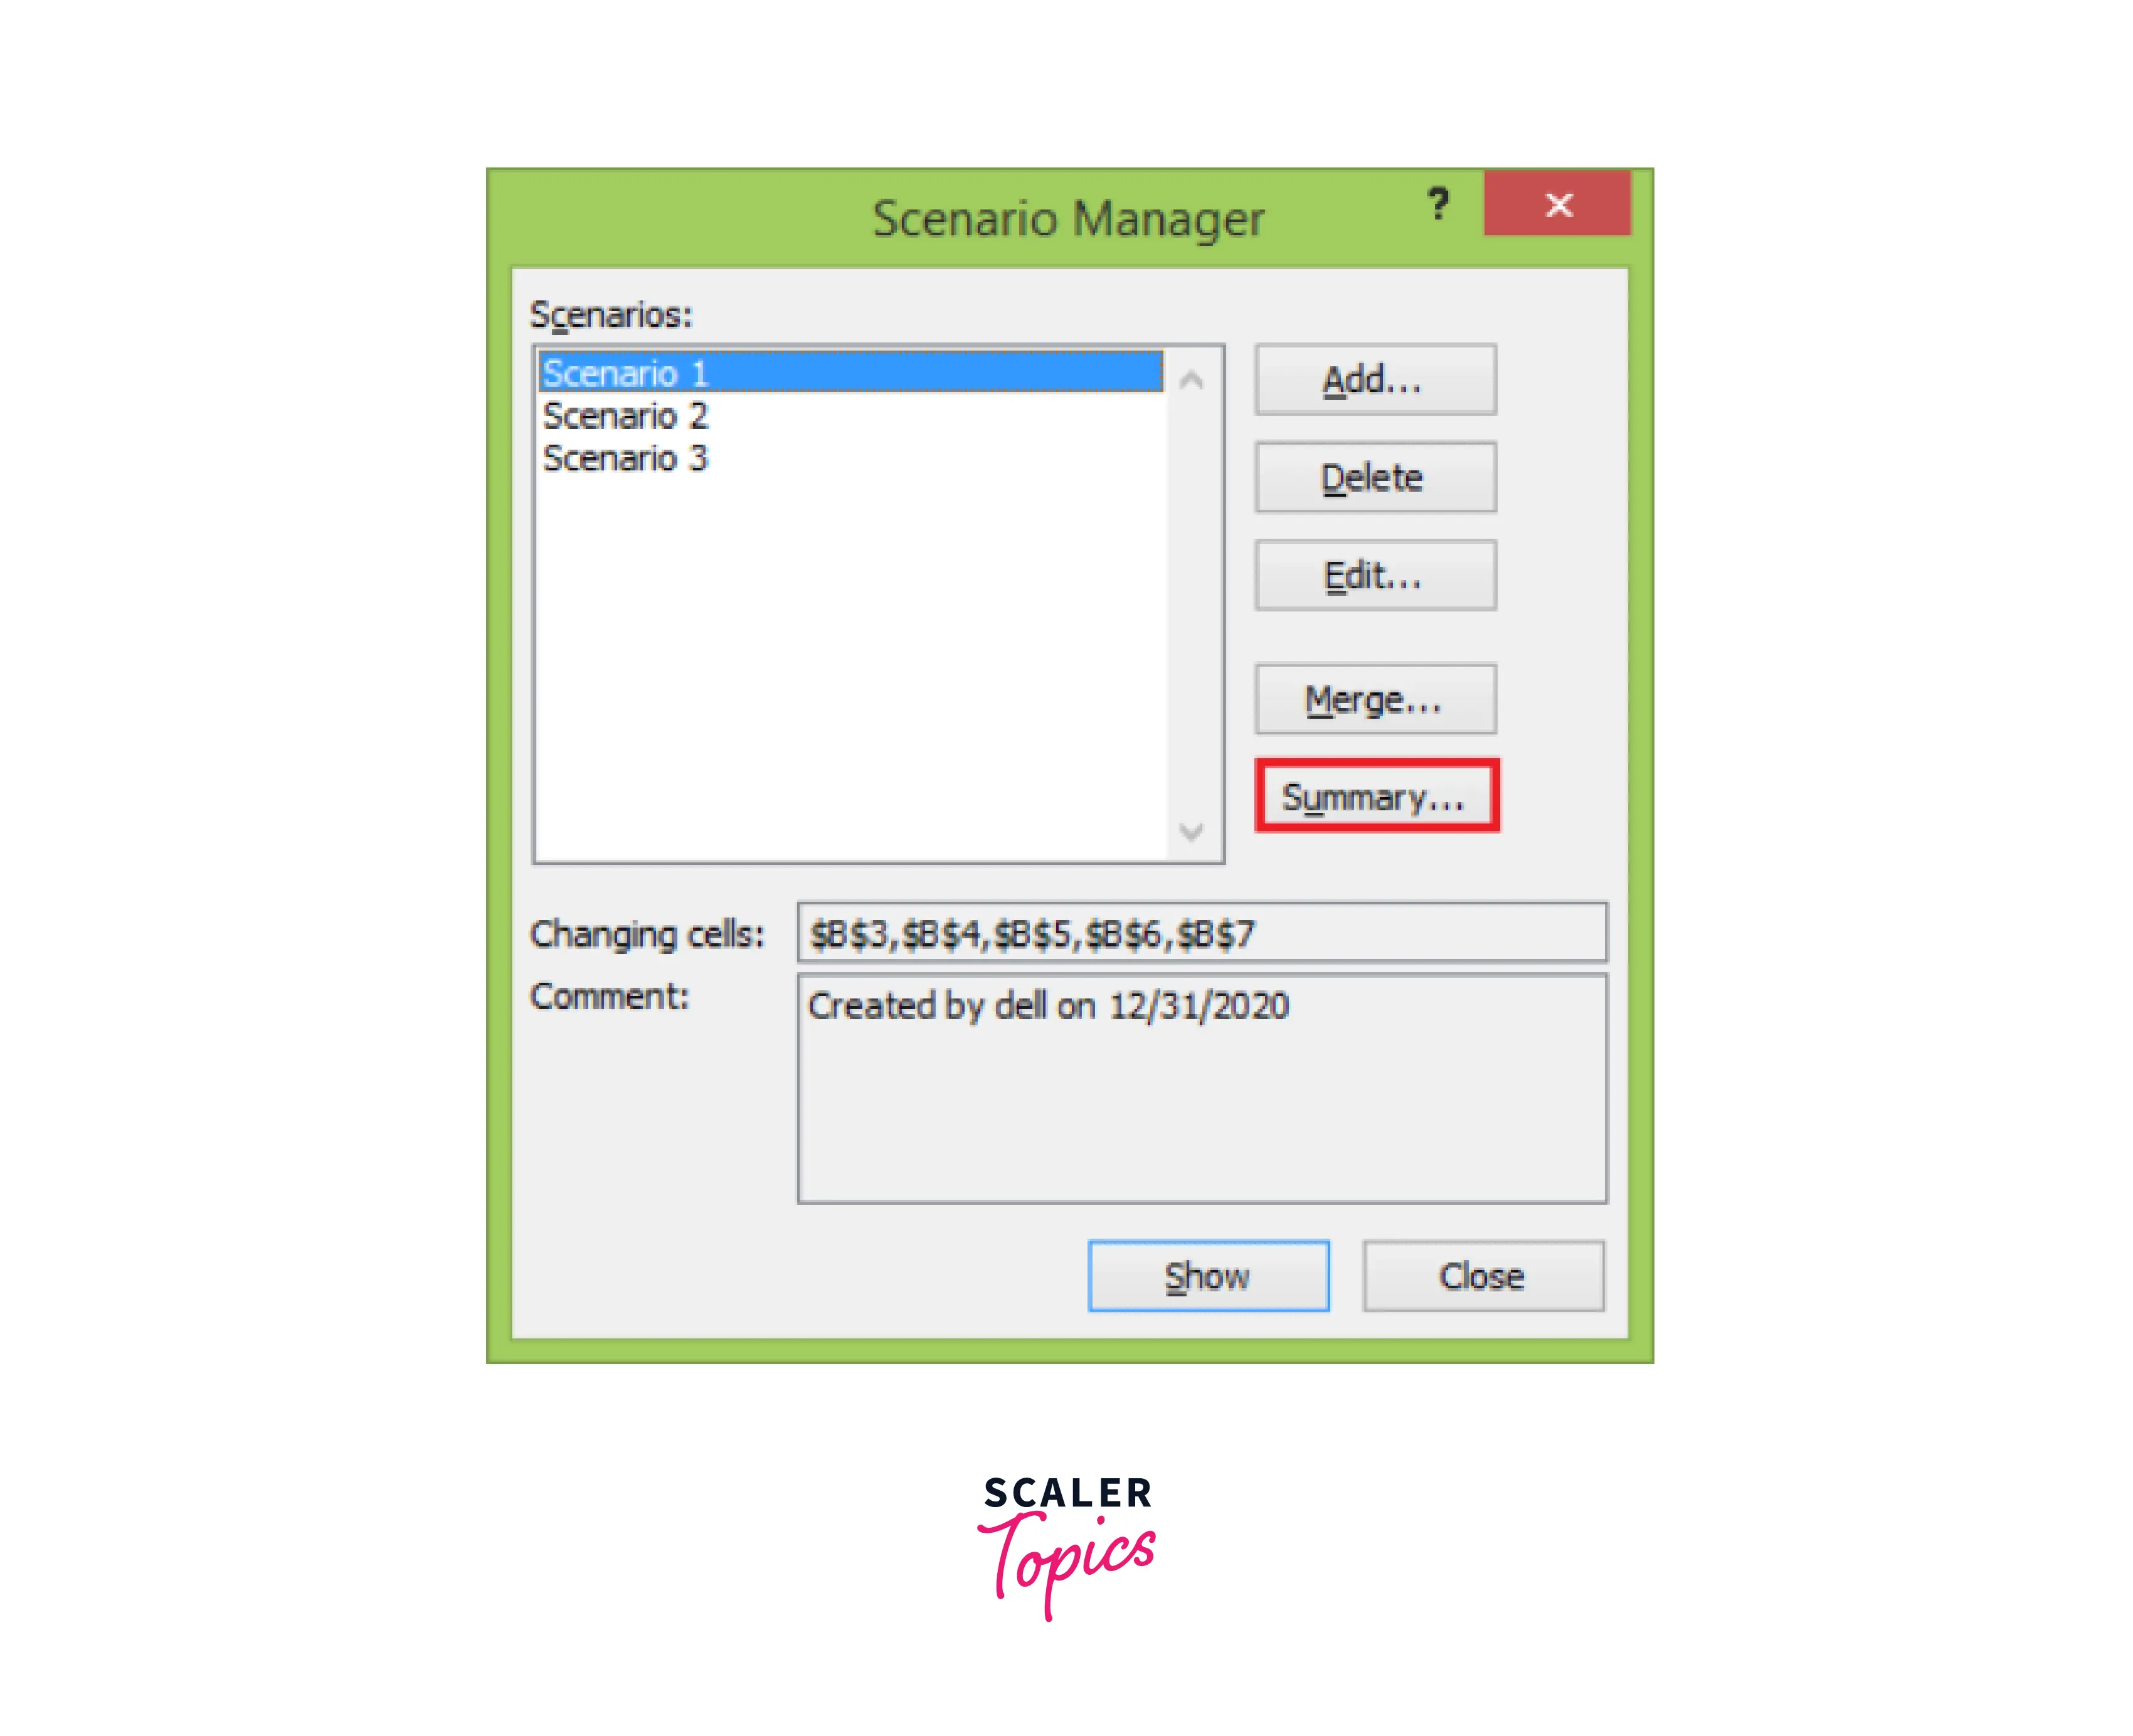
Now, click on the Summary button. The Scenario Summary dialog box appears.

Excel provides two types of Scenario Summary reports:
- Scenario summary.
- Scenario PivotTable report.
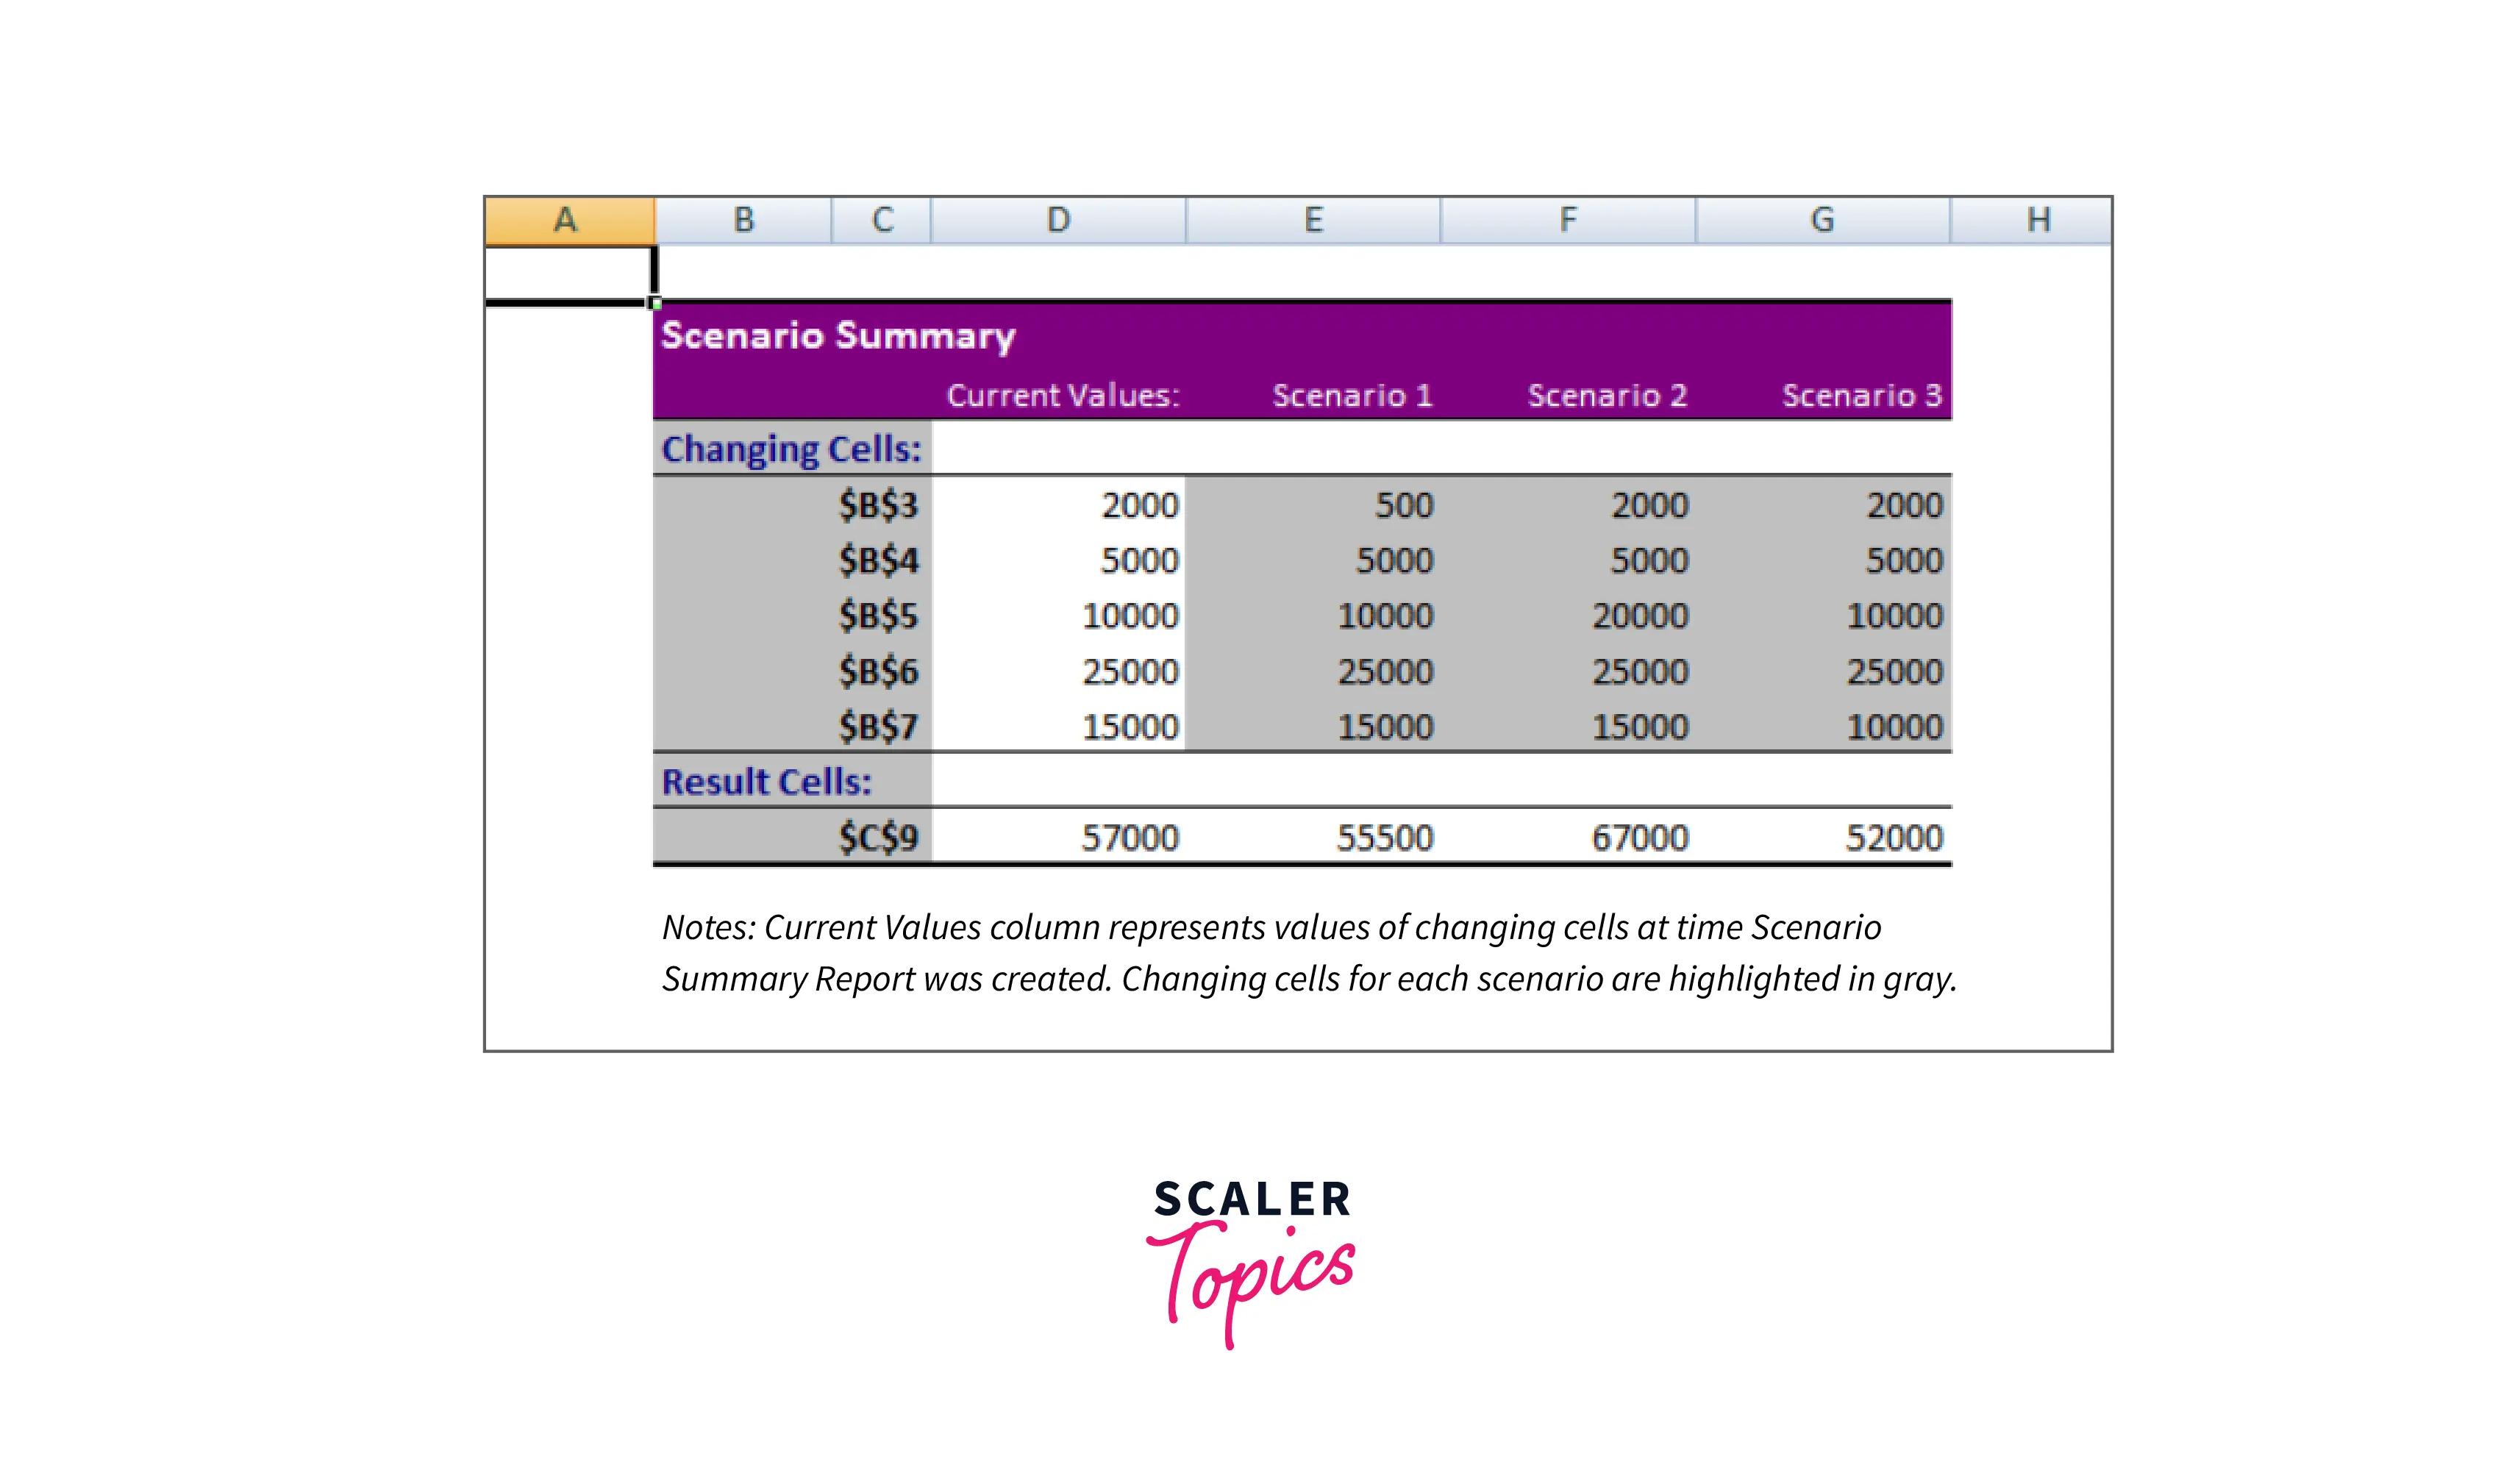
Select Scenario Summary under Report type and click Ok. The Scenario Summary report appears in a new worksheet. You will get the following Scenario summary report.
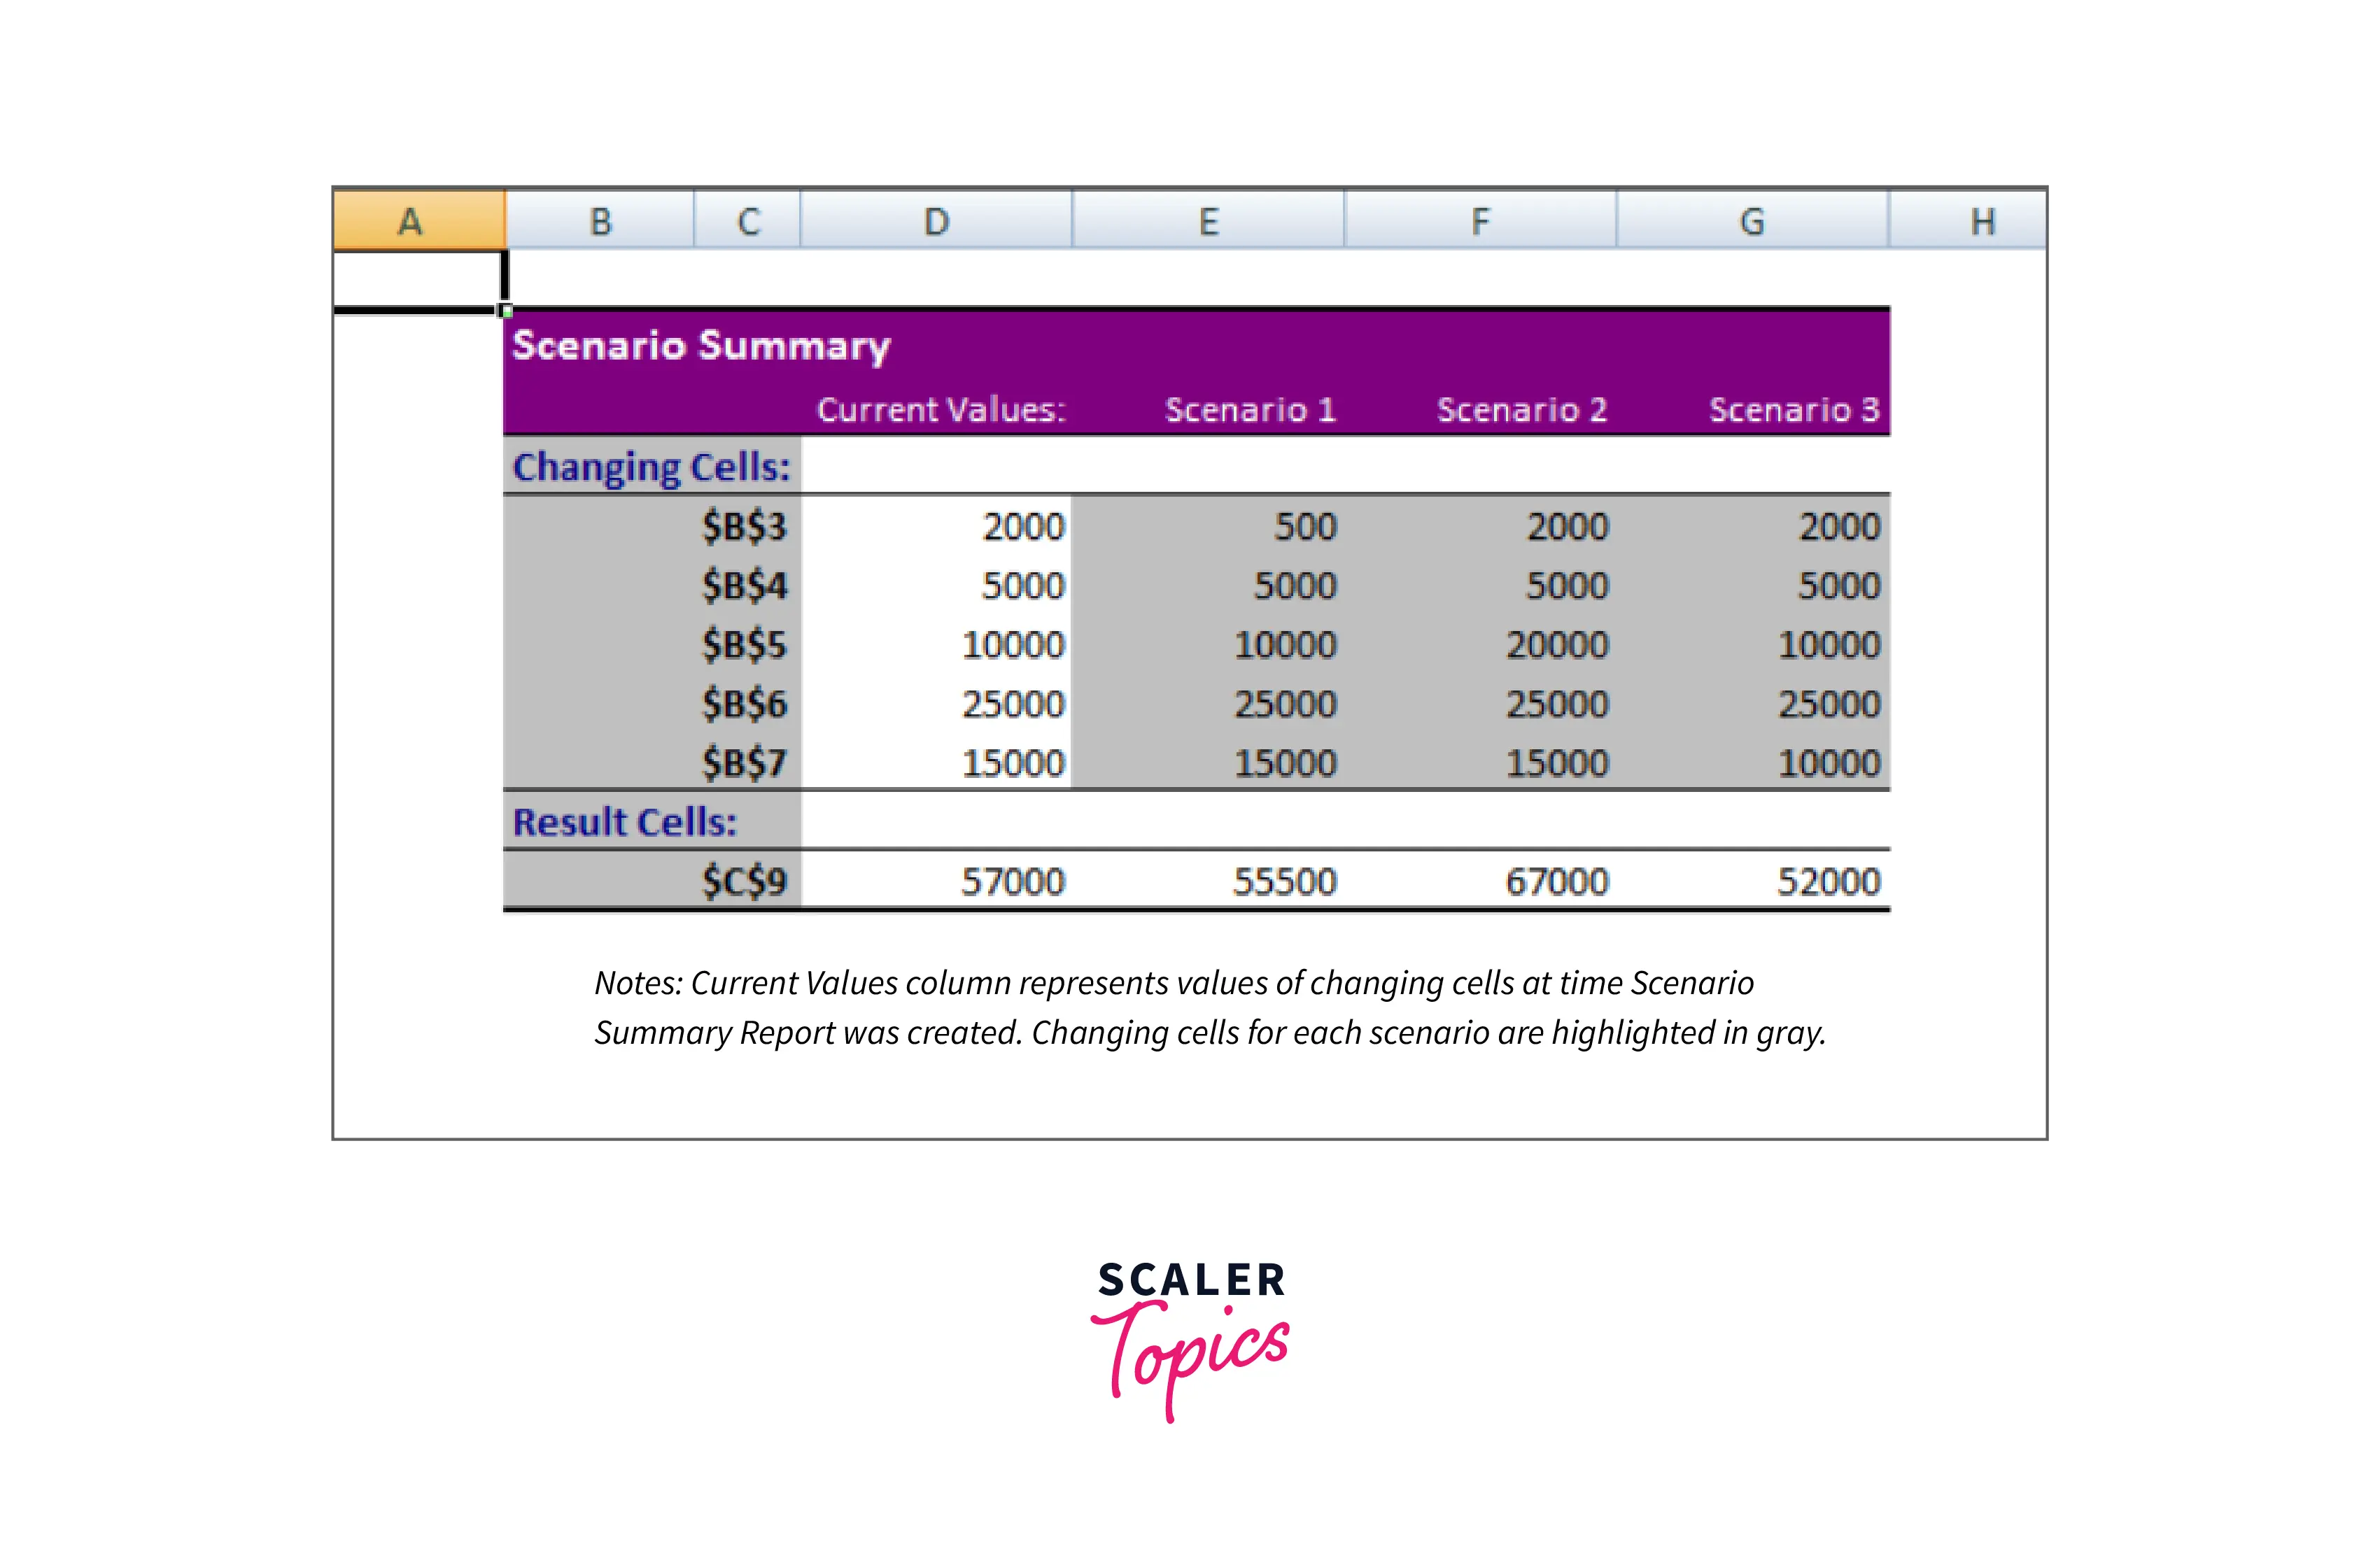
You can observe the following in the Scenario Summary report:
- Changing Cells:
Enlists all the cells used as changing cells. - Result Cells:
Displays the result cell specified. - Current Values:
It is the first column and enlists the values of that scenario selected in the Scenario Manager Dialog box before creating the summary report. - The changing cells will be highlighted in gray for all the scenarios you have created.
- In the $C$9 row, the result values for each scenario will be displayed.
Testing
Performing testing in what-if scenario analysis in Excel involves verifying the model's accuracy and ensuring that it provides reliable results. Here are some steps to follow when testing what-if scenarios in Excel:
- Verify the accuracy of formulas and functions used in the model
- Ensure that all inputs and assumptions are correct and up-to-date
- Test different scenarios by changing inputs and checking the corresponding outputs
- Compare the results of what-if scenarios with actual outcomes, where possible
- Check for errors or inconsistencies in the model, and make adjustments as necessary
- Use data validation to restrict inputs to acceptable ranges and prevent errors
- Check for circular references and resolve them, if any exist
- Test the model under extreme scenarios to ensure accuracy and reliability.
Documenting the testing process and results is important to ensure that the model remains accurate and reliable over time. By following these steps, you can perform effective testing on what-if scenario analysis in Excel, ensuring that your model provides accurate and reliable results.
More on What If Scenario Analysis in Excel
Excel is a powerful tool for conducting what-if scenario analysis, which involves changing inputs and analyzing the impact on outputs. With the ongoing technological developments, Excel's future in what-if scenario analysis looks bright.
Excel has become more intuitive and user-friendly in recent years, with features such as data modeling, dynamic arrays, and Power Query. These features allow users to handle large datasets, automate calculations, and generate more sophisticated visualizations. Additionally, Excel has introduced new data visualization tools, such as Power BI, which allows users to create more interactive and dynamic dashboards.
Moreover, with the emergence of cloud computing and artificial intelligence, Excel can now integrate with more advanced analytics tools to enable more powerful what-if analysis. For instance, users can leverage cloud-based services such as Azure Machine Learning to build predictive models and generate more accurate forecasts.
In summary, the future of what-if scenario analysis in Excel is promising as Excel continues to evolve and integrate with more advanced tools, making it a reliable and efficient platform for data analysis and decision-making.
Conclusion
In conclusion, what-if scenario analysis is a powerful tool for decision-making and forecasting in various fields, including finance, engineering, and healthcare. Here are seven key takeaways from this article on what-if scenario analysis:
- What-if scenario analysis allows users to analyze the impact of changing inputs and assumptions on outputs and outcomes.
- Excel is a popular platform for what-if scenario analysis, providing users with a range of powerful tools for modeling and forecasting.
- Cloud-based services and artificial intelligence are helping to enhance the capabilities of what-if scenario analysis, providing users with more accurate and reliable results.
- Proper testing and validation are essential to ensuring the accuracy and reliability of what-if scenario analysis models.
- What-if scenario analysis can support decision-making in various areas, including budgeting, strategic planning, and risk management.
- What-if scenario analysis can also evaluate the impact of external factors, such as economic changes or natural disasters, on an organization or system.
- With the increasing availability of data and advanced analytics tools, what-if scenario analysis is becoming more sophisticated and powerful, enabling users to make more informed decisions and achieve better outcomes.
Overall, what-if scenario analysis is critical for decision-makers, providing various benefits and opportunities for organizations and individuals. Users can leverage their power to make better decisions and achieve their goals by understanding the principles and best practices of what-if scenario analysis.