Debugging React Native Apps with Flipper
Overview
When it comes to developing React Native applications, effective debugging is vital for maintaining app stability and performance. That's where Flipper comes in. Developed by Facebook, Flipper is an open-source debugging tool tailored for React Native developers. In this article, we'll dive into the functionalities and advantages of Flipper react native, covering everything from its easy installation process to its built-in features that enhance the debugging workflow. We'll also explore how Flipper react native plugins can be utilized to extend its capabilities and how breakpoints can simplify the debugging process.
What is Flipper?
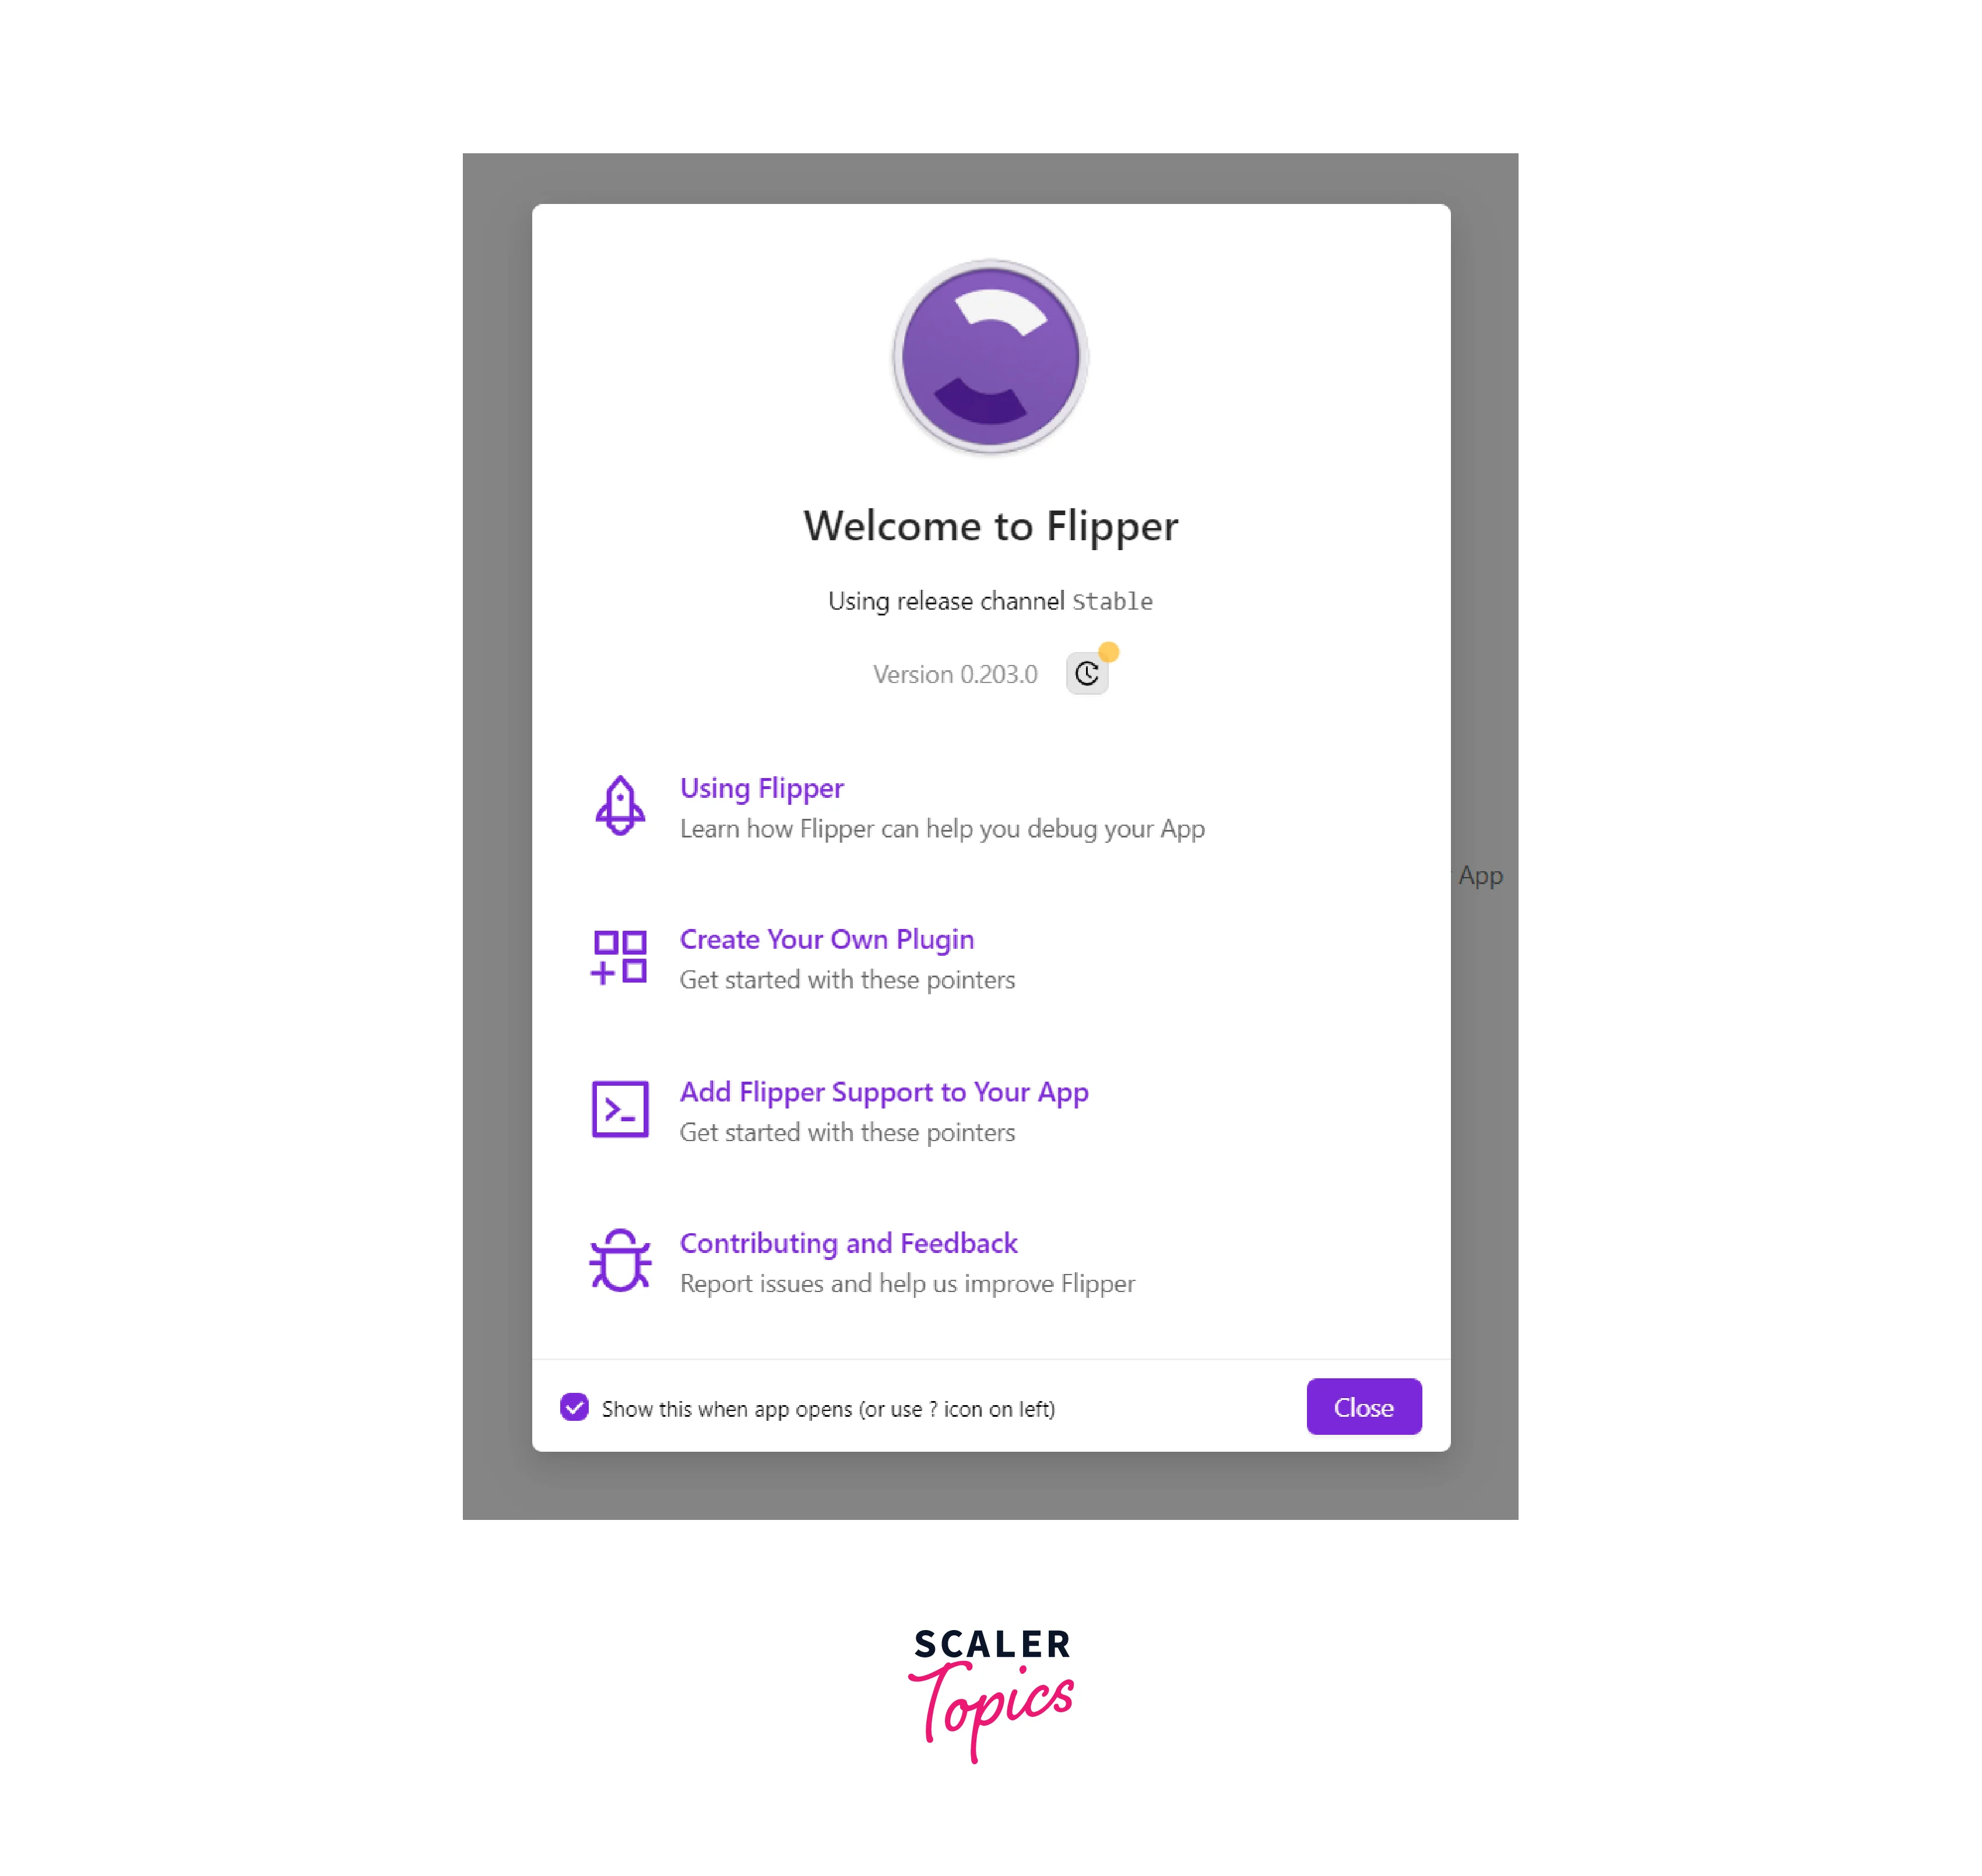
Flipper is a powerful desktop-based debugging tool tailored for React Native developers. It provides an intuitive and visual interface that allows developers to inspect and debug their React Native applications efficiently. Flipper react nativeoffers a wide range of built-in features, including native logs, React DevTools integration, network debugging, Redux debugger, shared preferences viewer, and native layout inspection.
Installing Flipper
Depending on the operating system you are using, it is necessary to have the Android and iOS development tools installed. This requirement is logical as Flipper relies on these tools for its functionality. Another prerequisite is the installation of OpenSSL.
Android
To begin using Flipper on Android, launch the Flipper Desktop application and initiate your project by executing the command yarn android. This will enable your application to be visible within Flipper.
iOS
For iOS, navigate to the ios directory of your project and run below command.
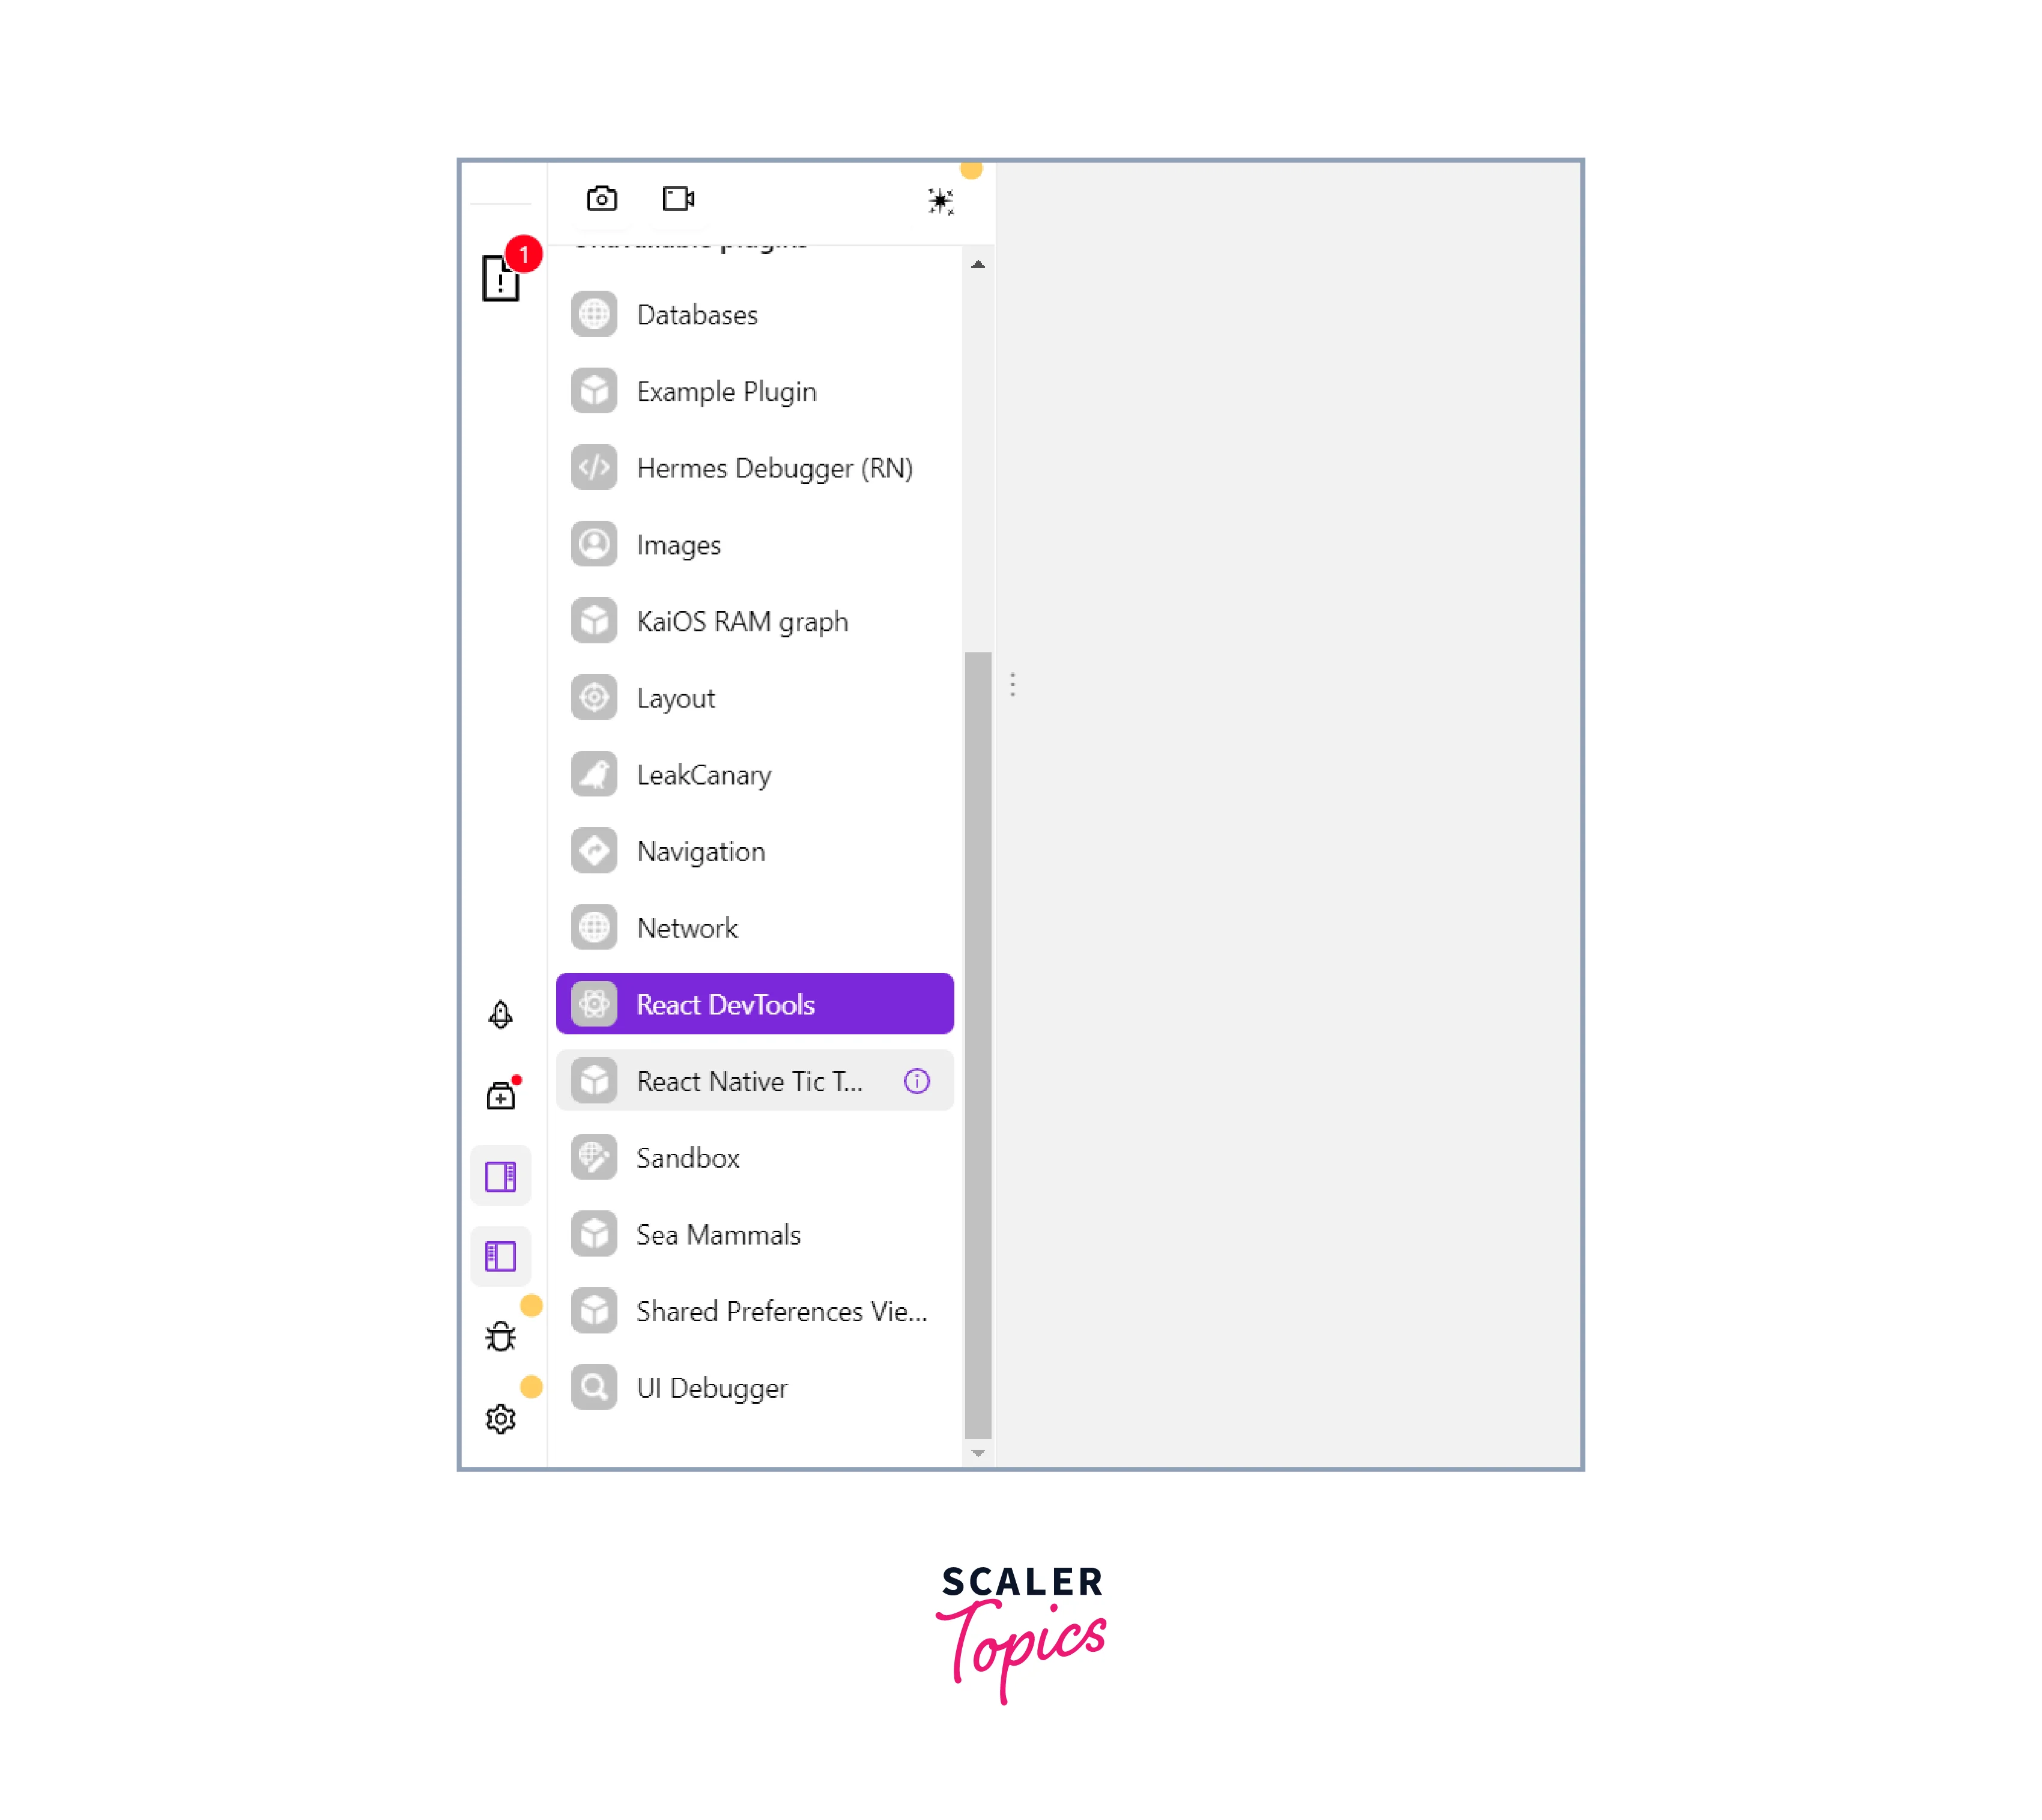
Then, execute the command yarn ios and open Flipper. This will allow your application to be displayed in Flipper. By default, Flipper provides various plugins including the Layout Inspector, Network, Databases, Images, Shared Preferences, Crash Reporter, React DevTools, and Metro Logs.
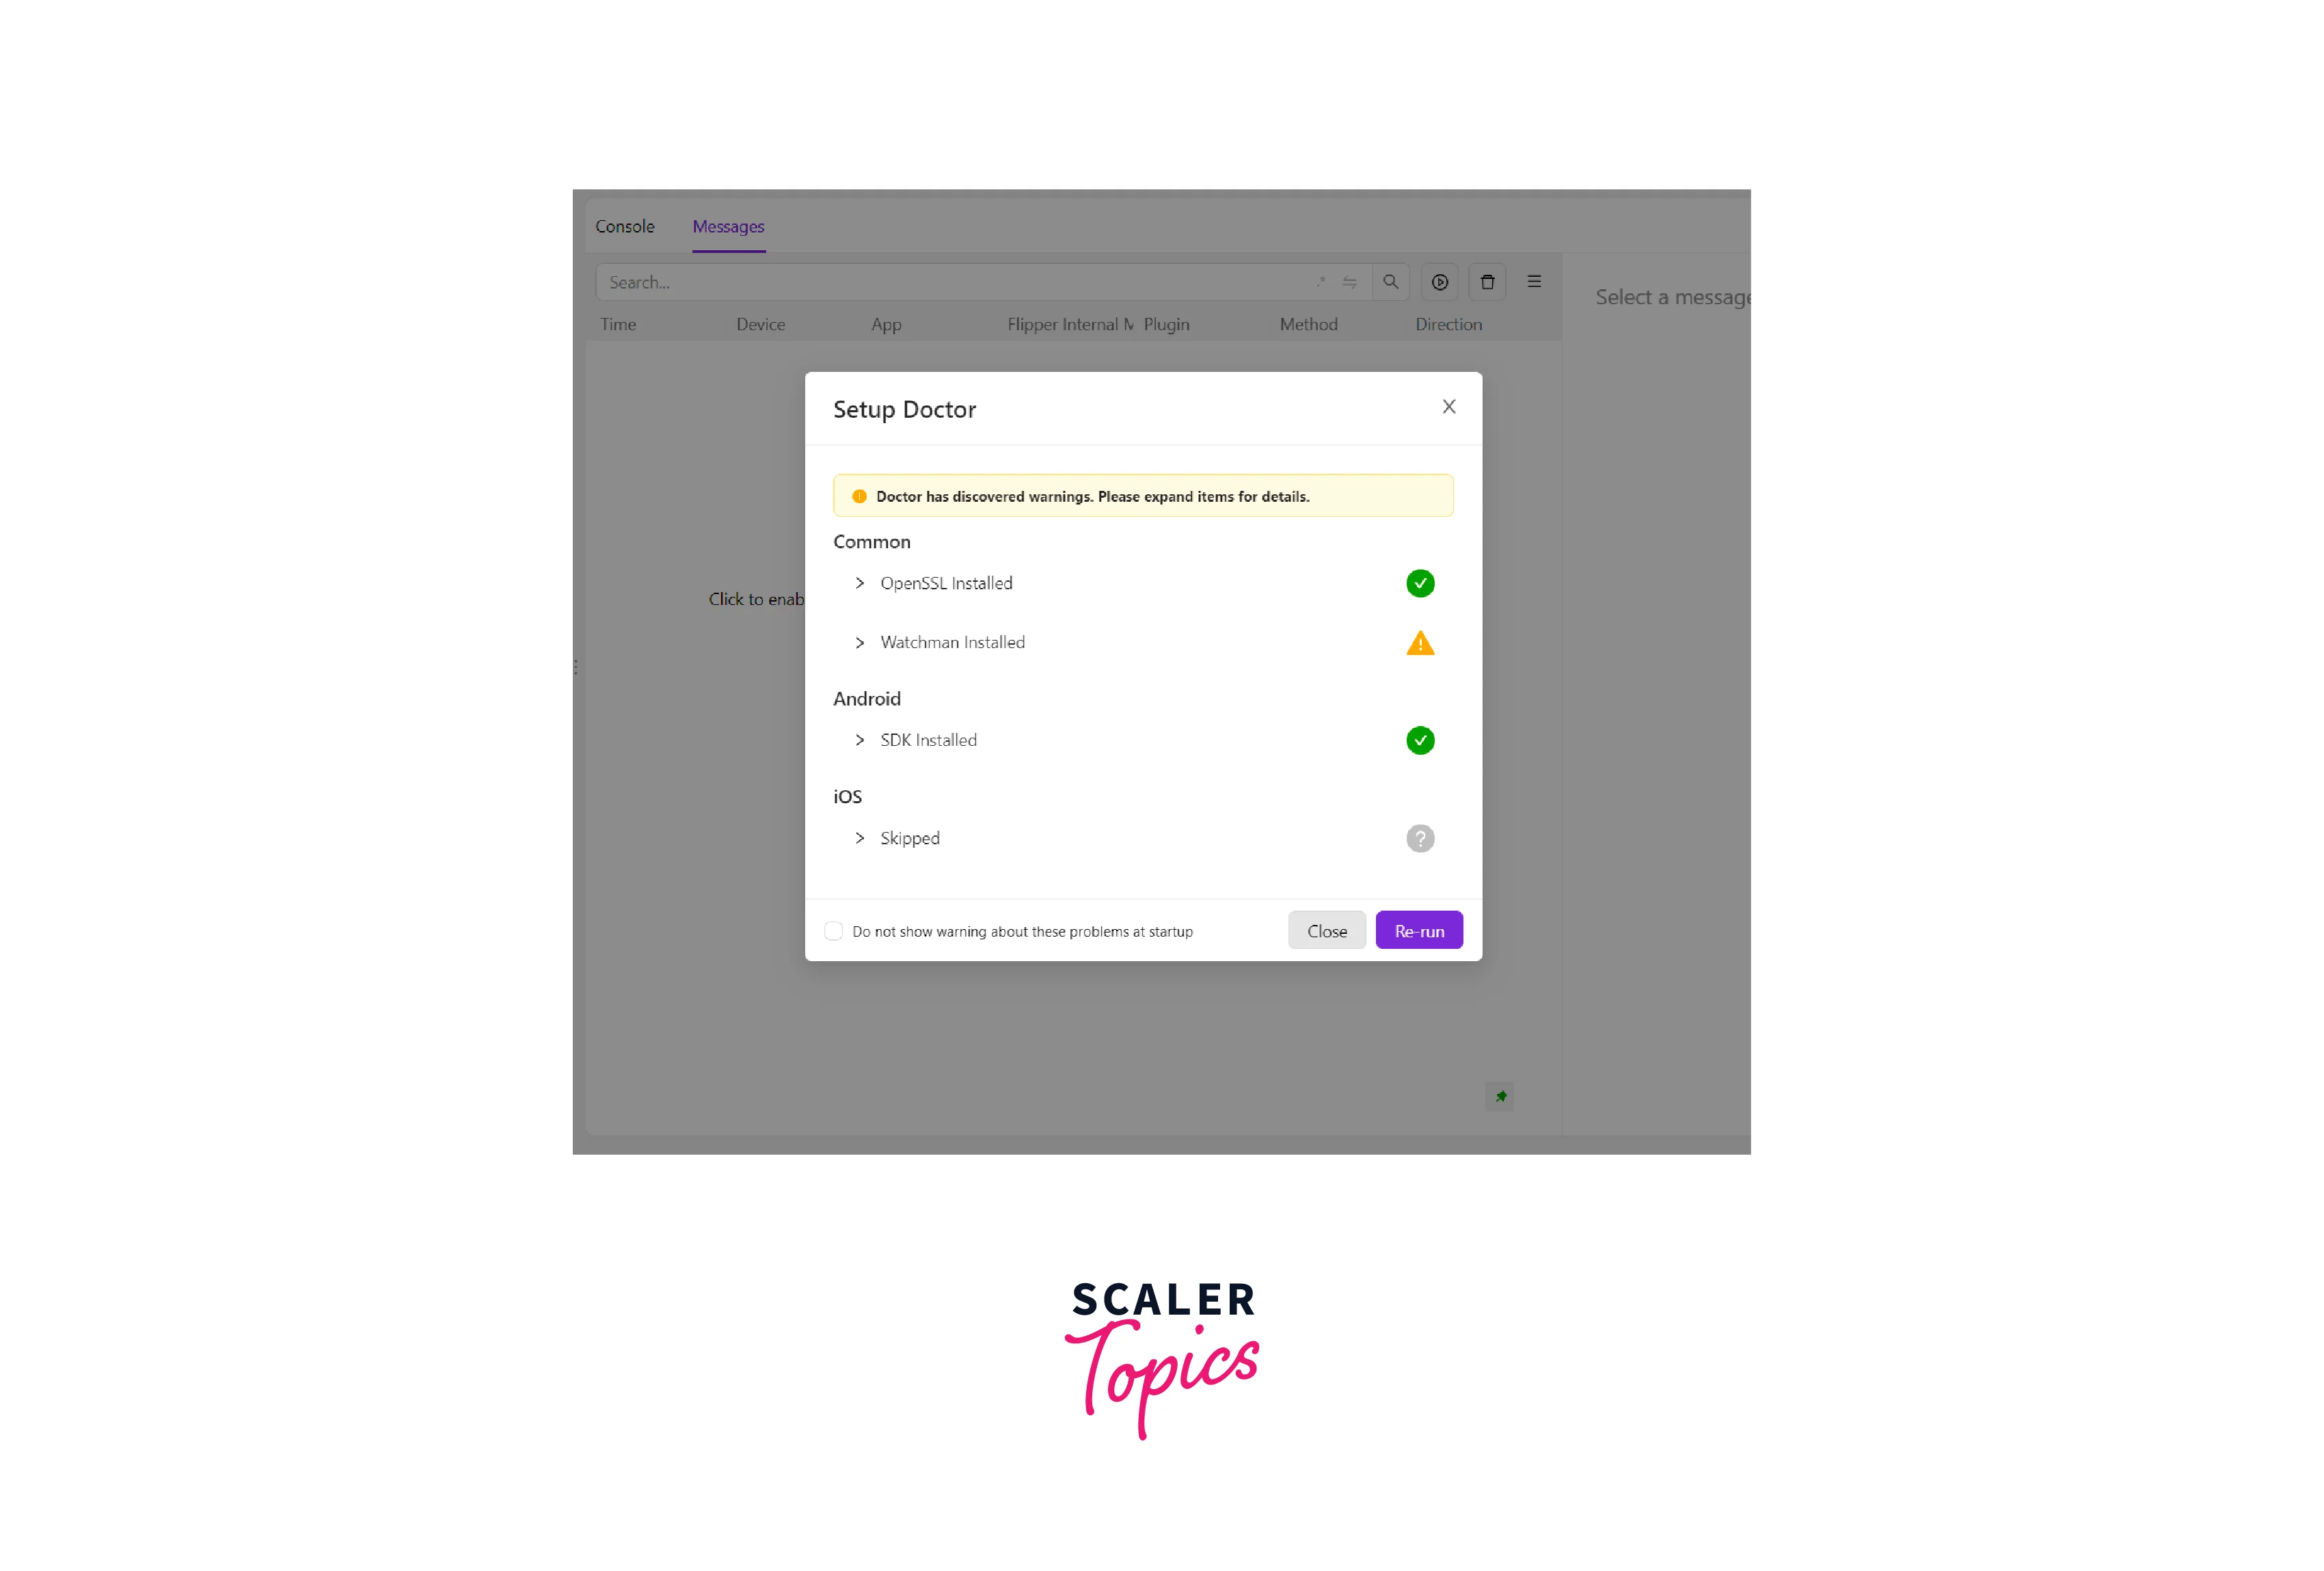
After successfully installing Flipper, access the left menu and click on the Setup Doctor button. This will verify if all the necessary dependencies are present. In case any components are missing, Flipper will provide guidance on resolving the issue.
Furthermore, it is possible to manually integrate Flipper into a React Native Android application, a React Native iOS application, or native Android and native iOS applications.
Built-in Flipper features
Flipper react native is a powerful debugging tool in React Native that offers several built-in features to streamline the debugging process and enhance developer productivity. Let's explore some of the key features of Flipper:
Easy debugging with Flipper
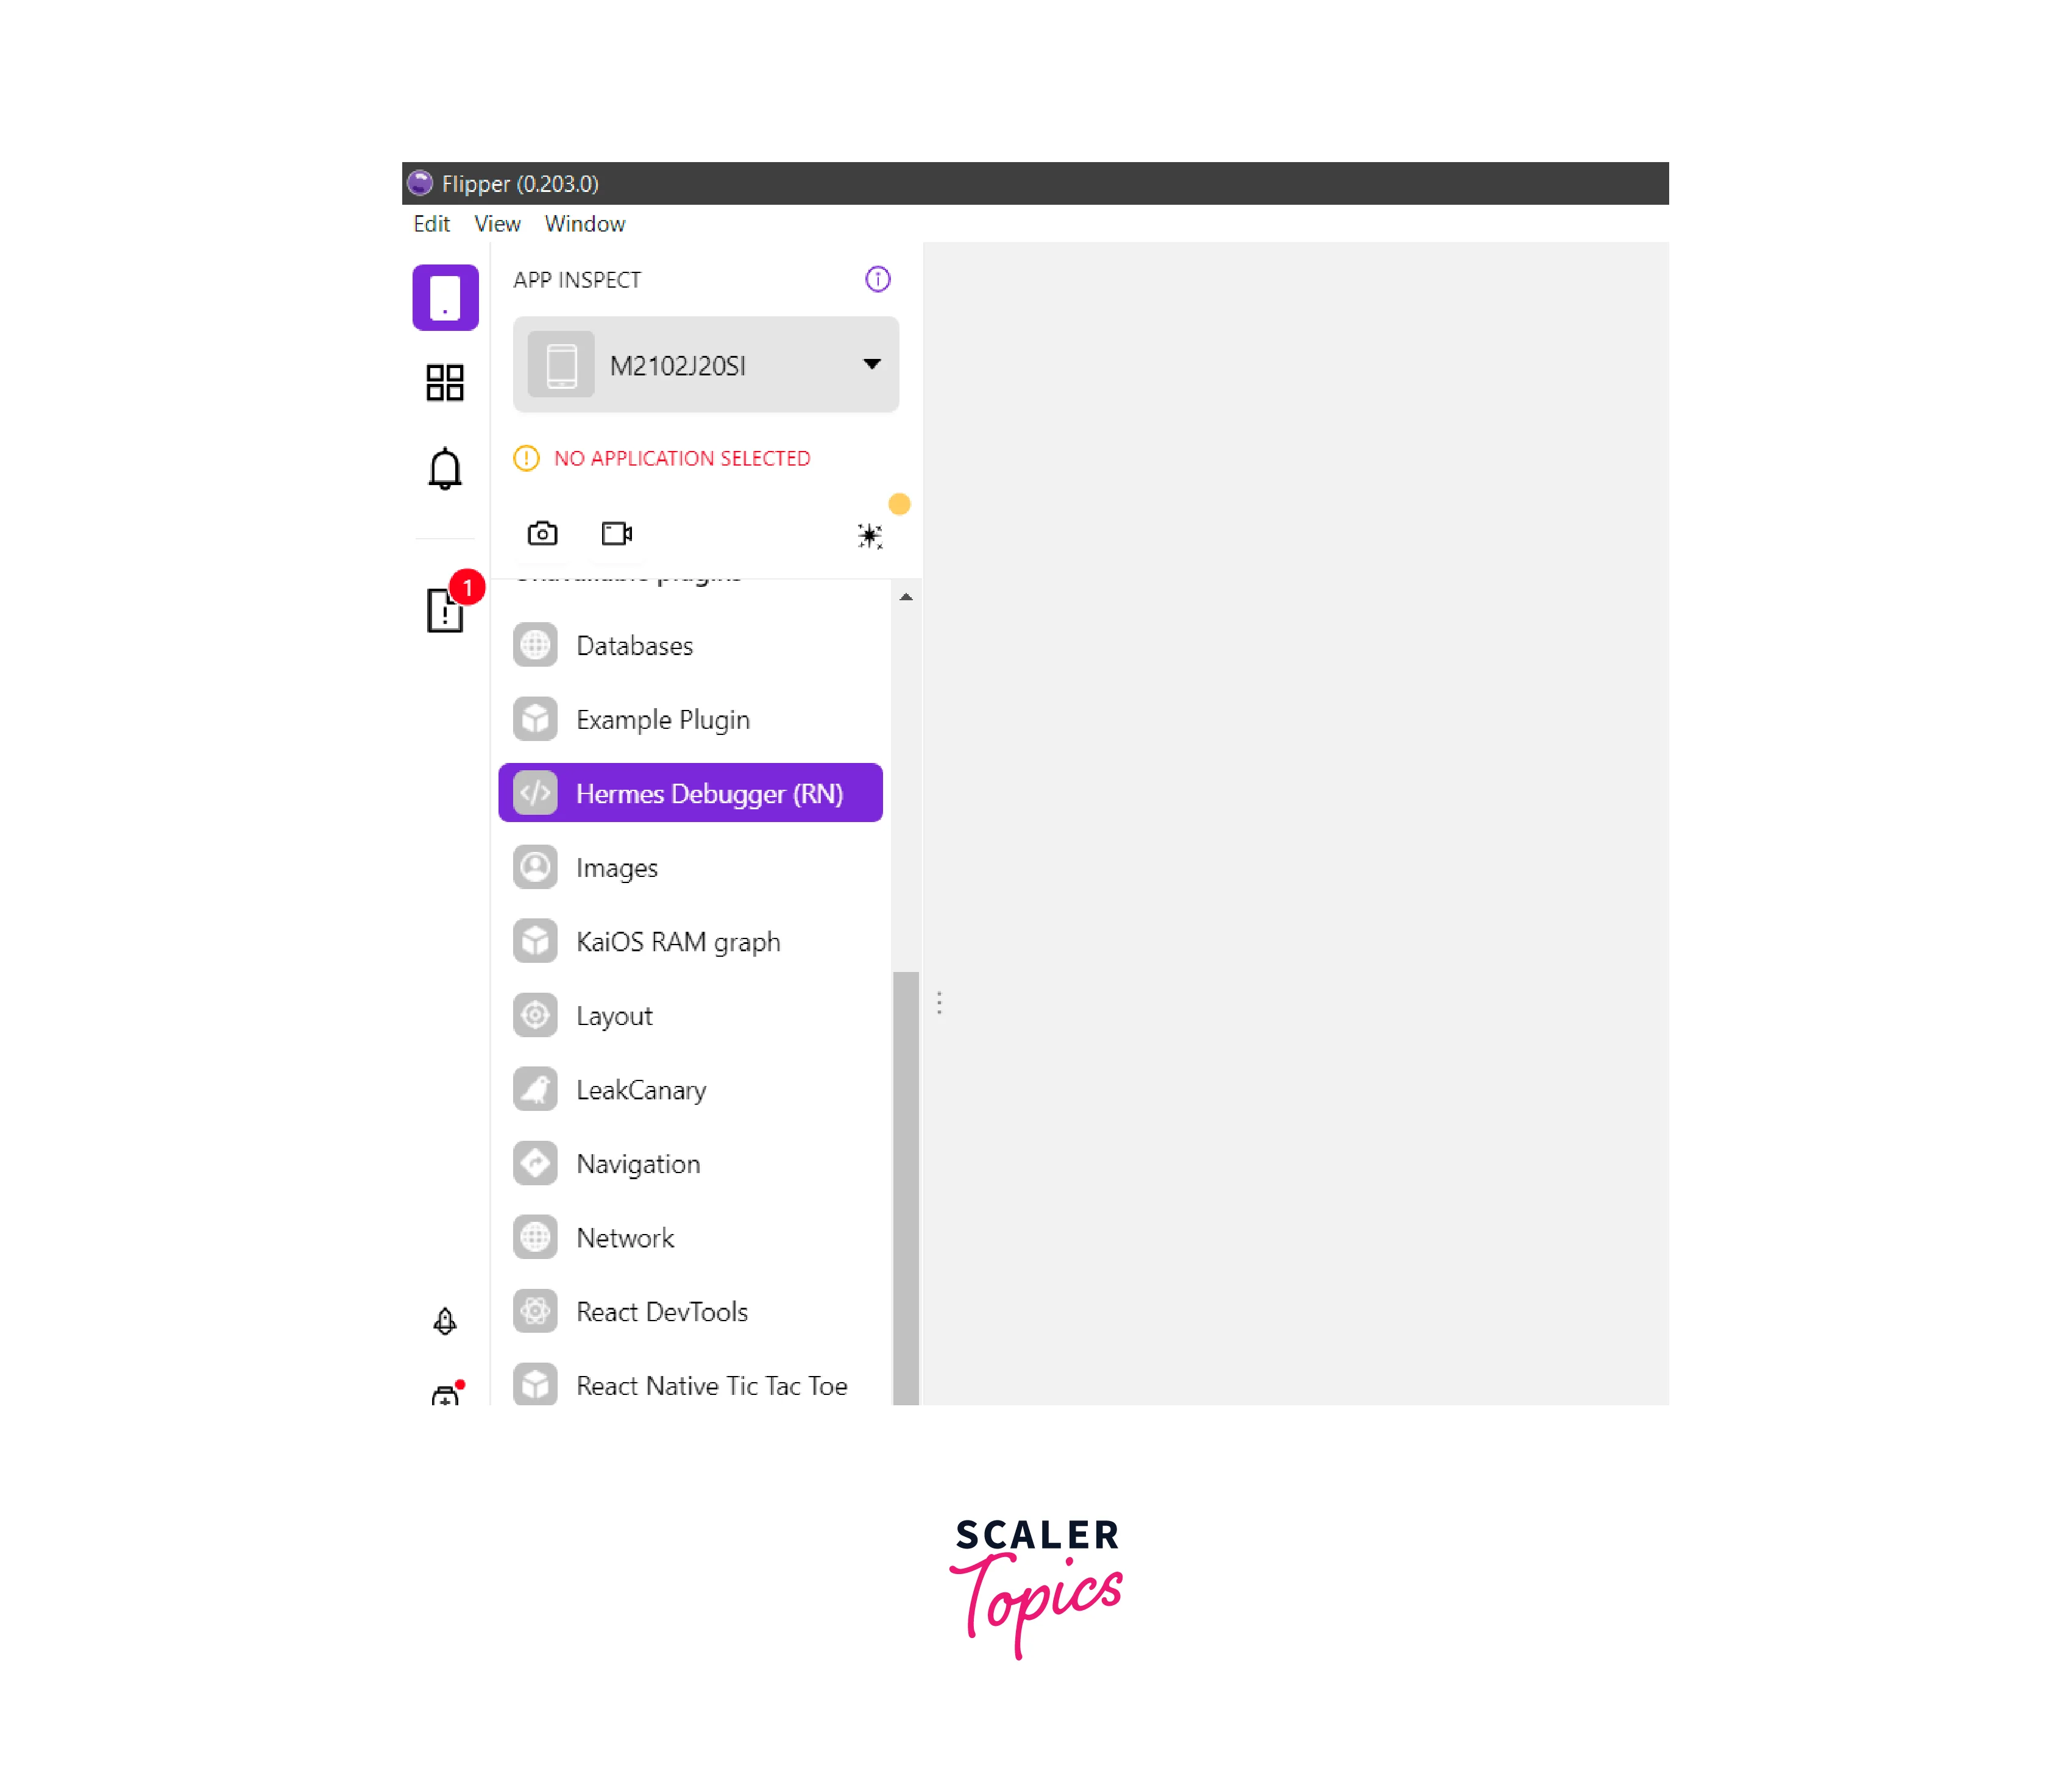
In Flipper react native, debugging is as effortless as it is in Chrome, thanks to the option of accessing the Hermes Debugger menu. If necessary, you can utilize console.log, which proves to be an effective solution in urgent situations.
Native logs
Flipper provides access to native logs, allowing developers to view and analyze logs directly within the Flipper interface. This feature helps in debugging issues specific to the native layer of the application and provides valuable insights into the app's behavior.
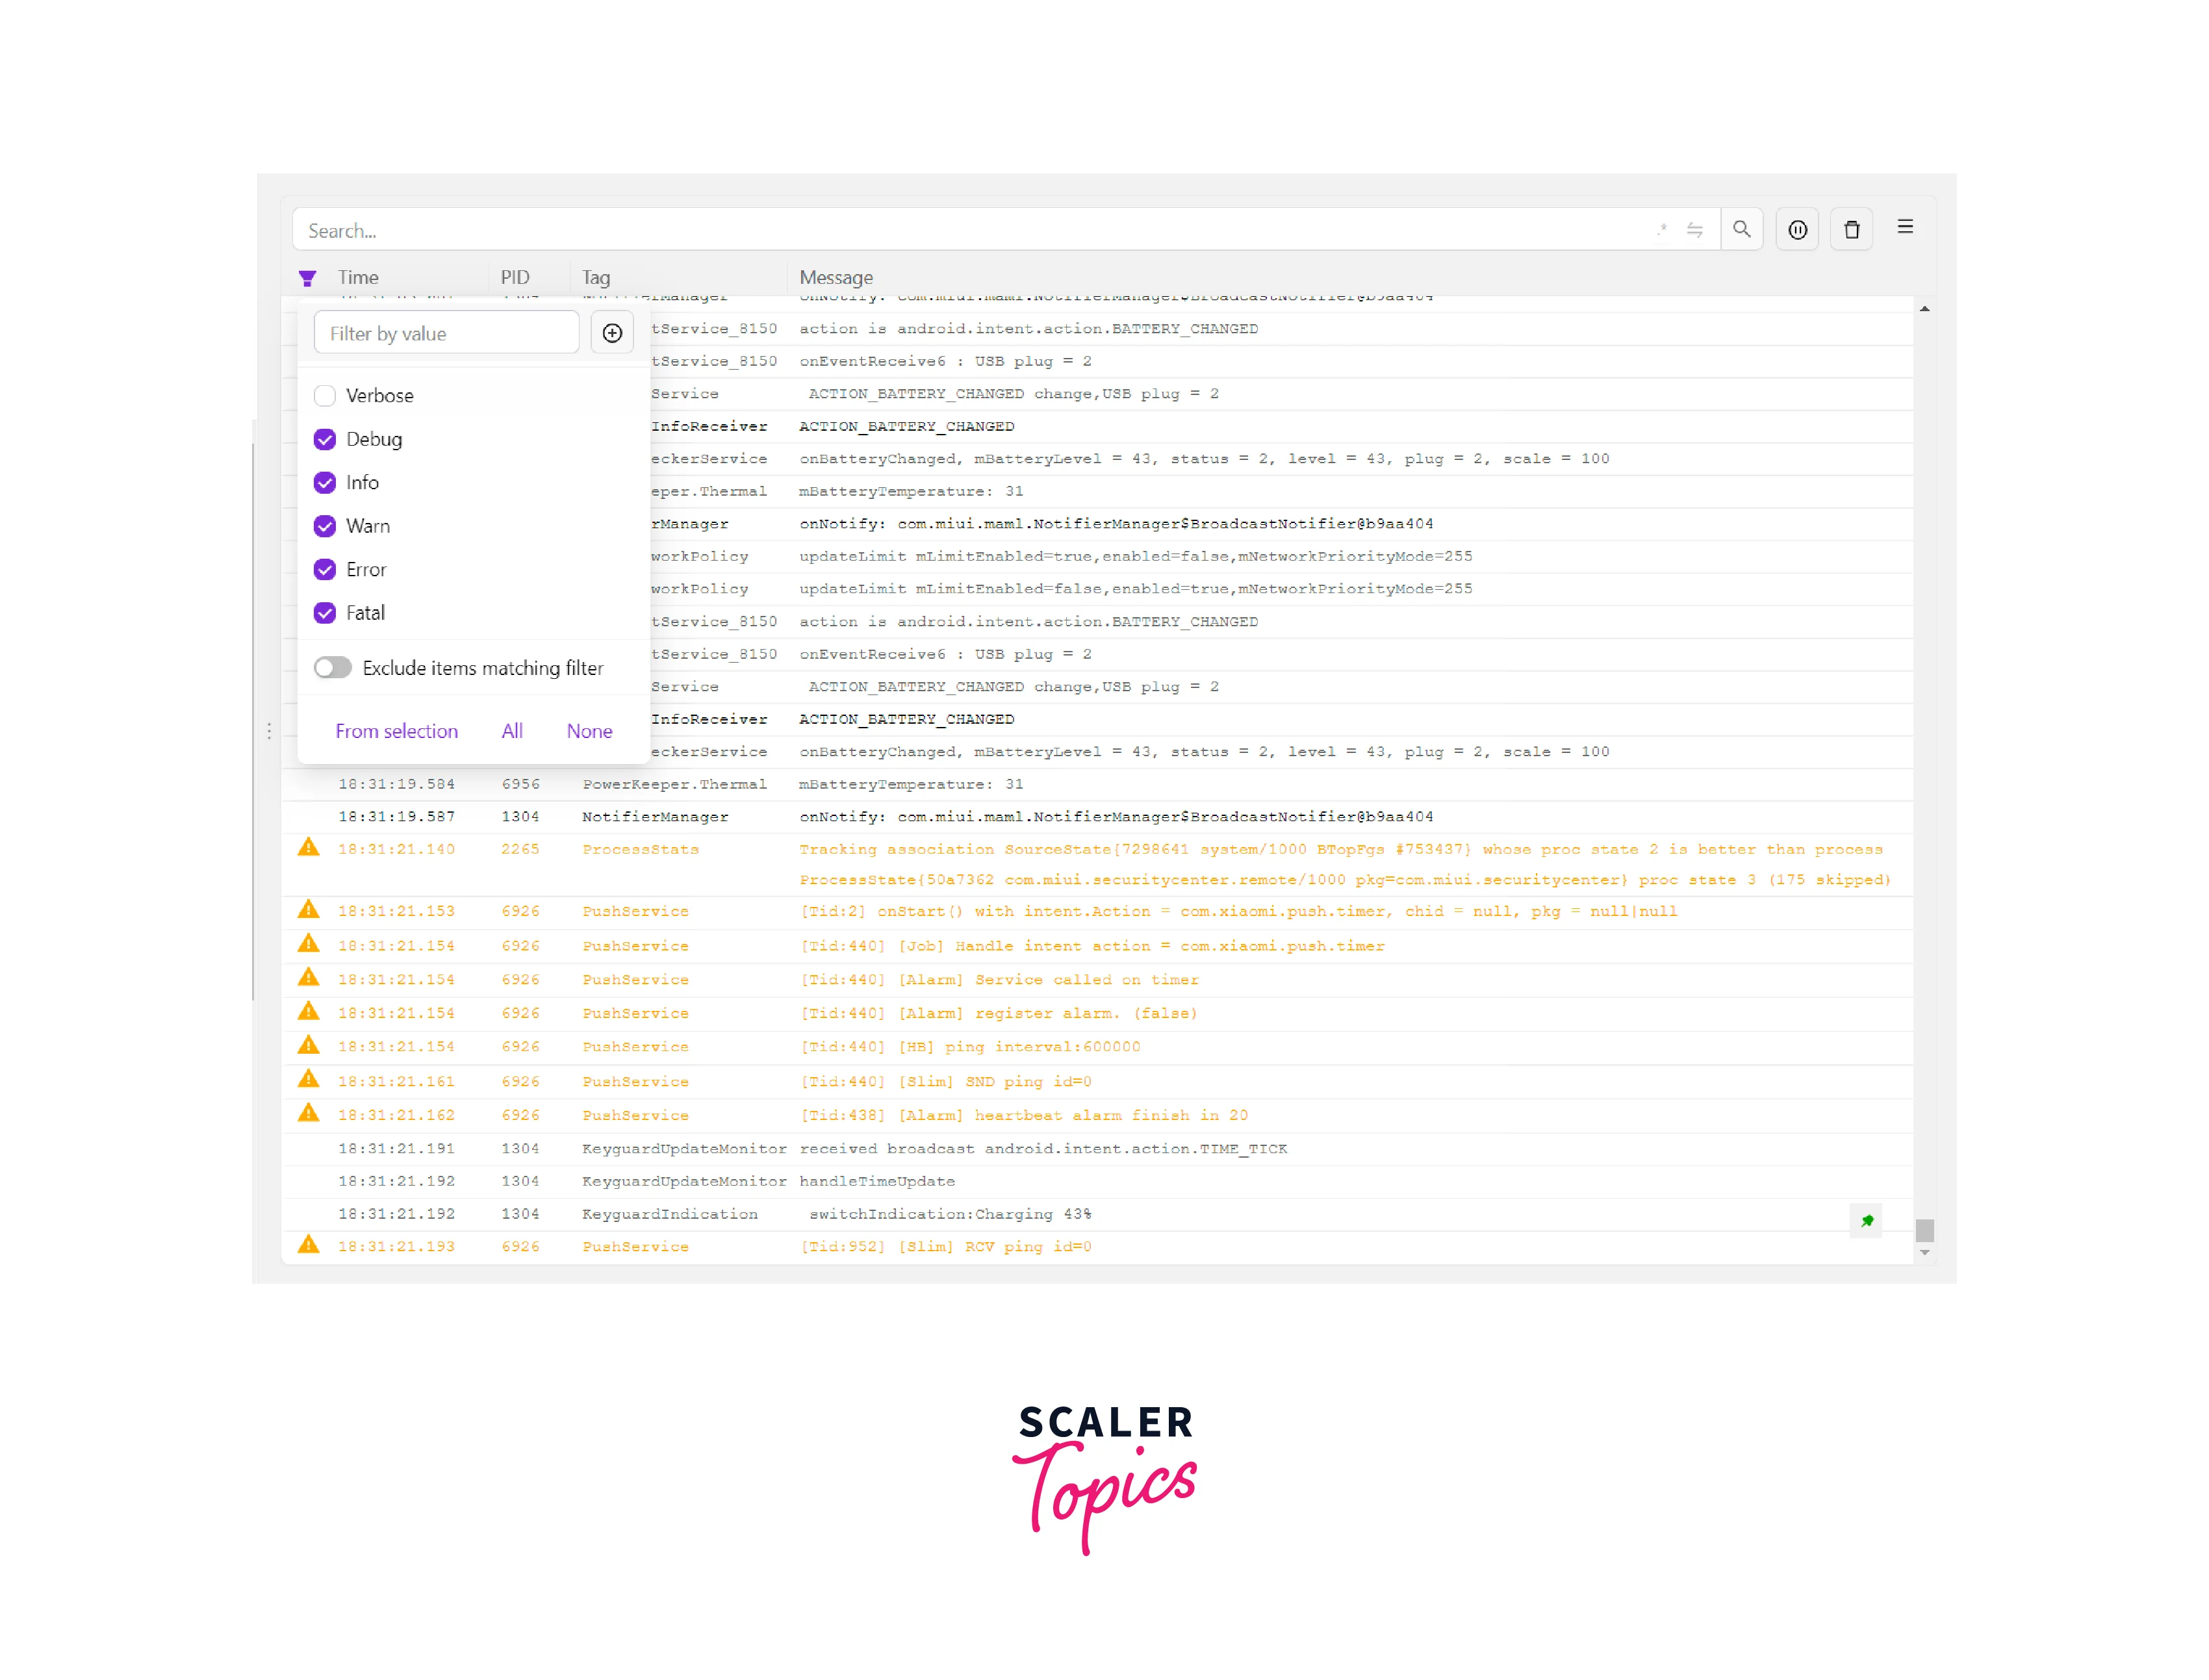
When working with React Native, it is common to encounter debugging challenges in various areas, including native components. Unfortunately, the React Native logs may not always provide sufficient assistance when the application crashes. To address this, Flipper offers access to the native logs through the Device section in the left menu.
To effectively utilize the logs, it is recommended to leverage the filter field at the top for narrowing down the results and identifying the relevant information.
Enable React DevTools with Flipper
React DevTools integration is another valuable feature of Flipper. By enabling React DevTools, developers can inspect the React component hierarchy, analyze component state and props, and track component updates. This integration facilitates a deeper understanding of the application's UI and aids in debugging React-specific issues.
Network debugging
Flipper simplifies network debugging by providing a dedicated network inspector. This feature allows developers to monitor and analyze network requests and responses made by the application. With detailed information about headers, payloads, and timing, developers can identify and resolve network-related issues efficiently.
Without modifying the project code, it is not possible to observe the app's network calls when debugging through Chrome. The network calls visible in this context are limited to those related to fetching fonts and images from the internet.
Redux debugger
For apps using Redux for state management, Flipper offers a Redux debugger plugin. This plugin enables developers to inspect the Redux store, track state changes, and debug actions dispatched within the application. It helps in diagnosing state-related problems and ensures smooth operation of the Redux workflow.
Debugging Redux often involves using console.log, which can be cumbersome since it requires logging in multiple locations to understand the issue at hand. At times like these, you may begin to question the necessity of Redux. However, by utilizing a Redux debugger that records all actions and provides a visualization of the state before and after updates, you can avoid the need to scatter console.logs throughout your application while trying to track your data.
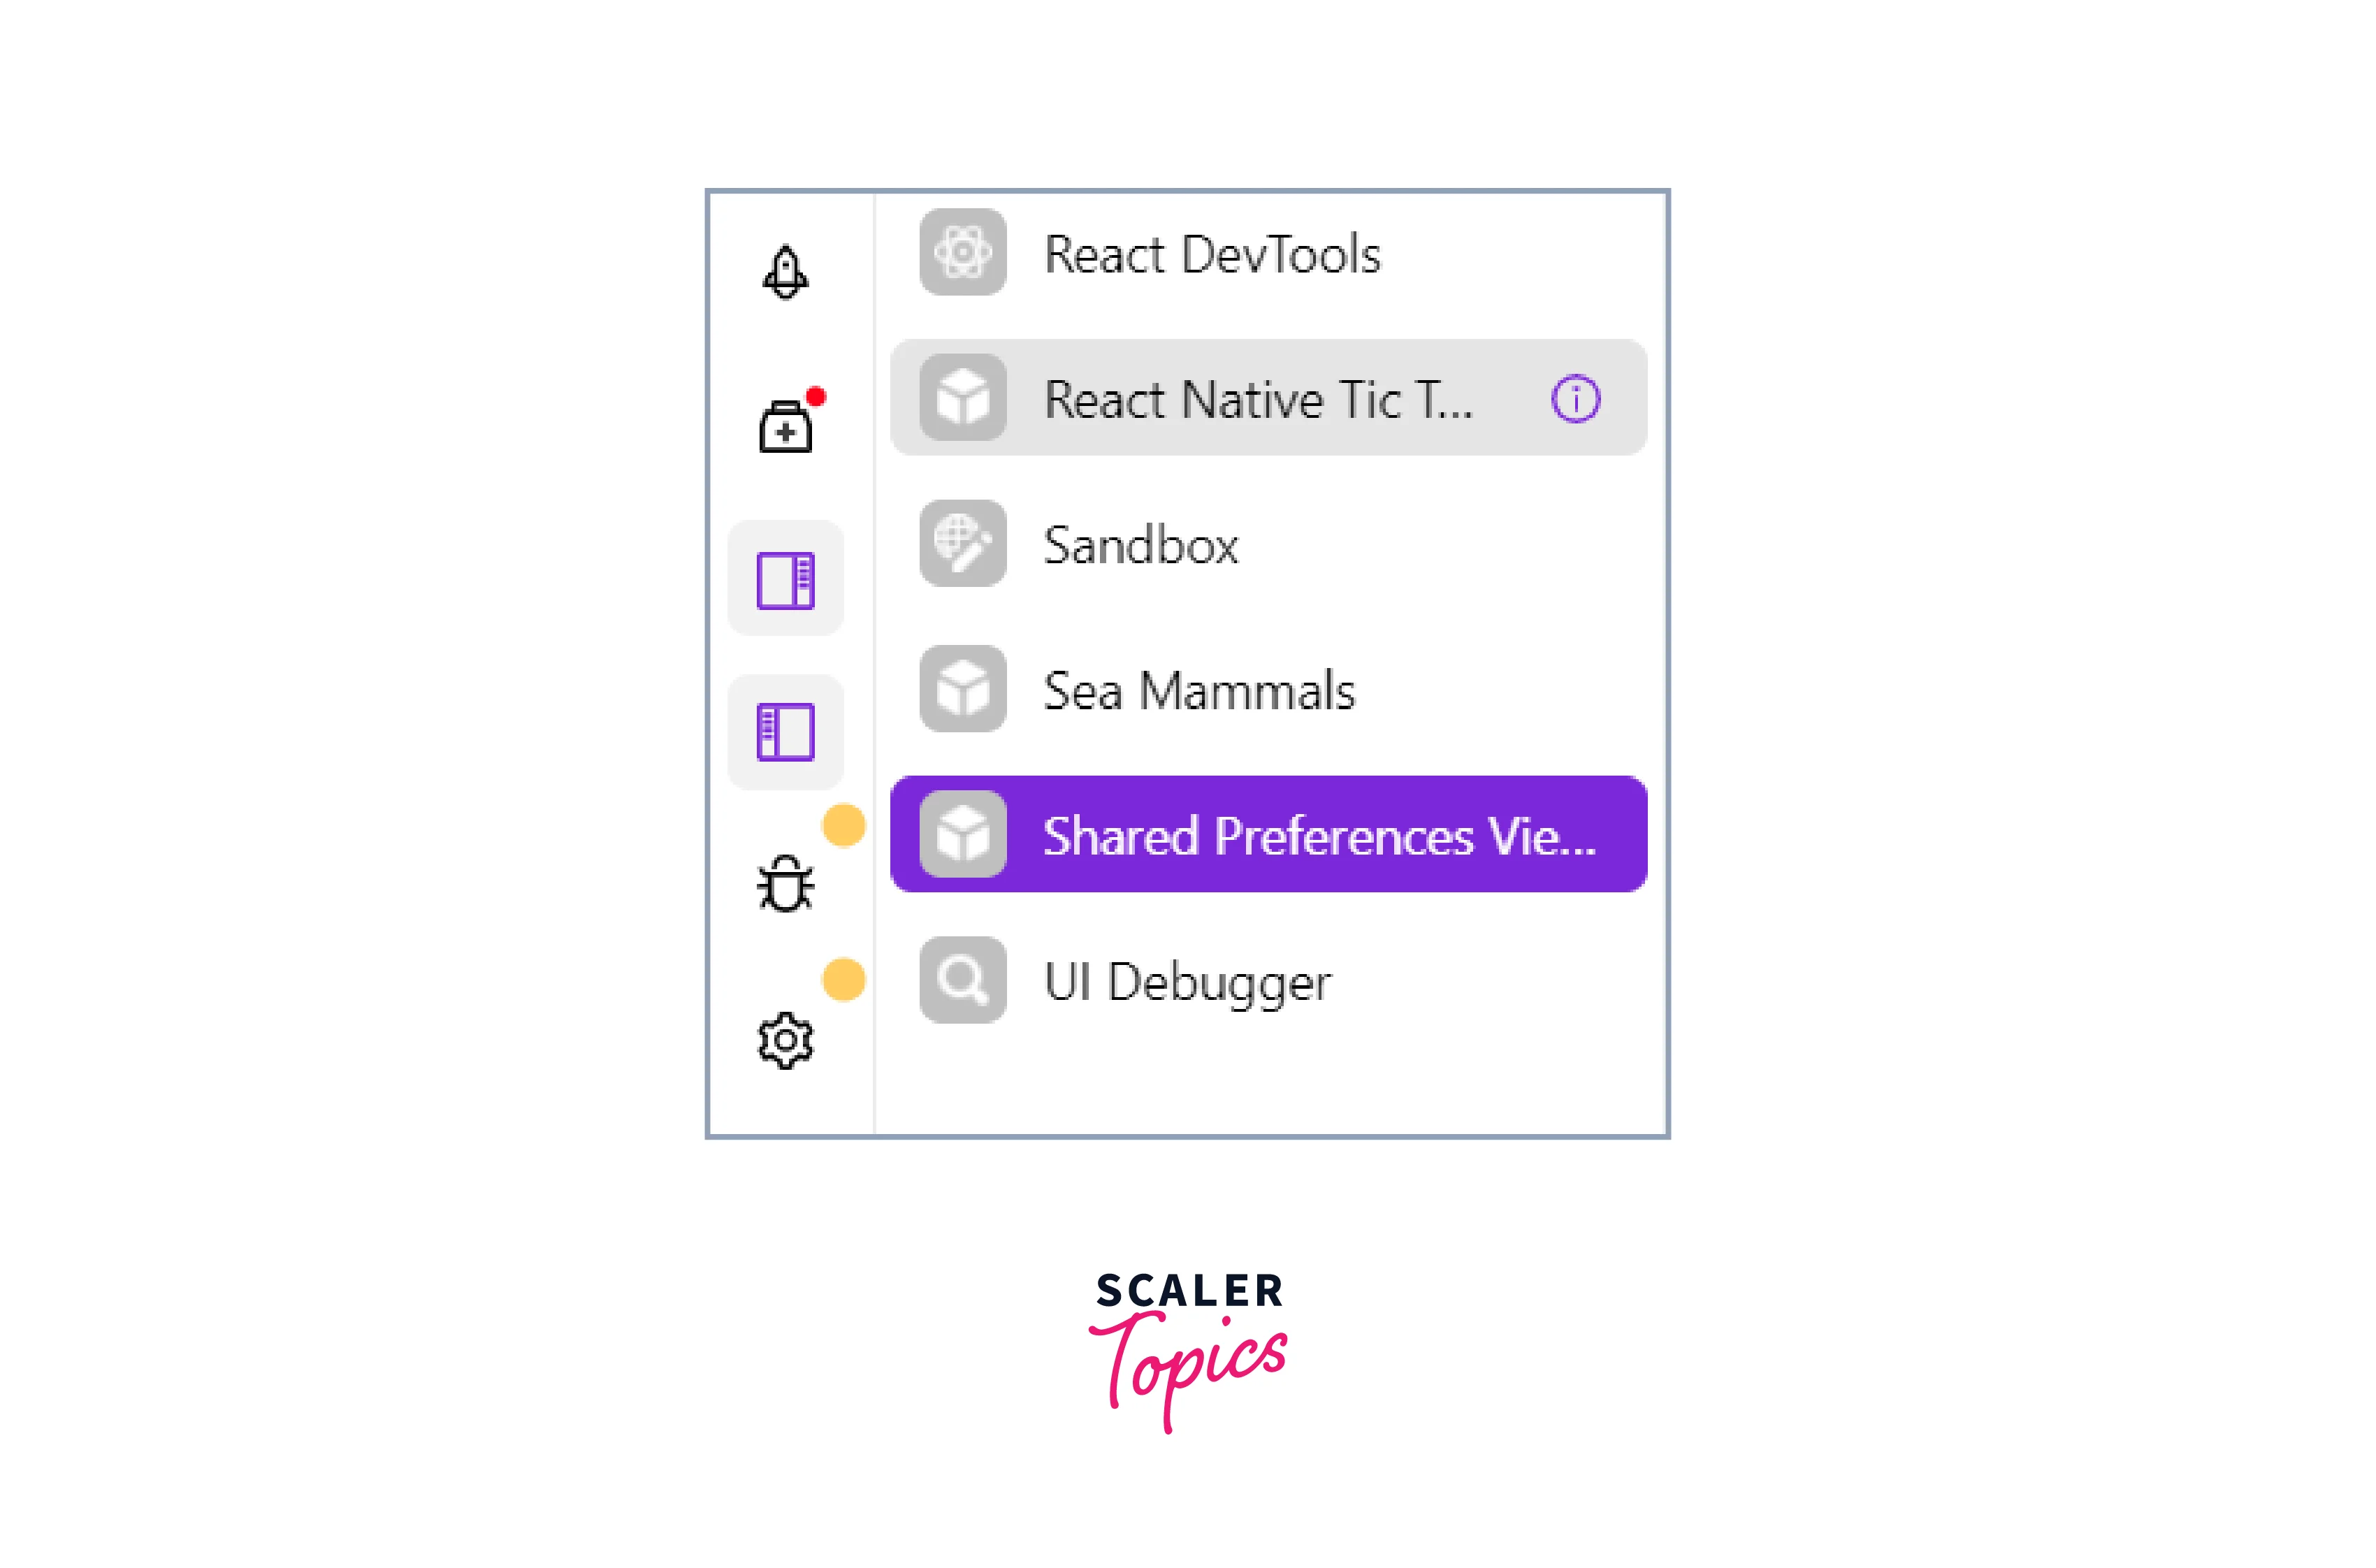
Shared preferences viewer
Flipper react native includes a shared preferences viewer, which is particularly useful for Android apps. This viewer allows developers to inspect and modify shared preferences values used in the application. It simplifies the debugging process by providing easy access to shared preferences data and facilitating quick adjustments when necessary.
Native layout inspector
Flipper offers a native layout inspector that helps developers inspect and debug the layout of native UI components. It provides a visual representation of the UI hierarchy, allowing developers to analyze and troubleshoot layout-related issues in the native layer of the app. This feature aids in creating pixel-perfect user interfaces and resolving UI-related bugs effectively.
Additional benefits to using Flipper
Through the utilization of Flipper, users gain the ability to manipulate various functionalities by accessing the buttons situated on the left sidebar and below the device selector. This versatile tool empowers users to perform the following actions:
- Refresh the application
- Capture a screenshot of the application
- Initiate an emulator/simulator
- Execute a Setup Doctor to identify any absent dependencies
- Access the development menu within the application
- Record a video of the application
Using Flipper plugins
Flipper plugins are extensions to the Flipper debugging tool in React Native that provide additional functionality and features for debugging and profiling purposes. These plugins are developed by the community and can be installed within Flipper to enhance the debugging experience. Follow the below steps to start using flipper plugins:
Configure Flipper in your React Native project: Add the necessary configuration to your React Native project to enable Flipper integration. This typically involves adding dependencies and linking native libraries. Follow the specific instructions provided by Flipper for React Native integration, as they may vary depending on the version of React Native you're using.
Explore available plugins: Visit the Flipper plugin marketplace or the official Flipper GitHub repository to explore the available plugins. Flipper has a rich ecosystem of plugins developed by the community, offering various functionalities such as network debugging, database inspection, state management, and more.
Install desired plugin: Choose the plugin you want to use and install it into your Flipper setup. To install a Flipper plugin, follow the installation instructions provided by the plugin's documentation. Usually, you will need to use a package manager like npm or yarn to install the plugin.
Configure the plugin: Once the plugin is installed, configure it according to the plugin's documentation. This may involve adding specific code snippets or configurations to your React Native project. Follow the instructions provided by the plugin author to ensure proper configuration.
Launch Flipper and enable the plugin: Launch Flipper on your development machine. You should see the plugin you installed listed in the Flipper interface. Enable the plugin from within Flipper to start using its features. The plugin's functionality should now be available for debugging and inspection within Flipper.
Utilize the plugin features: Depending on the plugin, you will have access to specific features and tools within Flipper. Refer to the plugin's documentation to understand how to leverage its functionality for debugging or profiling purposes. This may involve interacting with the Flipper interface, analyzing data, or making use of specific commands or actions provided by the plugin.
Debugging with breakpoints
Debugging with breakpoints in React Native using Flipper involves setting breakpoints in your code to pause the execution of your application at specific points and then using Flipper's debugging tools to inspect variables, step through code, and analyze the application's state. Here's a step-by-step guide on how to perform debugging with breakpoints using Flipper in React Native:
Install Flipper: Begin by installing Flipper on your development machine. You can download and install Flipper from the official Flipper website or use package managers like Homebrew for macOS or Chocolatey for Windows.
Set up your React Native project: Ensure you have a React Native project set up and running on your local machine. You can create a new project using the React Native CLI or use an existing project.
Launch Flipper: Open Flipper on your development machine. The Flipper interface will appear, showing the device connection panel.
Connect your device: Connect your physical device or launch the emulator/simulator and make sure it is running and visible in Flipper's device connection panel. Ensure that you have enabled debugging on the device or emulator.
Open the desired file: In your React Native project, open the file where you want to set breakpoints for debugging. This could be a JavaScript file containing your application logic or a component file.
Set breakpoints: Identify the specific lines of code where you want to set breakpoints. Add the debugger; statement at those locations. This statement acts as a breakpoint and will pause the execution of your application when reached.
Launch your React Native app: Start your React Native app on the connected device or emulator using the appropriate command for your platform (react-native run-android or react-native run-ios).
Trigger the breakpoints: Interact with your app in a way that triggers the code execution leading to the breakpoints you set. For example, if you set a breakpoint in a button's onPress handler, tap the button to trigger the breakpoint.
Pause and inspect in Flipper: When a breakpoint is hit, Flipper will pause the execution of your app. You can switch to the Flipper interface and use its debugging tools to inspect the current state of your application. This includes inspecting variables, analyzing the component hierarchy, and viewing network requests.
Step through code: With Flipper, you can step through your code line by line, observing the changes in variables and monitoring their values as you progress through the execution. Utilize the step over, step into, and step out options in Flipper to navigate through the code.
Resume execution: After inspecting the current state and variables, you can resume the execution of your app by clicking the play button in Flipper. The app will continue running until the next breakpoint or completion of the code.
Remember to remove the debugger; statements once you have finished debugging to avoid unnecessary pauses in the app's execution.
Conclusion
- Flipper is a powerful debugging tool for React Native applications.
- It provides a visual interface to inspect, debug, and profile React Native apps.
- The tool offers various features such as native logs, React DevTools integration, network debugging, Redux debugger, shared preferences viewer, and native layout inspector.
- Flipper simplifies the debugging process and enhances developer productivity.
- It allows for efficient collaboration among team members by facilitating easy sharing of debugging sessions.
- Flipper's plugin ecosystem further extends its functionality to cater to specific debugging needs.
- Using Flipper, developers can optimize performance, diagnose and fix bugs, and improve the stability and reliability of their React Native apps.
- It is compatible with both iOS and Android platforms, providing a consistent debugging experience. Flipper benefits from an active community and receives regular updates and improvements.