Sales Forecasting Using Excel
Overview
Sales forecasting in Excel is a valuable tool that helps businesses predict future sales volumes, revenue, and trends based on historical data and other relevant factors. It allows organizations to make informed decisions, plan resources, and set realistic targets. Excel provides a versatile platform for performing sales forecasting calculations, data analysis, and visualizations. By leveraging various built-in functions, such as trend analysis, regression analysis, moving averages, and exponential smoothing.
What are We Building?
In the Sales Forecasting project in Excel, we are developing a comprehensive tool that utilizes data analysis and forecasting techniques to predict future sales performance. Our objective is to create a reliable model that accurately predicts sales based on historical data and other relevant factors. The tool features an easy-to-use interface where users can import their sales data from various sources and generate accurate forecasts quickly.
The project begins with data import functionality, allowing users to bring in their historical sales data from spreadsheets or databases. We then implement data cleaning and preprocessing techniques to ensure the accuracy and consistency of the dataset. This involves handling missing values, removing outliers, and transforming the data into a suitable format for analysis.
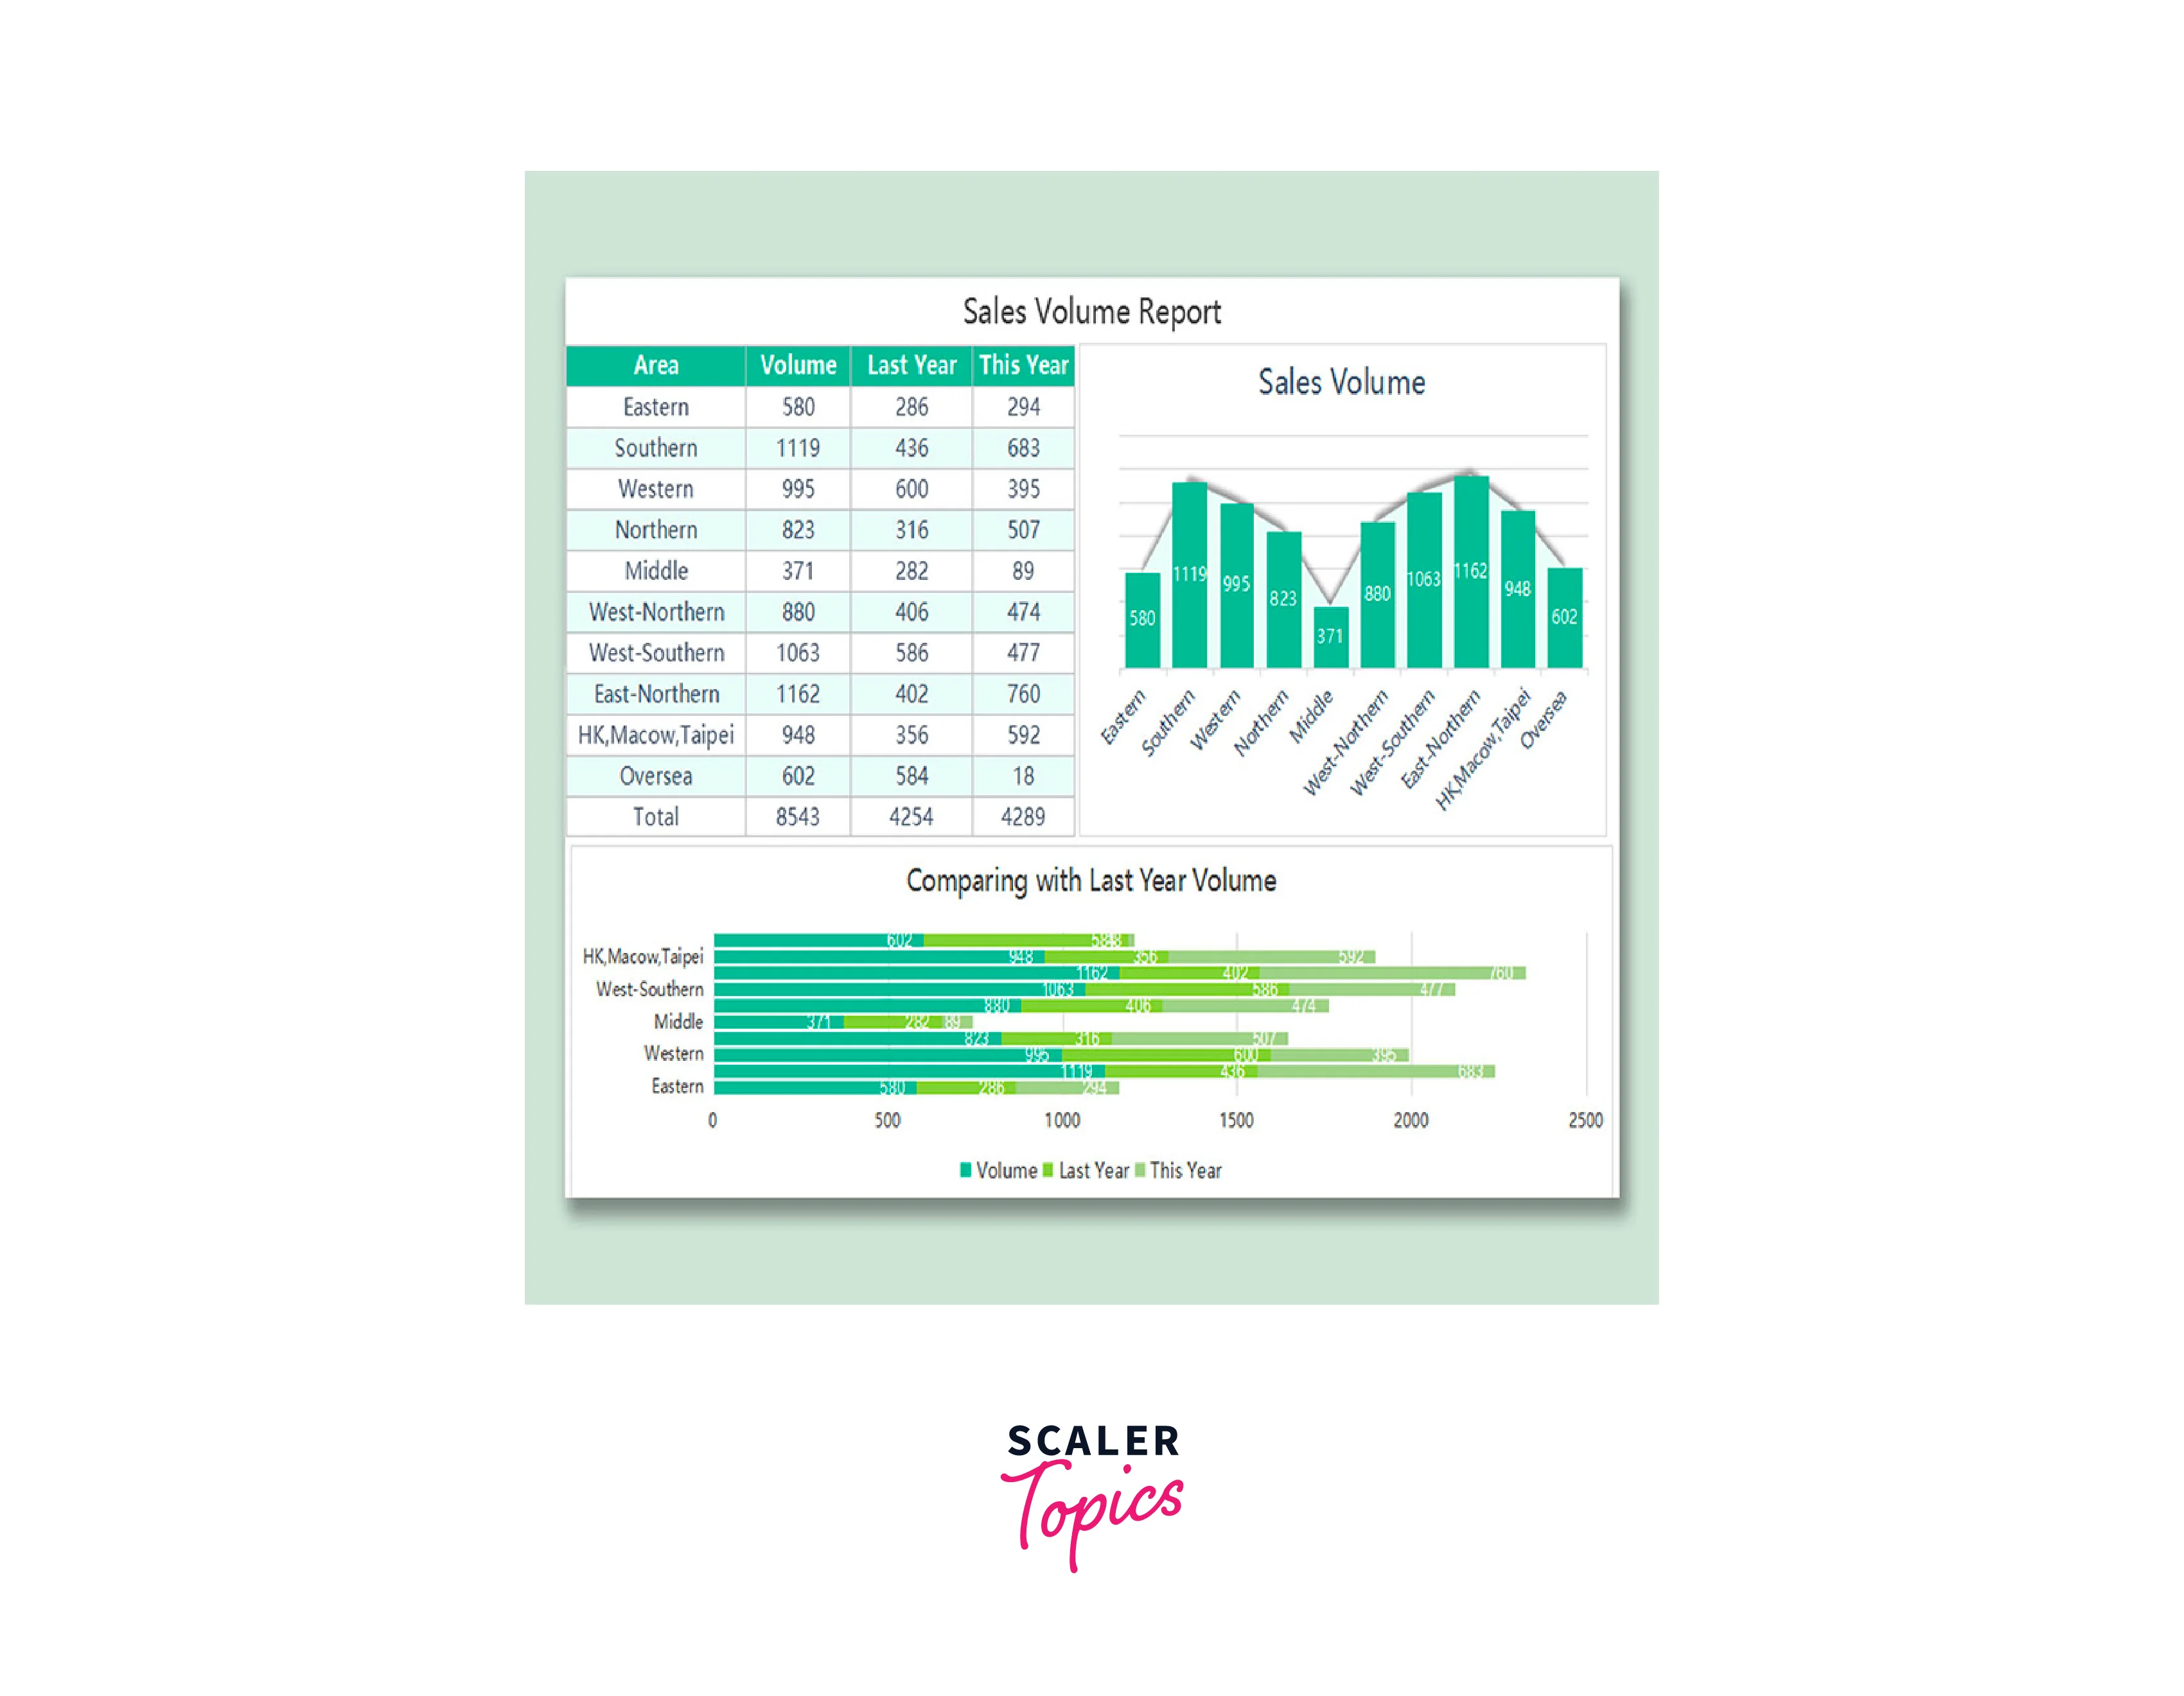
Once the data is prepared, we conduct exploratory data analysis (EDA) to gain insights into the sales data. Through visualizations, charts, and statistical measures, we identify trends, patterns, and seasonality within the dataset. This analysis provides a foundation for building forecasting models.
Pre-requisites
Building the Sales Forecasting project in Excel requires several prerequisites to ensure a successful implementation. These prerequisites encompass both technical and conceptual aspects that lay the groundwork for developing an effective forecasting tool. Here are the key prerequisites:
-
Understanding of Sales Processes:
A thorough understanding of the sales processes within the target industry or organization is essential. This includes knowledge of sales cycles, customer behavior, market trends, and factors that influence sales performance. Such insights help in identifying the relevant variables and factors to consider during the forecasting process.
-
Proficiency in Excel:
Excel is the primary tool for building the Sales Forecasting project. Therefore, a strong proficiency in Excel is crucial. This includes knowledge of functions, formulas, data manipulation techniques, pivot tables, and charting capabilities. Familiarity with advanced features like data analysis tools, solver, and scenario manager can also be beneficial.
-
Access to Historical Sales Data:
Availability of reliable historical sales data is essential for training and validating the forecasting models. The data should include relevant information such as sales figures, dates, product or service categories, customer segments, and any other variables that influence sales. Access to a sufficiently long and representative historical dataset is crucial for accurate forecasting.
-
Data Cleaning and Preprocessing Skills:
Data cleaning and preprocessing are critical steps before implementing forecasting models. This requires skills in handling missing data, outlier detection and treatment, data transformation, and ensuring data consistency. Proficiency in Excel's data cleaning functions and techniques like filtering, sorting, and conditional formatting is necessary.
-
Statistical and Forecasting Knowledge:
A solid understanding of statistical concepts and forecasting techniques is essential. This includes knowledge of time series analysis, regression analysis, moving averages, exponential smoothing methods, and model evaluation metrics. Familiarity with statistical software packages or Excel add-ins that support advanced forecasting techniques can also be advantageous.
How are We Going to Build This?
To build the Sales Forecasting project in Excel, we will follow a systematic approach, combining technical implementation steps with data analysis and model development. Here are the key points outlining the process:
-
Define Project Scope:
Clearly define the scope of the project, including the specific objectives, target audience, and desired outcomes. This ensures a focused approach throughout the development process.
-
Gather Requirements:
Collect requirements from stakeholders, including the necessary features, functionalities, and data inputs required for accurate sales forecasting. Consider factors such as historical sales data, data granularity, forecast horizon, and any additional variables that may impact sales.
-
Data Collection and Preparation:
Collect the historical sales data from reliable sources and import it into Excel. Clean the data by handling missing values, removing outliers, and ensuring data consistency. Transform the data into a format suitable for analysis and forecasting.
-
Exploratory Data Analysis (EDA):
Conduct EDA to gain insights into the sales data. Visualize the data using charts, graphs, and statistical measures to identify patterns, trends, seasonality, and other significant factors that may impact sales performance.
-
Model Selection:
Based on the EDA insights and requirements, select appropriate forecasting models. Consider options such as time series models (ARIMA, exponential smoothing), regression models, or a combination thereof. Choose the models that best fit the data and align with the project objectives.
-
Model Development and Training:
Develop the selected forecasting models using Excel's formulas, functions, and available statistical tools. Train the models using the prepared historical sales data, adjusting parameters and fine-tuning as necessary to optimize model performance.
Final Output
Sales forecasting is a crucial aspect of business planning and decision-making. Utilizing Microsoft Excel for sales forecasting offers a powerful and accessible solution. With Excel's versatile data analysis tools, businesses can analyze historical sales data, identify trends, and make informed predictions about future sales performance. By creating accurate sales forecasts, organizations can optimize inventory management, allocate resources effectively, and plan marketing strategies to meet customer demands. Excel's user-friendly interface allows users to visualize forecasted sales data through charts and graphs, enabling quick comprehension and communication of insights to stakeholders. Sales forecasting in Excel provides a valuable tool for driving growth and success in today's competitive business landscape.
Requirements
In the Sales Forecasting project in Excel, several requirements need to be considered to ensure accurate and effective forecasting. These requirements encompass both technical and functional aspects of the tool. Here are the key requirements for Sales Forecasting in Excel:
-
Historical Sales Data:
Access to reliable and comprehensive historical sales data is crucial. The tool should be able to import and handle large volumes of historical sales data, including relevant variables such as dates, product categories, customer segments, and sales figures.
-
Data Cleaning and Preprocessing:
The tool should provide functionality to clean and preprocess the data. It should handle missing values, remove outliers, and ensure data consistency to improve the accuracy of the forecasting models.
-
Forecasting Models:
The tool should support various forecasting models, such as time series models (e.g., ARIMA, exponential smoothing) and regression-based models. It should enable the selection and customization of appropriate models based on the specific requirements of the business.
-
Model Training and Evaluation:
The tool should allow for model training using the historical sales data and provide mechanisms for evaluating the performance of the trained models. It should calculate relevant accuracy metrics (e.g., MAE, RMSE) to assess the effectiveness of the forecasts.
-
Scenario Analysis:
The tool should enable scenario analysis capabilities, allowing users to simulate the impact of different factors on sales forecasts. It should provide the flexibility to adjust variables such as pricing, marketing campaigns, or market conditions to evaluate their influence on sales performance.
-
Forecast Visualization:
The tool should generate visual representations of the forecasted sales data. It should offer various charting options and graphical displays to present the forecasts in an easily understandable format, aiding decision-making processes.
-
Customization and Flexibility:
The tool should be customizable to accommodate specific business requirements. It should allow users to define and incorporate additional variables, business rules, or forecasting techniques based on their unique needs.
-
User-Friendly Interface:
The tool should have an intuitive and user-friendly interface to facilitate data input, model selection, and scenario analysis. It should be easy to navigate and understand, even for users with limited technical expertise.
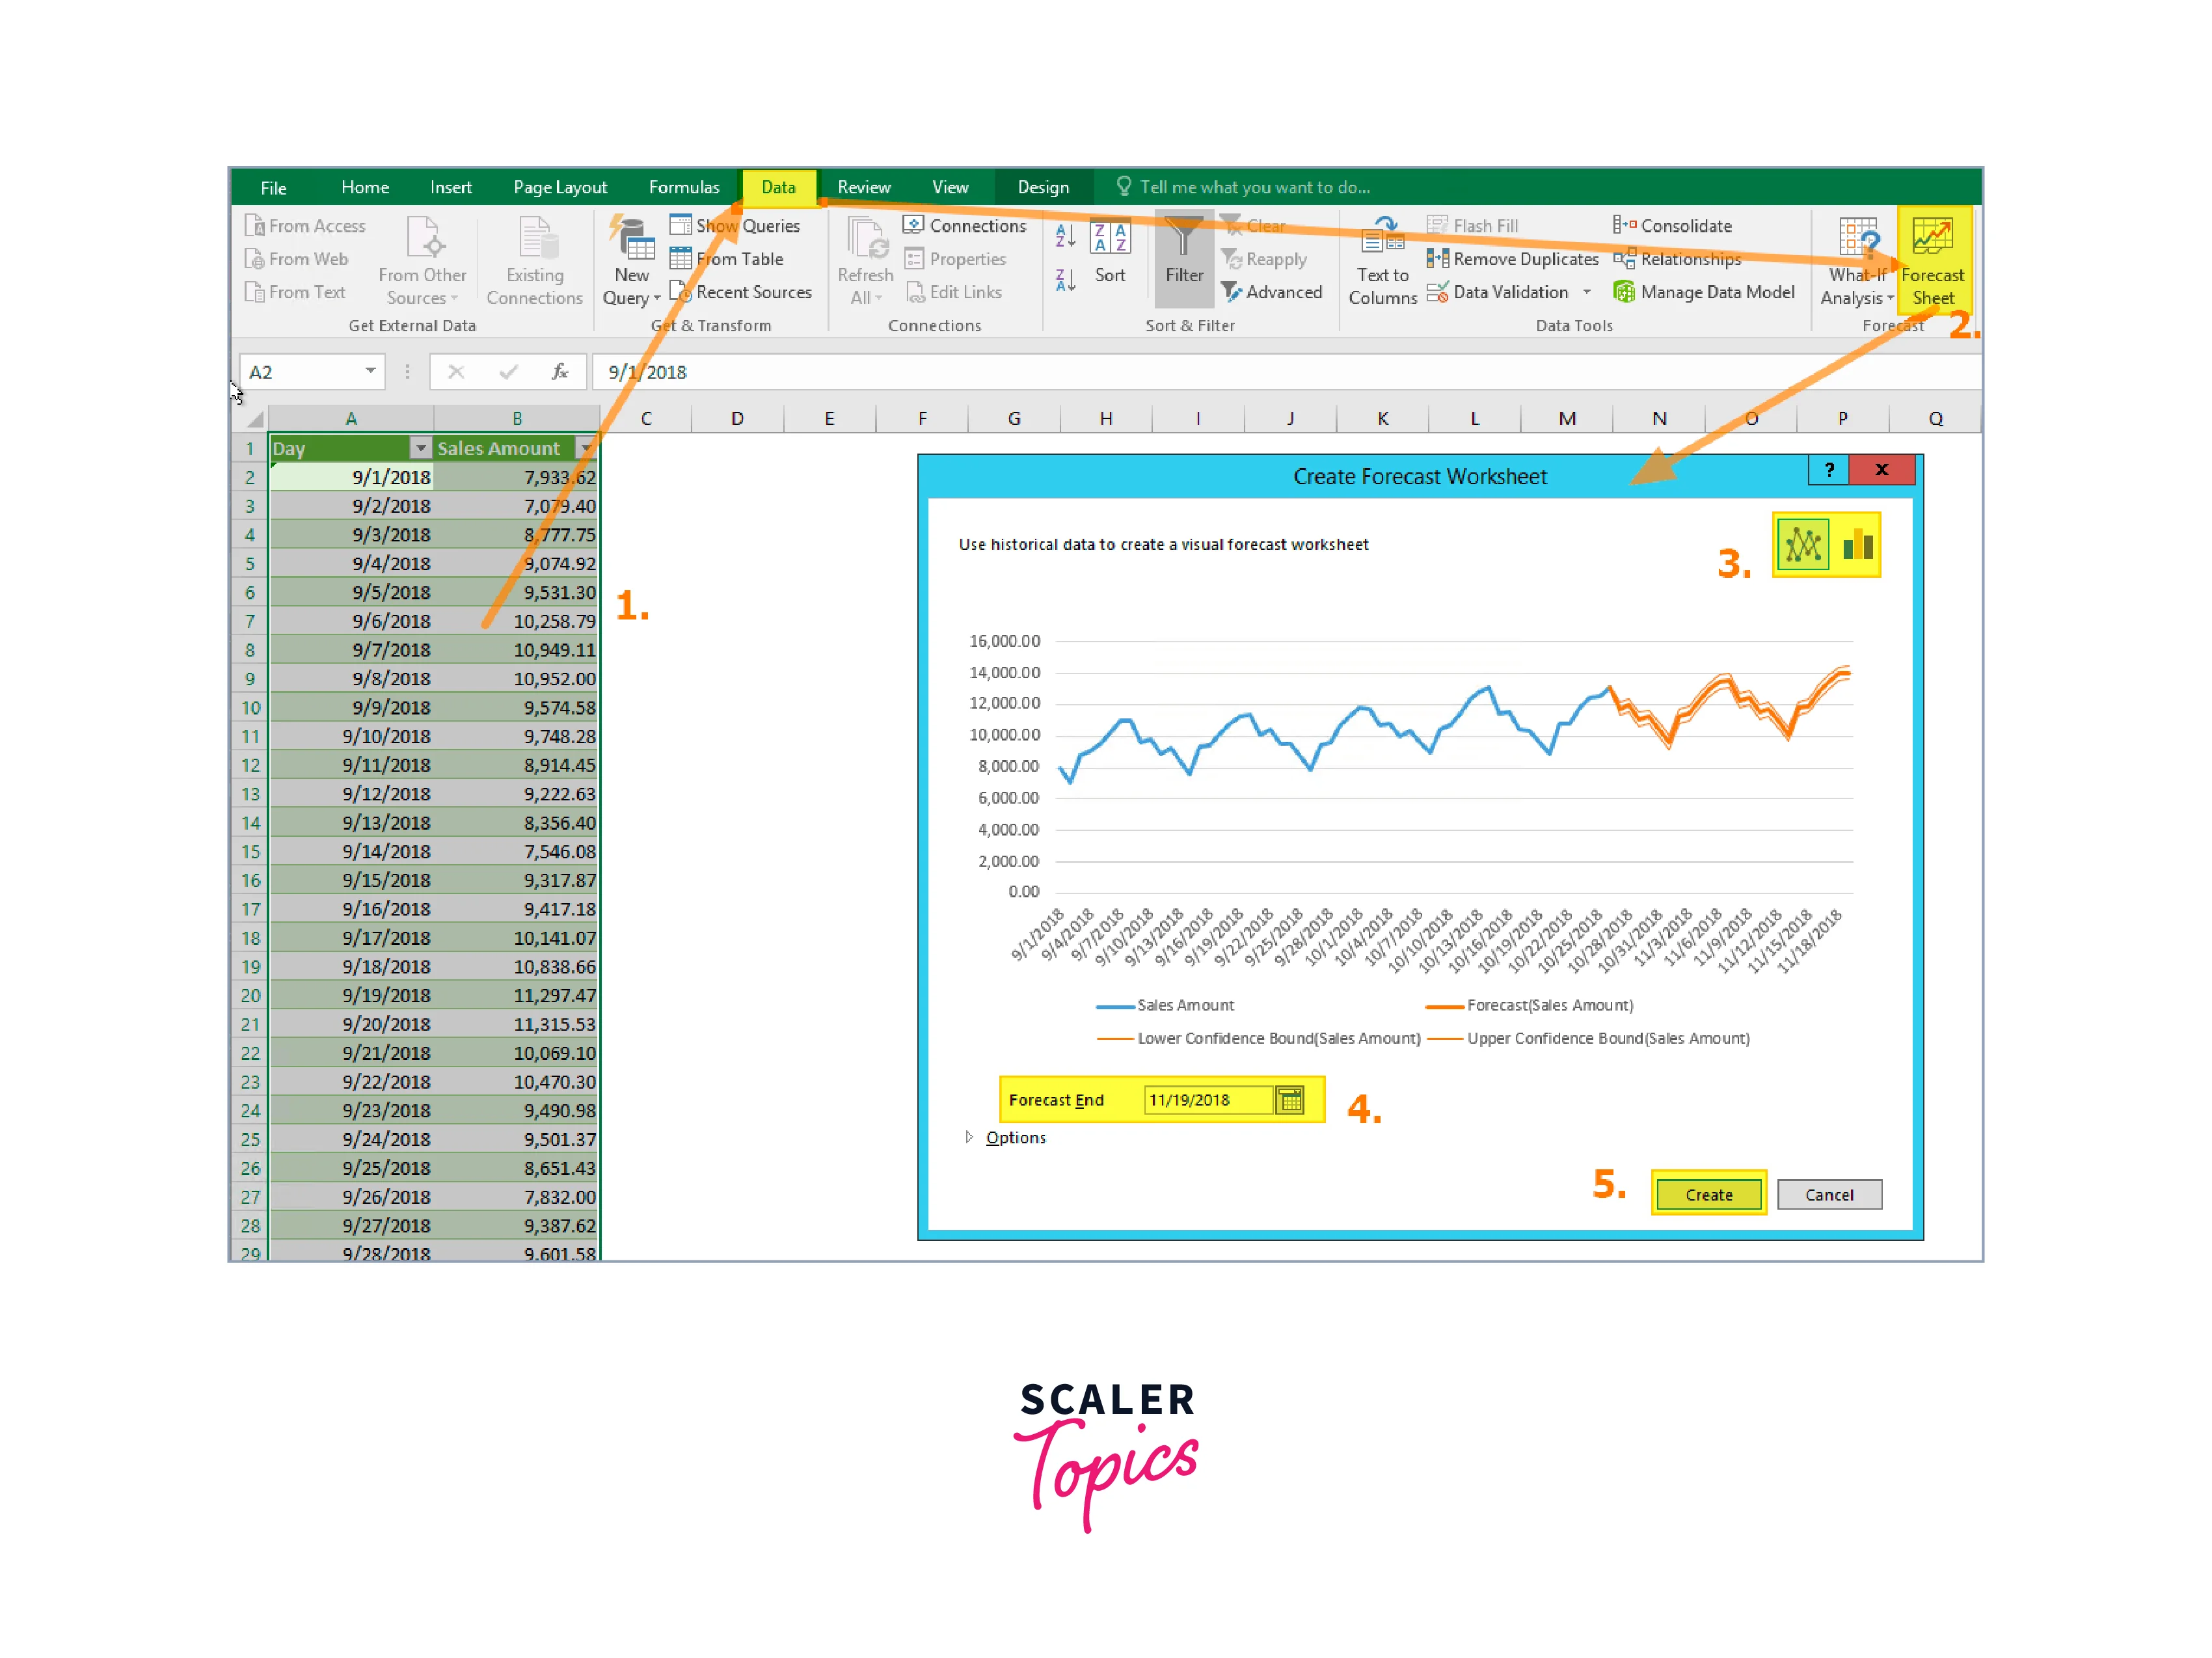
Create a Forecast in Excel
Method 1. Exponential Smoothing
Creating a sales forecast in Excel using the exponential smoothing method involves several steps. This method is useful when you have a time series of sales data and want to predict future sales based on historical patterns. Let's break down the process into easy-to-follow steps:
Step 1: Prepare Your Data
Start by organizing your historical sales data in Excel. Create a column for dates and another for corresponding sales values. Ensure that the data is sorted in chronological order.
Step 2: Calculate Initial Values
To initiate the exponential smoothing calculation, you need to establish initial values for the forecast. In this method, you need to determine the initial forecast value and the initial smoothing factor (alpha). Set the initial forecast value as the first sales value in your data and choose an initial alpha value between 0 and 1.
Step 3: Calculate Forecast Values
In a new column, calculate the forecast values using the exponential smoothing formula. The forecast for the next period is calculated by multiplying the previous forecast value by (1 - alpha) and adding the product of the alpha value and the corresponding actual sales value. Use absolute cell references to ensure consistency in calculations.
Step 4: Adjust the Alpha Value
Evaluate the accuracy of your forecast by comparing the forecasted values to the actual sales values. Adjust the alpha value to improve the accuracy of your forecast. Experiment with different values until you achieve satisfactory results.
Step 5: Visualize the Forecast
To visualize the forecast, create a line chart that includes both the actual sales data and the forecasted values. Select the data range, including both the dates and the sales values. Insert a line chart and choose the appropriate chart type. Make sure to label the axes and provide a title for the chart.
Step 6: Extend the Forecast
Once you have established a satisfactory forecast for the historical sales data, you can extend it to predict future sales. Add new dates in the date column for the period you want to forecast. Use the exponential smoothing formula to calculate the forecasted values for these new dates, based on the most recent actual sales value and the adjusted alpha value.
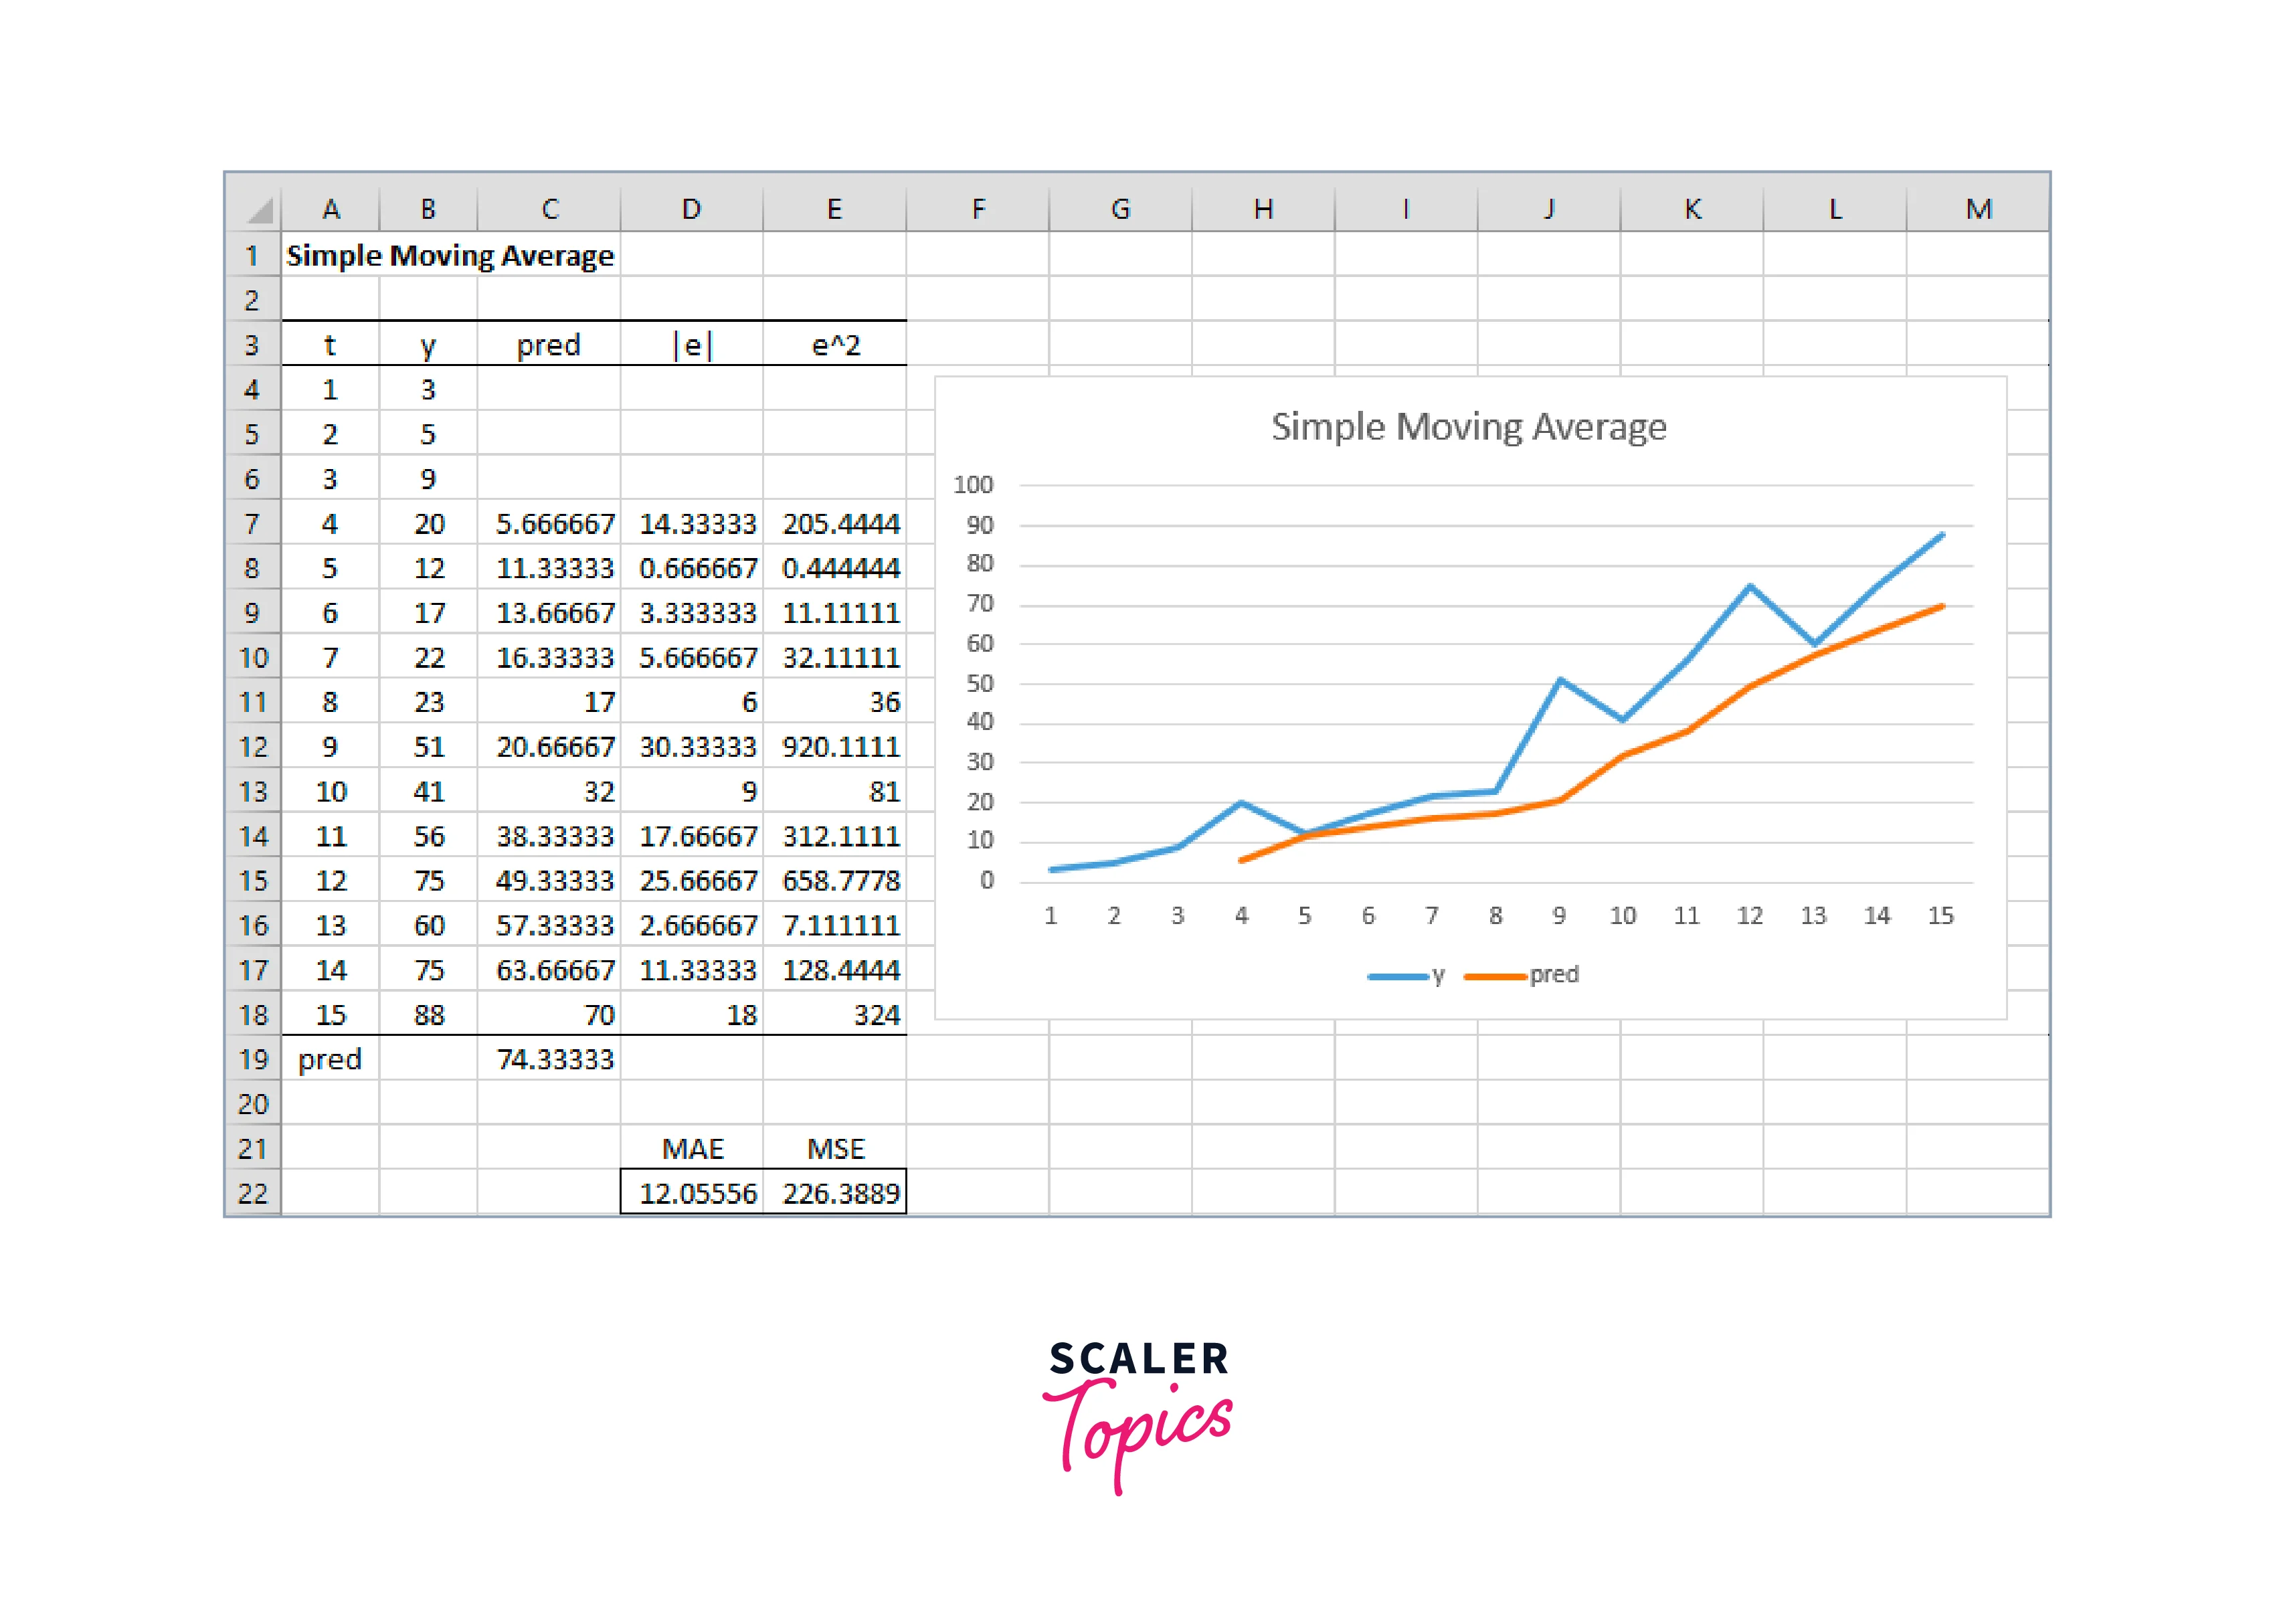
Method 2. Moving Average
Creating a sales forecast using the Moving Average method in Excel can be done in several steps. The Moving Average method calculates the average of a specific number of previous data points to predict future sales trends. Here's a step-by-step guide on how to create a forecast using the Moving Average method in Excel:
Step 1: Organize your data
Start by organizing your sales data in an Excel spreadsheet. Create two columns: one for the dates and another for the corresponding sales figures. Ensure that your data is sorted in chronological order, with the oldest dates at the top.
Step 2: Determine the number of periods for the Moving Average
Decide on the number of periods you want to consider for your Moving Average. This represents the number of previous data points you will use to calculate the average. For example, if you choose a three-period Moving Average, you will calculate the average of the current and two previous data points.
Step 3: Add a column for the Moving Average
Insert a new column next to your sales figures column. This column will contain the Moving Average calculations. Label the column appropriately, such as "Moving Average" or "Forecast."
Step 4: Calculate the Moving Average
In the first cell of the Moving Average column (next to the first data point), enter the formula to calculate the Moving Average. Assuming your sales figures are in column B and you chose a three-period Moving Average, the formula would be:
This formula calculates the average of the current data point and the two previous data points.
Step 5: Apply the formula to the remaining cells
Copy the formula from the first cell of the Moving Average column and paste it into the remaining cells corresponding to your sales data. Excel will automatically adjust the formula for each row, taking into account the appropriate data points for the Moving Average calculation.
What's Next?
After building the Sales Forecasting project in Excel, there are several important steps to take in order to maximize its effectiveness and ensure its ongoing success. Here are the next key points:
-
Data Maintenance:
Implement a process for ongoing data maintenance and updates. Regularly update the historical sales data to capture the latest trends and patterns. Clean and preprocess new data to maintain data quality and consistency.
-
Monitoring and Tracking:
Continuously monitor and track the accuracy of the forecasts generated by the tool. Compare the forecasted sales figures with the actual sales data to assess the performance of the forecasting models. Identify any discrepancies or deviations and refine the models accordingly.
-
Model Refinement:
As new data becomes available and the forecasting models are evaluated, refine and improve the models as needed. Adjust model parameters, incorporate additional variables, or explore different forecasting techniques to enhance the accuracy of the forecasts.
-
Integration with Real-Time Data:
Consider integrating the Sales Forecasting tool with real-time data sources. This may include incorporating external data such as economic indicators, market trends, or industry-specific data. Real-time data can provide valuable insights and help improve the accuracy of sales forecasts.
-
Collaboration and Feedback:
Seek feedback from users and stakeholders who utilize the Sales Forecasting tool. Understand their experiences, challenges, and suggestions for improvement. Incorporate user feedback into future iterations of the tool to enhance its usability and effectiveness.
-
Continuous Learning and Development:
Stay updated on the latest advancements in sales forecasting techniques, Excel features, and statistical models. Attend relevant training programs, participate in online communities, and explore new research and methodologies. Continuously enhance your skills and knowledge to optimize the Sales Forecasting tool.
Conclusion
- By leveraging Excel's built-in functions and tools, such as trend analysis, regression analysis, and time series analysis, businesses can analyze past sales patterns and make informed projections for future sales performance.
- Excel's data visualization features, including charts and graphs, enable businesses to present sales forecasts in a visually appealing and easily understandable manner, facilitating communication and decision-making.
- Excel's flexibility allows for scenario analysis and "what-if" modeling, enabling businesses to assess the impact of different factors, such as pricing changes, market trends, or marketing campaigns, on their sales forecasts.