Java Stack Trace

Overview
A Stack Trace in Java is nothing but a list of all the method calls that a program has executed till the point an error was thrown. It is automatically generated when an exception occurs in the code. Stack Trace known as Stack Backtrace is an array of stack frames. The stack frames represent the development of an application during the execution of the program. Stack trace is a top-down representation of all things that have been allocated or all the memory executions that a program has done until it reached the error case.
Introduction of Stack Trace in Java
Imagine running into some error in your code and your program suddenly stops without throwing any exceptions or errors. It behaves like a black box where one doesn't have any idea what went wrong, for what reason, or where to even start looking. One can get easily get lost with no hint of what to do!
This is when Stack trace comes into the picture. It is one of the most useful things in programming. Understanding how stack trace works are critical in order to effectively debug our code.
A Stack Trace is a representation of a call stack. A call stack or runtime stack is a set of stack frames a program creates as it executes, organized in a stack data structure. It contains information on the methods/functions that our program called.
What is Stack Trace in Java?
Stack trace in Java is a list of frames that starts at the current method and extends to when the program started. It gathers the information of all the methods that are called by a program. It is basically our program’s attempt to tell what all functions have been called up until the point where our program produced an error. Whenever unhandled exceptions are thrown, stack traces are simply printed to the console by default.
To print the exceptions that crashed our program, we have a method called printstackTrace(). This method is found in Java’s throwable class. Throwable is super-class for all exception classes. It shows throwable Exception object as well as other Information like the line number where the Exception occurs and the class name where the exception occurred. It is discussed in detail in a later section of the article.
After the launch of Java 1.5, stack trace got encapsulated into an array of a Java class called StackTraceElement.
The StackTraceElement class facilitates a constructor that accepts four parameters as arguments and builds a stack trace element that represents the specified execution point.
The Four Parameters of Stack Trace in Java
-
declaringClass: The name of the class that contains the execution point.
-
methodName: It denotes the method name that contains the execution point.
-
fileName: It denotes the file name that contains the execution point.
-
lineNumber: It denotes the line number of the source of the execution point.
Let's look at one Example:
Output:
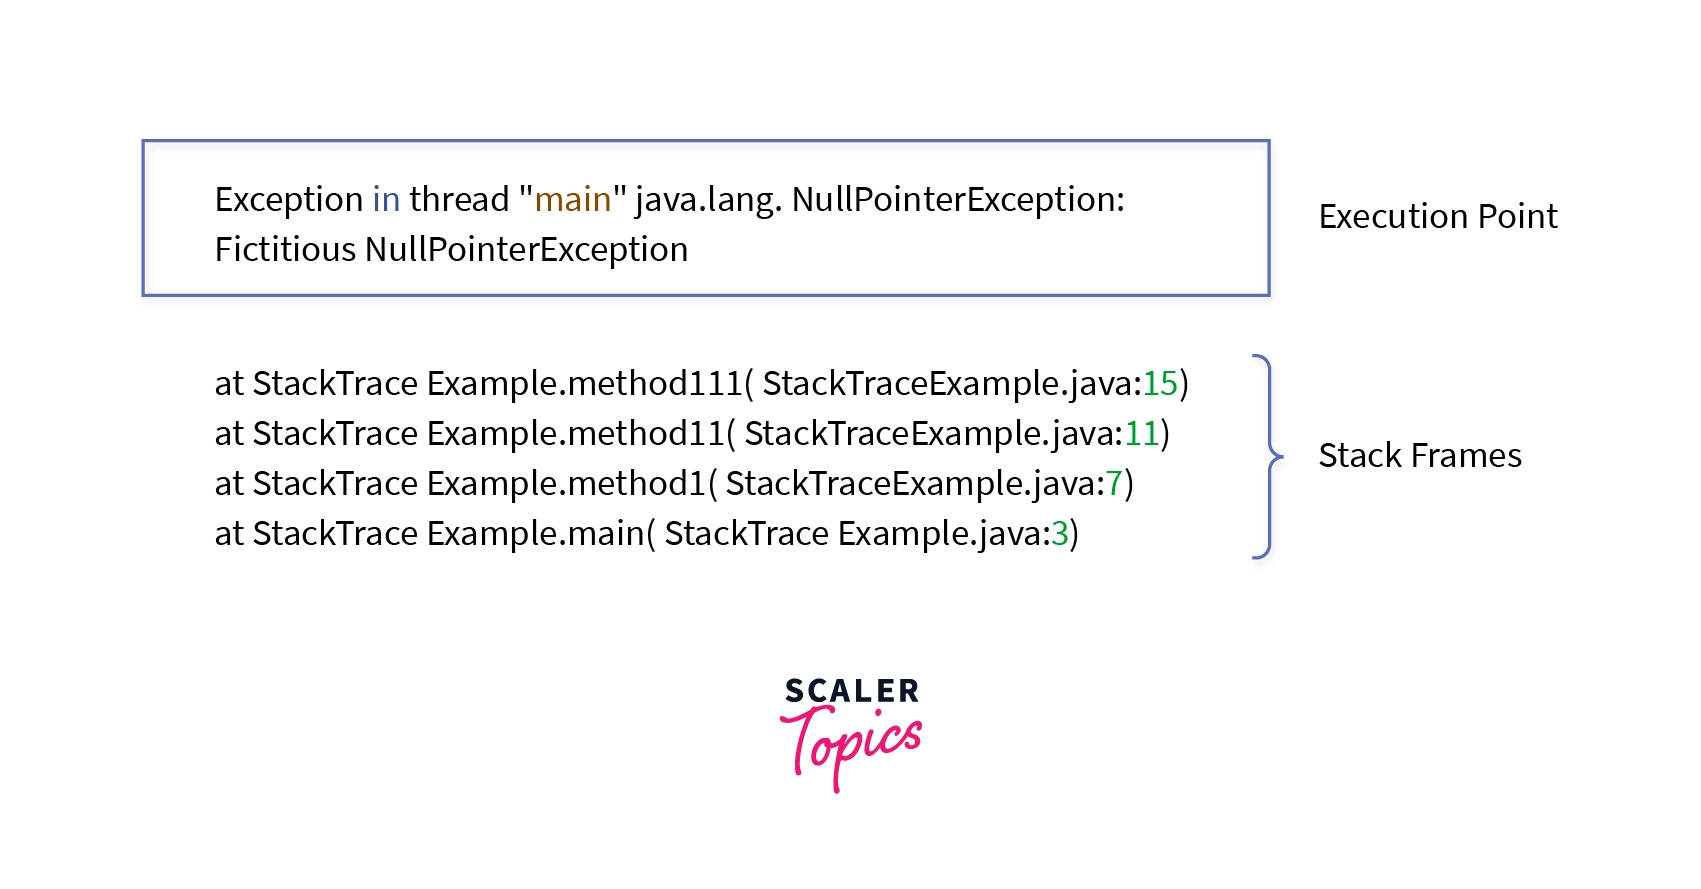
We got the execution point in the first line, and from the second to the end line, we got stack frames that form the complete stack trace. The main() method is at the bottom because that's where the program started. As the program started, first, the main() method was executed. The main() method called demo(). demo() called demo1(), demo1() called demo2(), demo2() called demo3(), and demo3() finally called dumpStack(), The dumpStack() method of thread class prints the stack trace of the current thread (thread is the path followed when executing a program) to the standard error stream.
A java stack trace is like a snapshot of a moment in time. It tells where our program was and how it reached there.
Scaler Placement Report and Statistics
Scaler learners achieved 2.5x salary growth with average post-Scaler CTC reaching ₹23L.
How to Use Stack Traces in Java?
We now know what Java Stack Traces are! Let's learn how to use them.
Transform Your Career
Choose from our industry-leading programs designed for career success
Modern Software and AI Engineering Program
Master full-stack development with AI integration

Modern Data Science and ML with specialisation in AI
Advanced data science techniques with AI specialization
Advanced AIML with Specialisation in Agentic AI
Deep dive into AIML with focus on Agentic systems
DevOps, Cloud & AI Platform Engineering
Build and manage AI-powered cloud infrastructure
AI Engineering Advanced Certification by IIT-Roorkee
Premier AI engineering certification from IIT-Roorkee
1. Java Exceptions
Exceptions and Stack Traces are intertwined with each other. Whenever our program throws an exception, a stack trace is associated with it. As soon as our code produces an exception, the runtime checks the stack for a handler to handle the exception. If it doesn't find one then the program exits. Below are three ways listed to handle exception messages in Java:
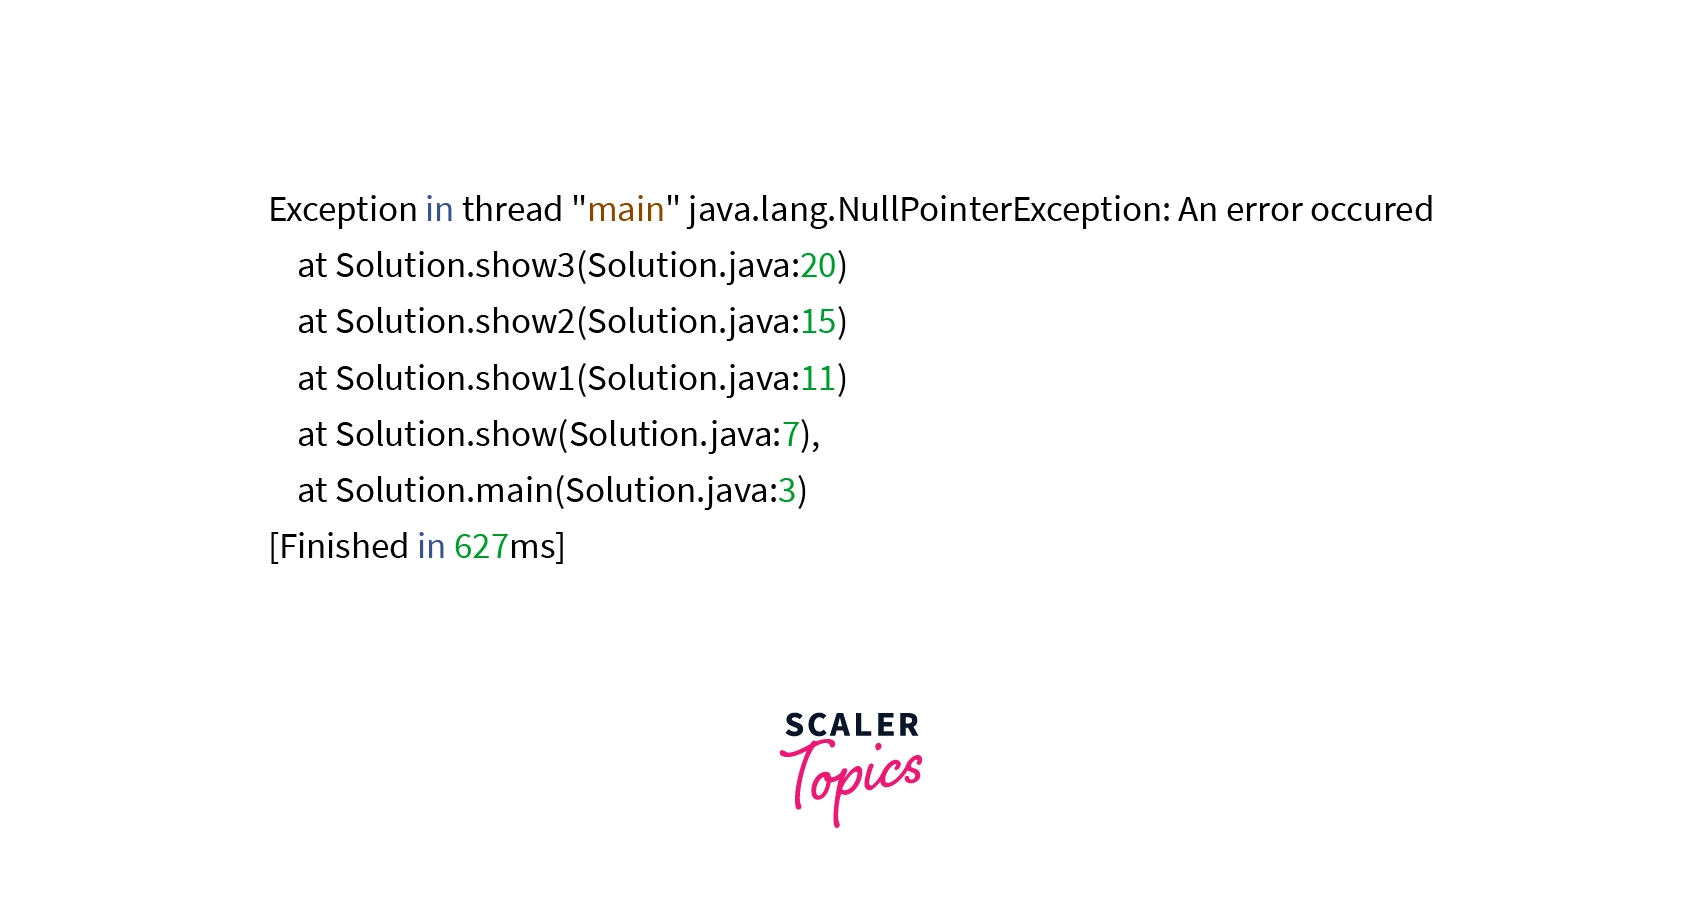
- java.lang.Throwable.printStackTrace() method: This method returns the name of the exception and description of the exception separated by a colon, and stack trace in the following lines.
Syntax:
For Example:
Output:
- toString() method: This method will only return the name and description of the Exception.
Syntax:
Example:
Output:
- java.lang.Throwable.getMessage() method: This method only returns the description of the Exception.
Syntax:
Example:
Output:
2. Logging Java Stack Traces
Logging is the method of listing log messages during the execution of a program to get error and warning messages as well as info messages. It is a powerful tool for debugging program's run-time behavior.
The java.util.logging package lends the logging capabilities using the Logger class. Popular logging frameworks like Log4j, Logback, etc. will write exceptions with stack traces when called with the right arguments. Java Exception object will be passed as the last argument to the message like the sample code below:
where exception is the Java Exception object. It will print the stack trace of the Java Throwable object.
3. The Java Debugger
A debugger is a powerful tool that fixes bugs faster by providing an insight into the internal operations of a program. It displays the program stack and allows us to traverse it in either direction. It gives a more complete picture of the stack frame.
For Example:
Output:
Here show3() throws the exception in debugger.
4. Forcing a Thread Dump
A thread dump is a complete picture of the state of all threads that are a part of the process. The state of each thread is represented by a stack trace, which displays the contents of a thread's stack. If our application stops responding or is consuming more CPU or memory than expected, then we can get information about the running app using jstack. jstack is a command line utility used in troubleshooting.
Determine the ProcessID of the running app and run jstack. On windows, press ctrl+break in DOS window to capture thread dump.
Syntax: For capturing thread dump
It displays thread dump in the console.
How to Read a Java Stack Trace?
Let's know how to read a Java Stack Trace.
The first line informs about the Exception. It states the reason for the Exception in the code, and for more information about the cause of that exception, we need to search and read the lines below move, and the main cause can many times be found near the bottom of the stack trace.
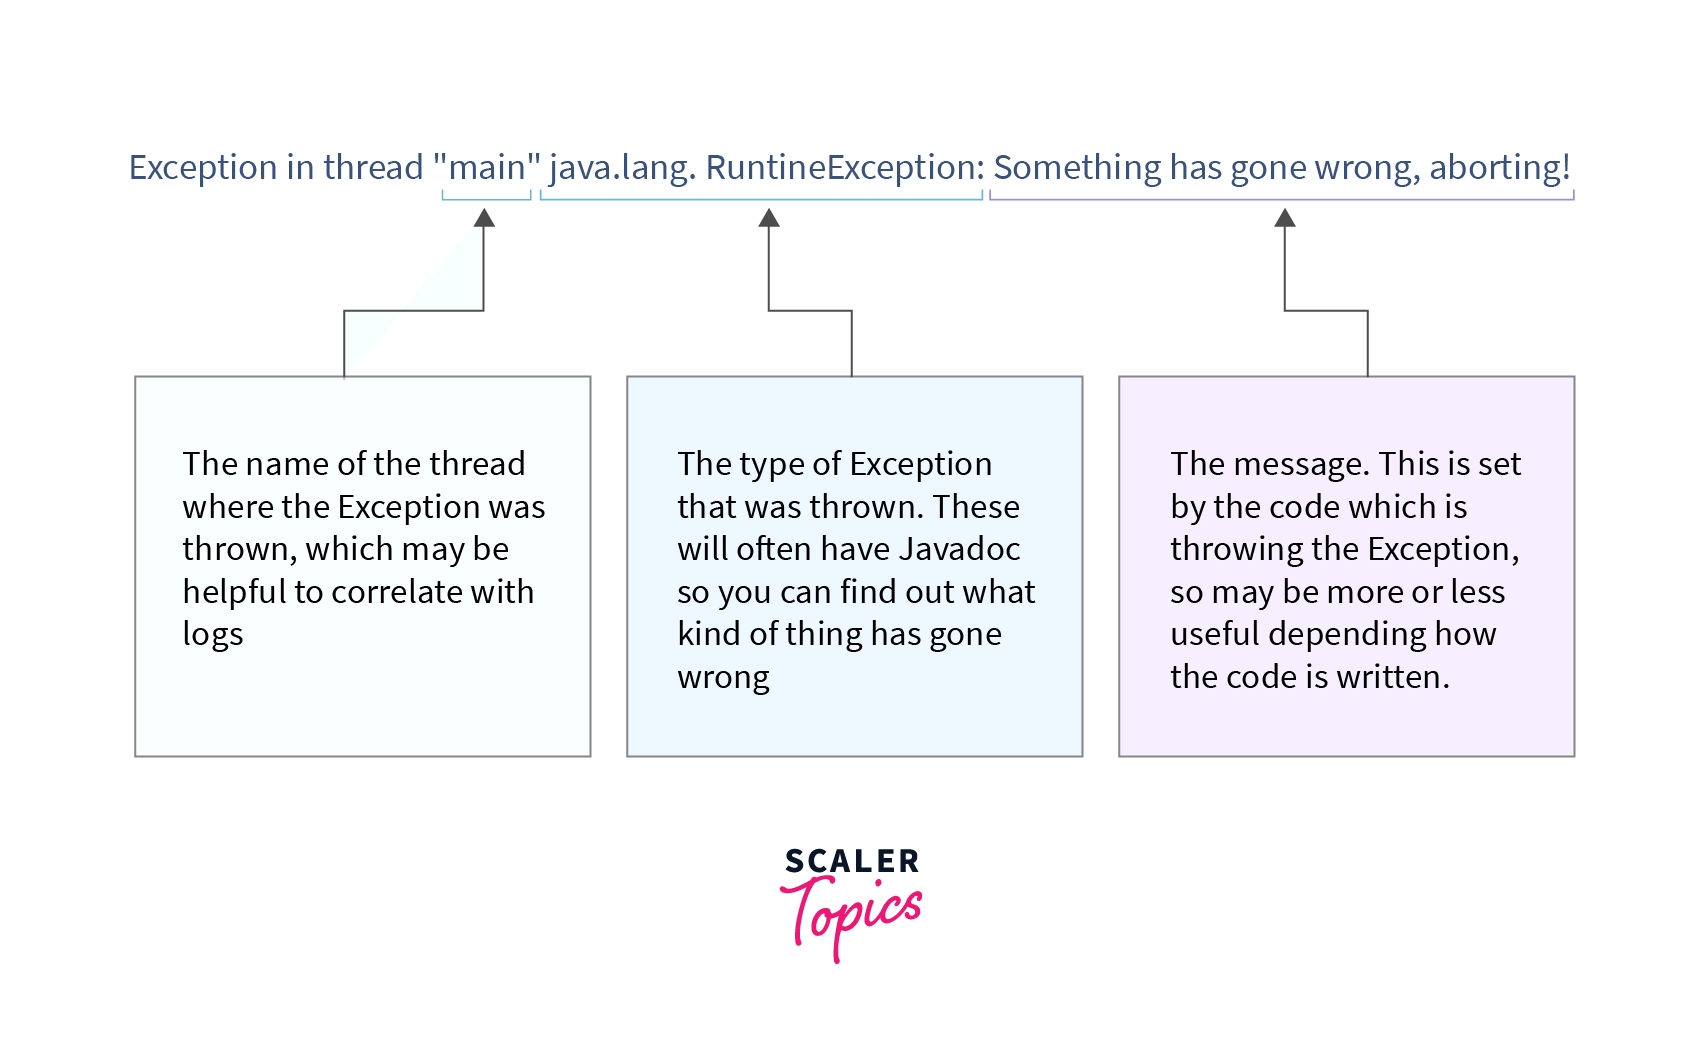
Here, in the first line, main specifies the name of the thread where the Exception occurred. java.lang.RuntimeException is the type of exception that was thrown which is followed by a message that may be inscribed in the code by the developer.
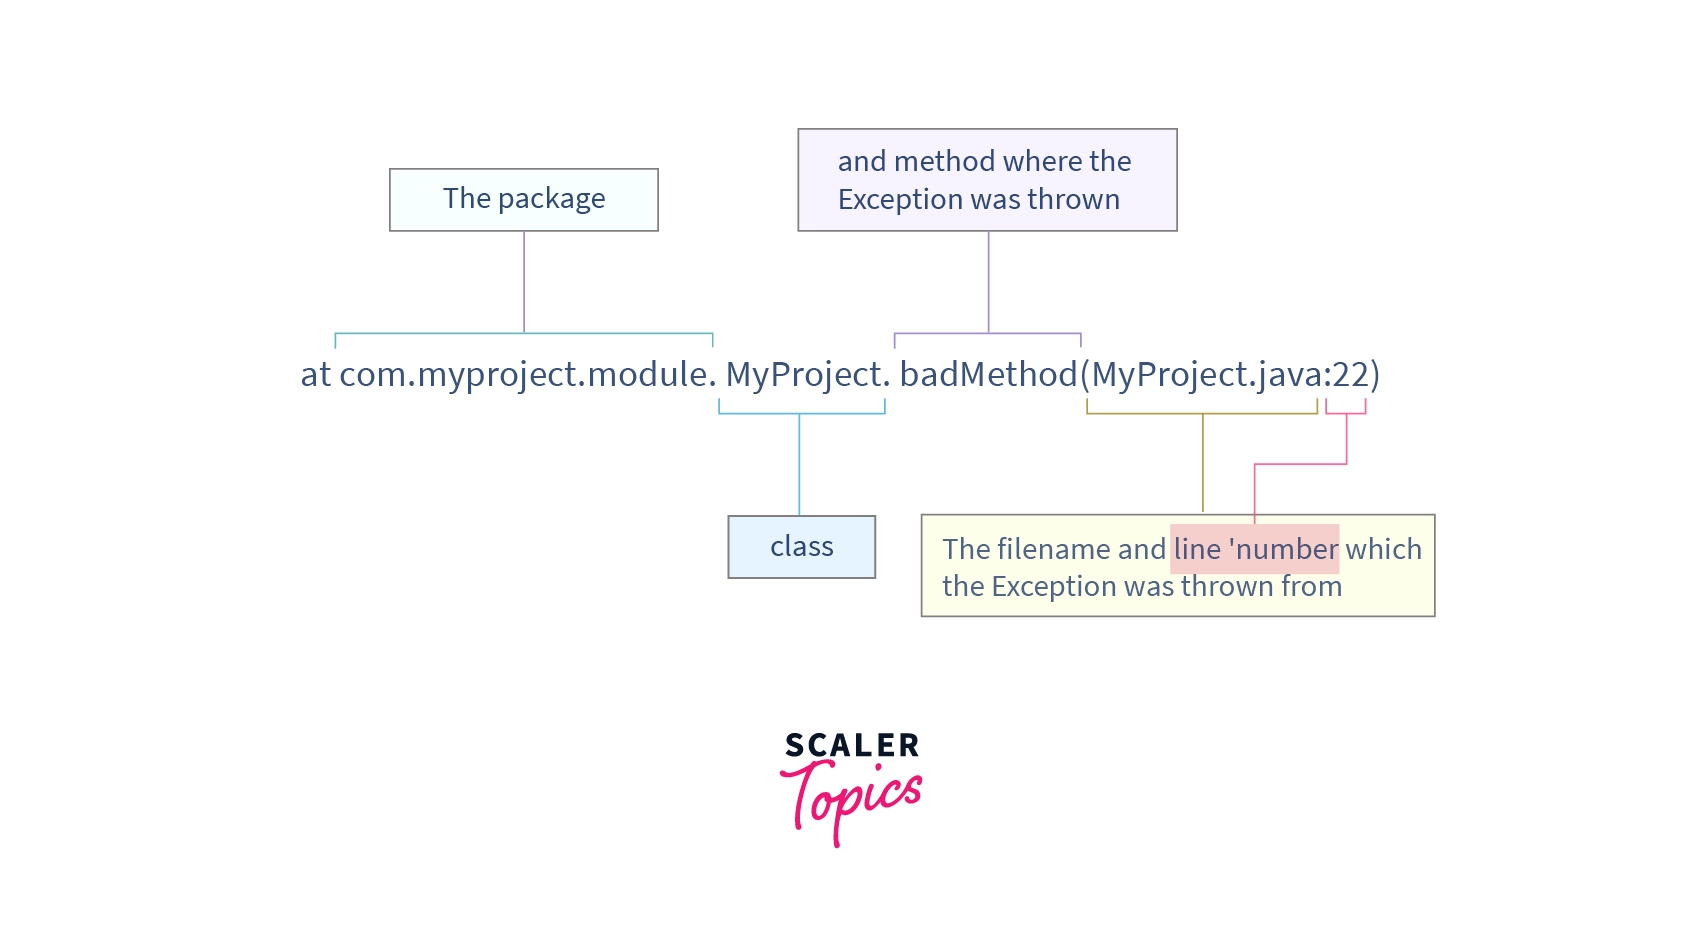
The following line shows the state of code at the time when the exception occurred. Reading the stack trace from bottom to top, we can know the exact path from the beginning of the code right to the exception.
What Triggered the Stack Trace?
Stack trace is triggered as soon as our program detects an Exception. An Exception is generally a plain throw statement.
Run-time exceptions can be thrown without a throw statement in cases like NullPointerException, ArithmeticException, ArrayIndexOutOfBoundsException, OutOfMemoryError and many more.
Dealing with Exception Thrown by Libraries
Java has a powerful library set. When Exceptions are thrown, which are from the library, we must check if the error occurred because of how the code used it.
Take an example:
If Bars is zero, then output will be something like this:
In this Example: Fraction.getFractionthrew an ArithmeticException as it has a zero denominator. In the stack trace, the first line talks about the type of Exception ArithmeticException and contains the message: The denominator must not be zero. It clearly tells what could have gone wrong and the below lines talks about the line number which caused the Exception.
Some libraries have Javadoc which includes information about the kinds of exceptions that may be thrown and why.
Turn Learning into Career Growth
The Stack Walking API
The Stack Walking API lends a versatile mechanism to traverse and extract information from call stacks. In simple words, it has the capability to walk through a stack in Java. It was a powerful feature introduced in Java 9. Stack Walker provides a snapshot of the current thread stack along with some methods to access it.
1. Drawbacks of StackTraceElement
A StackTraceElement object provides more information than a single line of the Stack trace. However, all the data is in simple form i.e. a String or a primitive value, it can't reference a Class object. Hence it becomes very difficult to use information from a stack trace in the program.
Another disadvantage in the old way of retrieving stack frames is that unwanted stack frames cannot be ignored. Moreover, some important elements may get lost as JVM skips some frames for enhanced performance. Hence, there are chances that some useful elements can get lost and unwanted elements remain.
2. The Stack Walking API to the Rescue
Stack Walking API has many benefits which shadow the drawbacks of StackTraceElement object:
-
It provides a way to skip classes, which in turn allows us to process our interest-specific classes.
-
It provides a way to load only certain frames to tackle performance issues.
-
It provides a way to understand application behavior more easily.
This API works around the StackWalker class, which encloses two inner types: StackFrame and Option.
3. Stack Frames
An instance of the StackFrame interface represents an individual frame in a stack. There is an important API that makes StackFrame a better choice than StackTraceElement called getDeclaringClass. This method returns a Class instance, enabling us to perform more complex operations than one could do with a simple class name. However, this is only applicable if the stack walker is set up to retain Class objects.
4. Stack Walker Options
It is a static nested class of StackWalker. The stack walking options of a StackWalker determines the information of StackFrame objects to be returned.
Here’s a complete list of its constants:
-
RETAIN_CLASS_REFERENCE: retains the Class object in each stack frame during a stack walk.
-
SHOW_REFLECT_FRAMES: Shows all reflection frames.
-
SHOW_HIDDEN_FRAMES : shows all hidden frames, including reflection frames.
Scaler Placement Report and Statistics
Scaler learners achieved 2.5x salary growth with average post-Scaler CTC reaching ₹23L.
5. The StackWalker Class
The StackWalker is the main class of StackWalker API. We create its objects, using overloading static methods named getInstance. We walk through stack traces and apply a Function to the stream of Stack Frames using StackWalker.walk() method.
6. Stack Walking with No Options
No-option StackWalker walks through the call stack retaining only frames that are of interest and returns them as a list.
The above example will return a list consisting of methods whose class has a name starting with com.stacktrace.
Benefits of Stack Trace in Java
-
Java stack trace aids in figuring out the Exception thrown by our code.
-
It provides information on the methods that our code called.
-
It is a very useful debugging tool.
-
It is our program’s attempt to tell what all functions have been called up until the point where our program produced an error.
Conclusion
- Stack Trace, also known as Stack Backtrace is an array of stack frames. It is generated when an exception occurs in the code.
- A call stack or runtime stack is a set of stack frames a program creates as it executes, organized in a stack data structure.
- Stack trace is a top-down representation of all things that have been allocated or all the memory executions that a program has done until it reached the error case.
- The Stack Walking API lends a versatile mechanism to traverse and extract information from call stacks.