Grid Package in R Programming
Overview
The Grid package in R provides an advanced graphics system, enabling researchers and data scientists to customize, construct, and edit complex graphical objects. Unlike the traditional base graphics, Grid offers fine-grained control over the components of a plot, allowing for highly modular and customizable visualizations. Whether designing sophisticated lattice plots, layering different graphics, or simply seeking more control over graphical elements, the Grid package is your toolkit. Dive in to harness its capabilities and elevate your data visualizations to the next level in R.
Grid Package in R
R offers many packages for data visualization, each tailored to specific needs. While the base graphics system is intuitive and widely used, scenarios demand more intricate and refined visual representations. Enter the Grid package—an advanced graphics system designed to cater to these requirements.
-
Foundation and Philosophy
The Grid package is not just an enhancement of base graphics but a complete reimagining. Built from the ground up, its core philosophy revolves around the "grob" (graphical object) concept. Grobs allows users to manipulate every minute detail of a graphic, whether the size, positioning, or layering, thereby providing unmatched control.
-
Significance of Grobs in the Grid System:
At the heart of the Grid package in R lies the concept of "grobs" or graphical objects. These are foundational units that represent various components of a plot, such as points, lines, axes, and labels. Understanding grobs is pivotal because they allow for fine-grained control and manipulation of individual elements within a graphic. Every visual element in a Grid plot can be thought of as a grob. By manipulating these grobs directly, users can achieve customizations and modifications that might be challenging or even impossible through higher-level plotting systems. Furthermore, the hierarchical nature of grobs allows for a structured and organized approach to plot creation and modification. As you delve deeper into Grid, the versatility and power of grobs become more evident, making them a cornerstone of advanced visualizations in R.
-
Lattice and ggplot2: Built on Grid
Two of R's most popular graphics packages, lattice and ggplot2, are constructed on the Grid system. This underlines the package's importance in the R visualization ecosystem. When you craft plots with ggplot2, for instance, you're indirectly leveraging the power of Grid.
-
The Learning Curve
While the capabilities of the Grid package are vast, they come with a steeper learning curve compared to base graphics. But the trade-off is clear: those who invest the time to master Grid gain the ability to create visual masterpieces tailored exactly to their requirements.
-
Key Functions and Utilities
The Grid package has functions and utilities designed to facilitate intricate graphics creation. Functions like grid.rect(), grid.lines(), and grid.text() allow users to draw, modify, and annotate their plots with precision.
As we delve deeper into the Grid package, we'll uncover the nuances of grobs, viewports, and other essential components. These elements form the backbone of this powerful graphics system, empowering R users to visualize data in previously unimaginable ways.
What is Grid package?
Grid package is one of R's cornerstone visualization systems, providing a highly flexible and modular approach to crafting visual data representations. But what exactly sets it apart, and why has it garnered so much attention in the data visualization community?
-
The Essence of Grid package
At its core, Grid package is built around the concept of "graphical primitives" and "graphical objects" or "grobs" for short. These grobs are the fundamental building blocks of a plot, and they can be anything from points, lines, and rectangles to more complex components like legends and axes.
-
A Departure from Base Graphics
Unlike R's base graphics system, which takes a procedural approach (plotting elements in sequence), Grid package operates on a more object-oriented paradigm. Here, you create and modify grobs and layer them onto a scene. This allows intricate control over each plot aspect, making fine-tuning and customization more accessible.
-
The Hierarchical Viewport System
One standout feature of Grid package is its viewport system. Think of viewports as "frames" or "windows" within which specific parts of a graphic are displayed. These viewports can be nested, allowing for the creation of intricate graphics with multiple coordinated subplots or facets.
-
Modularity and Reusability
Given its object-oriented nature, Grid package promotes reusability. Grobs created for one plot can easily be repurposed for another, ensuring consistency across visualizations and reducing redundant work.
-
Integration with Popular Packages
Grid package' impact is evident when you consider that powerhouse packages like ggplot2 and lattice are built upon it. These packages streamline and simplify the process of creating advanced visualizations by providing higher-level functions and abstractions, all while harnessing Grid's capabilities.
In essence, Grid package isn't just an alternative to base graphics—it's a system that redefines how visualizations are approached and constructed in R. As we proceed, we'll uncover techniques and tips to maximize the potential of this powerful visualization tool.
Grobs in Grid Package in R
In the vast universe of the Grid package, "grobs" emerge as the elementary particles, forming the very fabric of every visualization. But what are grobs, and how do they underpin the Grid's advanced graphics system?
-
Understanding Grobs
The term "grob" is short for "graphical object." Every element you visualize using the Grid system — a line, a point, an axis, or a complex chart component — is a grob. This object-oriented representation gives users the granularity to dissect, modify, and reconstruct graphics piece by piece.
-
Types of Grobs
There are various grob classes in the Grid package, each representing different visual elements:
- Primitive Grobs: These are the most basic types, like pointsGrob, linesGrob, and rectGrob.
- Compound Grobs: These are collections of grobs combined to form a more complex structure. For instance, axisGrob is a compound grob consisting of a linesGrob for the axis line and textGrob for the axis labels.
- Custom Grobs: Users can tailor their grobs to specific visualization needs.
-
Manipulating Grobs
One of the standout features of the Grid package is the ability to manipulate grobs after they've been defined. Functions such as grobWidth or grobHeight allow users to query dimensions, while editGrob can modify a grob's properties. This decoupling of creation and modification is what allows for Grid's flexibility.
-
Layering with Grobs
In Grid package, visualizations are built layer by layer, stacking grobs on top of one another. This layering process allows for intricate designs where grobs can overlap, interact, or be nested within one another, providing depth and detail to visual stories.
-
Grob Trees and Hierarchies
Grobs can be organized into hierarchical structures, known as grob trees. This tree can represent the entire plot or parts of it, allowing for macro and micro-management of the graphic's components.
Grobs (graphical objects) are fundamental to Grid package, representing the basic elements you draw. Here's a code example to demonstrate the utilization of grobs in the Grid package in R:
Output:-
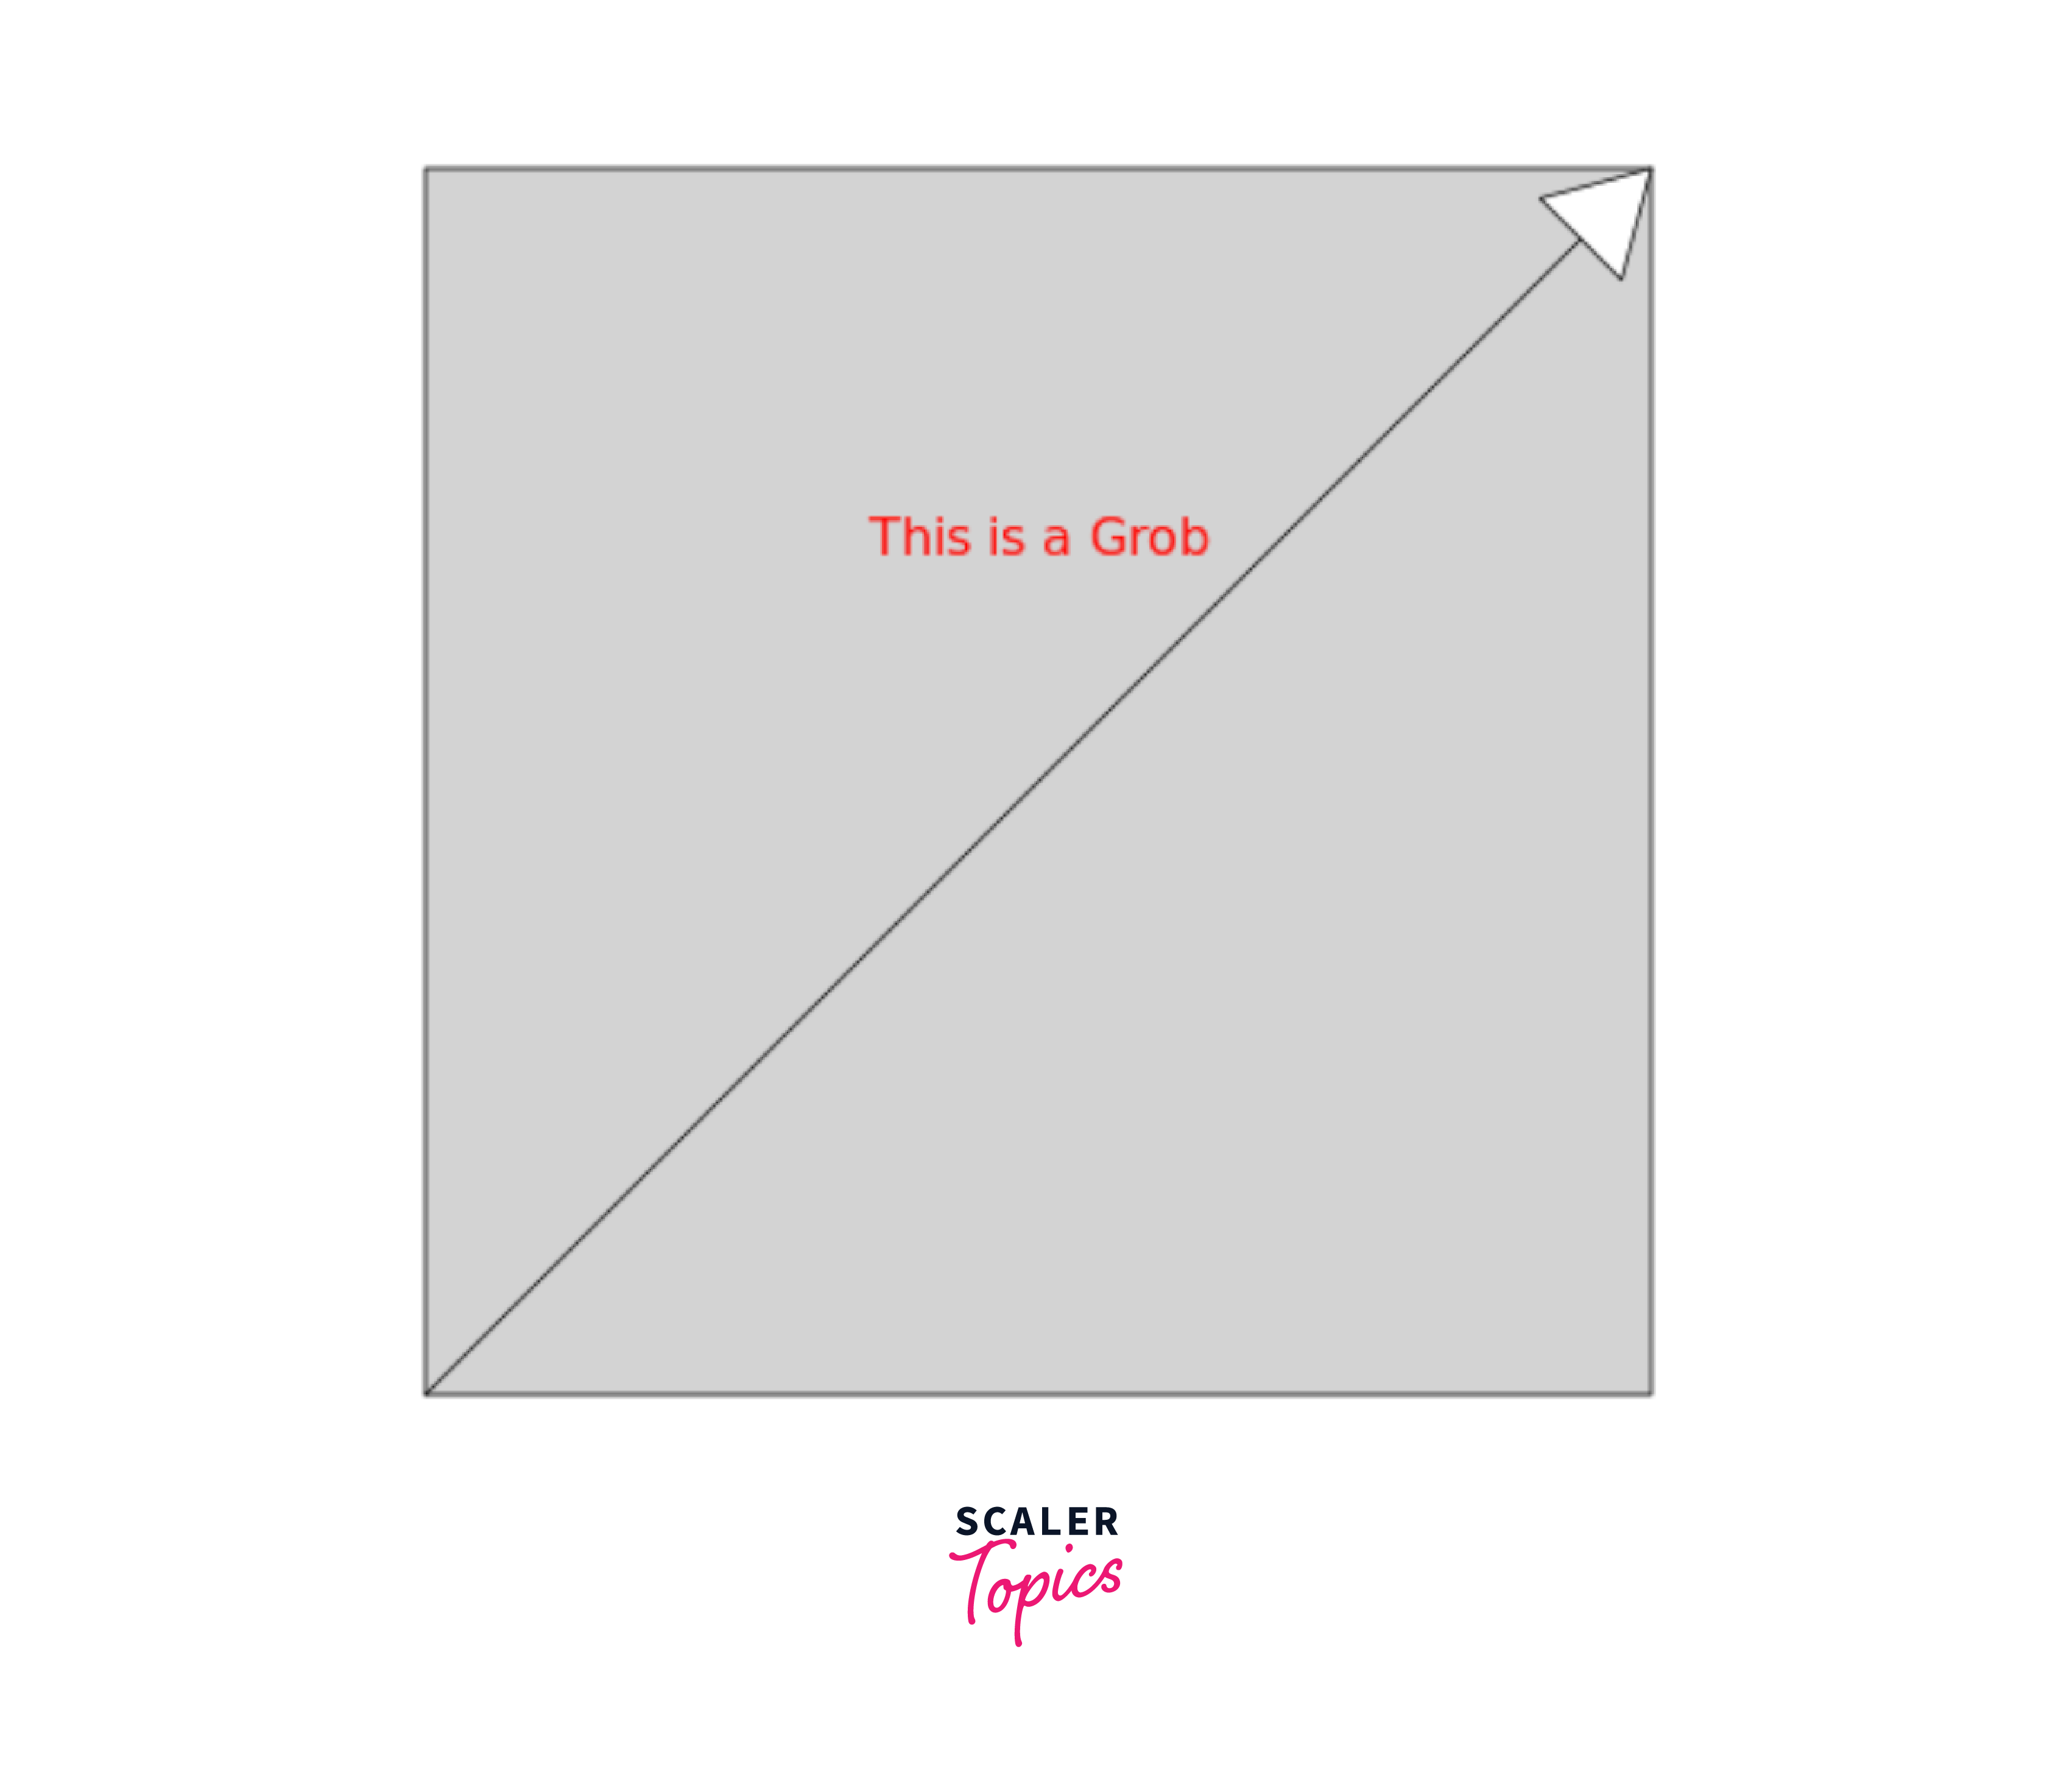
In this example:
-
Creating Grobs: We create a line grob (line_grob) with an arrow at its end and a text grob (text_grob) to display a message.
-
Viewport Creation and Usage: A viewport (vp) is defined to manage the area where we wish to draw. We push this viewport to make it the active drawing region.
-
Drawing Grobs: We use grid.draw() to draw the grobs inside the active viewport.
-
Exiting the Viewport: Once we're done drawing within it, we pop it to return to the default device space.
This example gives us a sense of how grobs can be created and manipulated, then combined with viewports for a structured graphical presentation. This encapsulates the modular nature of Grid package in R, where grobs act as individual pieces assembled in a structured space defined by viewports.
In conclusion, grobs are the essence of Grid's graphics system in R. Their flexibility, combined with the package's vast array of tools for manipulation, makes for an exceptionally powerful visualization platform. As we delve deeper, we'll discover the multitude of ways grobs can be used to craft the perfect visualization.
Viewports in Grid Package in R
As essential as grobs are to the Grid package, they'd be floating in a formless void without the anchoring concept of viewports. In the domain of Grid package, viewports act as stages or canvases upon which the graphical tales unfold. But what makes viewports pivotal, and how can they be harnessed to frame visuals effectively?
-
The Concept of a Viewport
In its most fundamental form, a viewport can be considered a rectangular region or "window" within which grobs are plotted. It defines the spatial context, determining where and how the grobs are displayed.
-
Hierarchical Nature of Viewports
Viewports can be nested within one another, creating a hierarchical structure. This nesting ability allows for complex layouts where plot regions have their own sub-plots or graphical elements, all coordinated within the same overall visual.
-
Creating and Navigating Viewports
To create a viewport in Grid, you would typically use the viewport() function, which allows for dimensions, location, and rotation customization. Once created, the pushViewport() function sets the new viewport as the active region for plotting. Conversely, popViewport() allows you to exit the current viewport and return to its parent.
-
Clipping: Setting Boundaries
A crucial feature of viewports is the ability to clip content. Clipping ensures that any grob plotted within a viewport does not spill over boundaries. This is vital when dealing with intricate layouts or when overlapping viewports.
-
Coordinating Scales and Ratios
Viewports are not just about positioning; they also play a significant role in determining the scales and aspect ratios of the grobs plotted within. Whether maintaining consistent scales across multiple plots or ensuring that a specific grob retains its proportions regardless of the viewport's size, the Grid package offers the tools for precise scale management.
In wrapping up, viewports serve as the spatial backbone of Grid package, establishing the structure and layout of the visual narratives. With a solid grasp of viewports, one can craft graphics that are not only visually appealing but also organized, coherent, and meaningful. As we further explore the Grid package, the symbiotic relationship between grobs and viewports will become even more apparent, showcasing the power and flexibility inherent to this advanced graphics system.
Here's a code example to demonstrate the power and flexibility of viewports in the Grid package in R:
Output:-
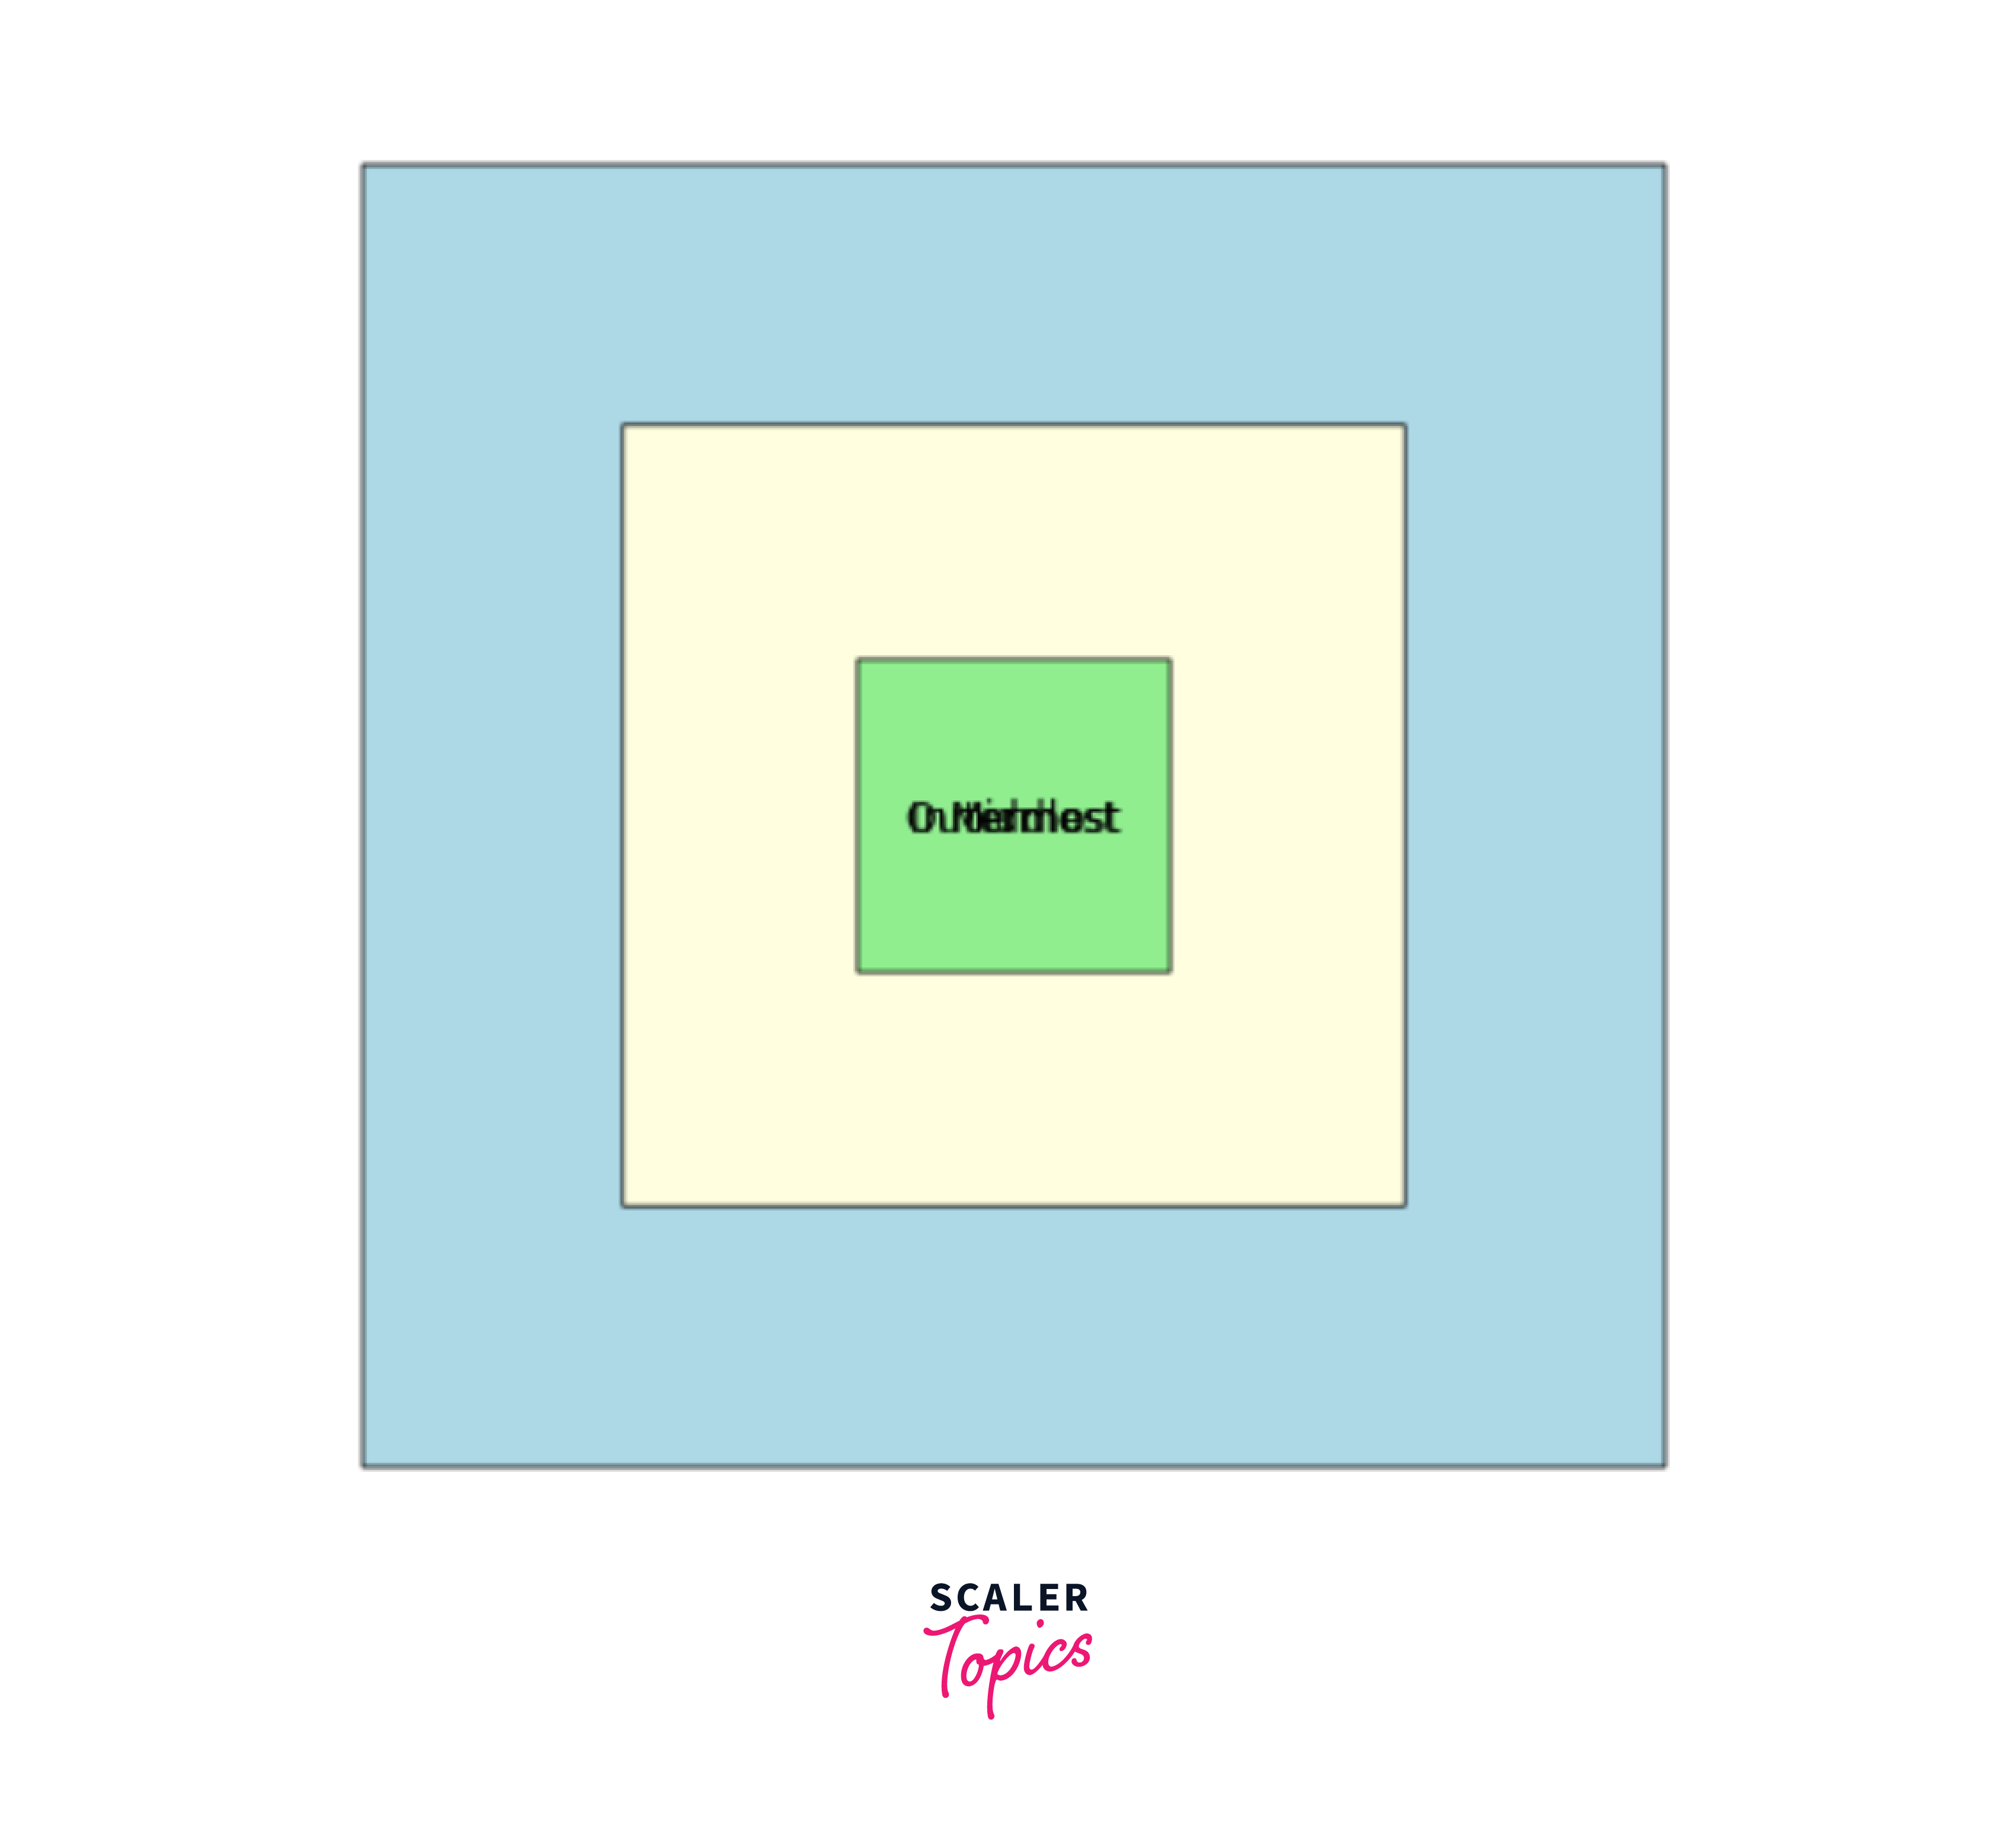
In this example:
-
Viewport Creation: We create three viewports (vp1, vp2, and vp3) of decreasing sizes and different background colors.
-
Nesting Viewports: By using pushViewport(), we nest the viewports inside each other. This demonstrates the hierarchical nature of viewports in Grid.
-
Drawing in Viewports: Within each viewport, a rectangle (grid.rect()) is drawn, filling the entire viewport.
-
Navigating Viewports: We use popViewport() to navigate back through the viewport hierarchy and add text labels to each layer.
This code showcases the ability to create, navigate, and draw within nested viewports, highlighting the flexibility and control that the Grid package offers when managing graphical space in R.
Grid package Coordinate Systems in Grid Package in R
In graphics, the plot's layout isn't just about positioning elements; it's also about understanding the space within which these elements reside. The Grid package in R takes a sophisticated approach to this spatial understanding via its coordinate systems. But what are these systems, and how do they influence the visual narratives?
-
The Essence of Coordinate Systems
In Grid package, coordinate systems dictate how points are mapped onto the plot. The mathematical framework transforms data values into visual points on the graphic, determining aspects like scale, direction, and origin.
-
Native and Normalized Coordinates
-
Native Coordinates: This system maps directly to the data values. For instance, plotting a point with x=5 and y=10 will be plotted at that exact location in the viewport. Native coordinates are especially useful when precise data representation is needed.
-
Normalized Coordinates: Normalized coordinates range from 0 to 1, with (0,0) representing the bottom-left corner of the viewport and (1,1) the top-right. These coordinates are relative to the viewport's size and are particularly beneficial for layouts and annotations that should maintain positioning irrespective of the actual data scale.
-
-
Coordinate Transformations
One of the standout features of the Grid package is its ability to transform coordinate systems. Using functions like xscale.components.default and yscale.components.default, one can manipulate the scales of the x and y axes, respectively. This allows for customized scales, such as logarithmic or even more complex transformations.
-
Interaction with Viewports
Coordinate systems and viewports go hand in hand. While viewports define the "where" (i.e., the spatial region), coordinate systems dictate the "how" (i.e., how data values are represented within that space). By adjusting coordinate systems within different viewports, one can craft coordinated multi-panel plots, where each panel may represent data differently.
-
The Flexibility of Grid Coordinates
Grid package isn't restricted to just native and normalized systems. Users can define custom coordinate systems tailored to specific visualization needs, granting additional flexibility to the plotting process.
To sum up, coordinate systems in Grid package form the foundational layer of the plotting process, acting as the bridge between raw data values and their visual representations. As with grobs and viewports, understanding and mastering these systems are crucial for crafting impactful, precise, and informative visuals in R using the Grid package.
Here's a code example showcasing how Grid package coordinate systems operate within the Grid package in R:
Output:-

This example demonstrates:
-
Viewport Creation: We create a simple viewport that occupies 80% of the device's width and height.
-
Native Coordinates: We plot a point using native coordinates. Since the coordinates are native and no specific coordinate transformation is applied, the point will be positioned exactly at (0.5, 0.5).
-
Normalized Coordinates: We use normalized coordinates to place a text label. The coordinates (0.5, 1.05) place the label at the center-top of the viewport.
Through this example, one can appreciate the versatility of different coordinate systems in the Grid package, allowing for precise control over positioning and layout.
The gridExtra Package
While Grid package in R provides a powerful foundation for creating sophisticated plots, sometimes users need more functionality to fine-tune their visualizations. Enter gridExtra: an add-on package that augments the capabilities of Grid package with additional utilities and functions. But what exactly does gridExtra bring to the table, and how can one harness its potential?
-
A Brief Overview
The gridExtra package is not a replacement for Grid package. Instead, it complements the core package by adding a slew of additional functions that aid in arranging and annotating multiple grid-based plots. It's particularly handy for those who combine multiple visualizations into a cohesive presentation.
-
Arranging Multiple Plots
One of the most commonly used features of gridExtra is the ability to arrange multiple grid plots in a grid layout. The grid.arrange() function is instrumental in achieving this:
Note : The plots created are simple rectangles filled with color.
-
Table Grobs: Displaying Data alongside Plots
With gridExtra, you can create "table grobs, " allowing you to integrate tables alongside your visualizations. It's an effective way to showcase underlying data or supplementary information:
-
Custom Layouts with arrangeGrob()
The arrangeGrob() function is similar to grid.arrange(), but instead of immediately drawing the combined plots, it returns a grob. This is especially handy if you want to save the combined plot for later:
-
Miscellaneous Utilities
gridExtra offers a variety of other handy tools, like grid.table() for displaying data frames as grid tables and functions to extract and modify grob properties with ease.
In essence, gridExtra amplifies the already robust Grid package system by adding utilities that cater to common visualization needs and challenges. Whether you're looking to arrange multiple plots, showcase data tables, or tweak grid properties, gridExtra offers tools that make the process intuitive and efficient.
Read More
For those eager to dive deeper into the world of Grid graphics in R and its extensions, the following resources will provide invaluable insights:
-
R Official Documentation for Grid: This comprehensive guide delves into the intricate details and functionalities offered by the Grid package in R. Read more here.
-
CRAN repository for gridExtra: An essential add-on package for Grid graphics, gridExtra provides utilities for arranging and augmenting graphical objects. Discover its full potential through its official documentation. Explore gridExtra on CRAN.
-
Hadley Wickham's "ggplot2: Elegant Graphics for Data Analysis": While ggplot2 is built on top of Grid, understanding its workings provides insights into the power of Grid graphics. Wickham's book is the definitive guide. Check out the book.
-
Paul Murrell's "R Graphics": Paul Murrell, the creator of Grid, has written an extensive book on R Graphics, which covers the core Grid system in depth. Find the book here. With these resources at your fingertips, mastering Grid package in R will be enlightening. Happy plotting!
Grid package in Modern Data Visualization: A Broader Perspective
The evolution of data visualization in the digital age has been fueled by the need to convey complex data in intuitive and insightful manners. Amidst the array of tools and frameworks available, Grid package in R stands out for several pivotal reasons:
-
Flexibility and Control: Grid package allows for unparalleled control over plot details, surpassing traditional plotting systems. This fine-grained control can be vital when designing advanced visualizations or custom graphics.
-
Layered Approach: Grid promotes a layered approach to graphics, enabling the superimposition of various graphical elements with ease. This is invaluable when constructing intricate visualizations where multiple data layers need to interact seamlessly.
-
Viewport Management: The concept of viewports, essentially a window into a portion of the graphics device, provides a structured approach to manage spatial regions. This becomes crucial when designing multi-faceted graphics or coordinating multiple plots.
-
Interactivity and Dynamism: Modern data visualization often demands interactivity, and the Grid system provides foundational support. The capability to drill down into granularities or animate transitions can be achieved more feasibly with Grid's robust structure.
-
Extensibility: Given that Grid is foundational to many of R's advanced plotting packages, like ggplot2, it underscores its extensibility. Users can not only harness Grid directly but can also utilize its capabilities through these higher-level packages.
-
Consistency with Modern Design Principles: The modular and object-oriented nature of Grid resonates well with modern design principles. As visualization demands shift towards more modular and reusable components, Grid's design philosophy remains pertinent.
In essence, Grid package isn't just a tool but a foundational paradigm in modern data visualization. As data continues to grow in complexity and volume, the need for versatile and powerful visualization tools like Grid becomes ever more pronounced.
Conclusion
- The Grid package in R offers a sophisticated and modular approach to creating graphics, making it possible to craft intricate visualizations with granular control.
- Through grobs and viewports, Grid facilitates a hierarchical and organized method for managing graphical elements and their space.
- Extensions like gridExtra underscore the flexibility and extensibility of the Grid system, allowing for enhanced functionality like arranging multiple plots.
- Grid's coordinate systems are robust, enabling users to define graphical elements across varying dimensions and scales precisely.
- To fully leverage the power of Grid package, one must delve deep into its rich documentation and associated resources, ensuring a holistic understanding and unlocking its immense potential for data visualization.