Classification Models | AUROC
Transform Your Career
Choose from our industry-leading programs designed for career success
Modern Software and AI Engineering Program
Master full-stack development with AI integration

Modern Data Science and ML with specialisation in AI
Advanced data science techniques with AI specialization
Advanced AIML with Specialisation in Agentic AI
Deep dive into AIML with focus on Agentic systems
DevOps, Cloud & AI Platform Engineering
Build and manage AI-powered cloud infrastructure
AI Engineering Advanced Certification by IIT-Roorkee
Premier AI engineering certification from IIT-Roorkee
Overview
While using Machine Learning algorithms, success is measured by the model's performance on the dataset. Therefore, we use AUROC - Area Under the Receiver Operating Characteristics. ROC or Receiver Operating Characteristics is a probability curve, and AUC or Area Under the curve depicts the separability.
Introduction to ROC Curve
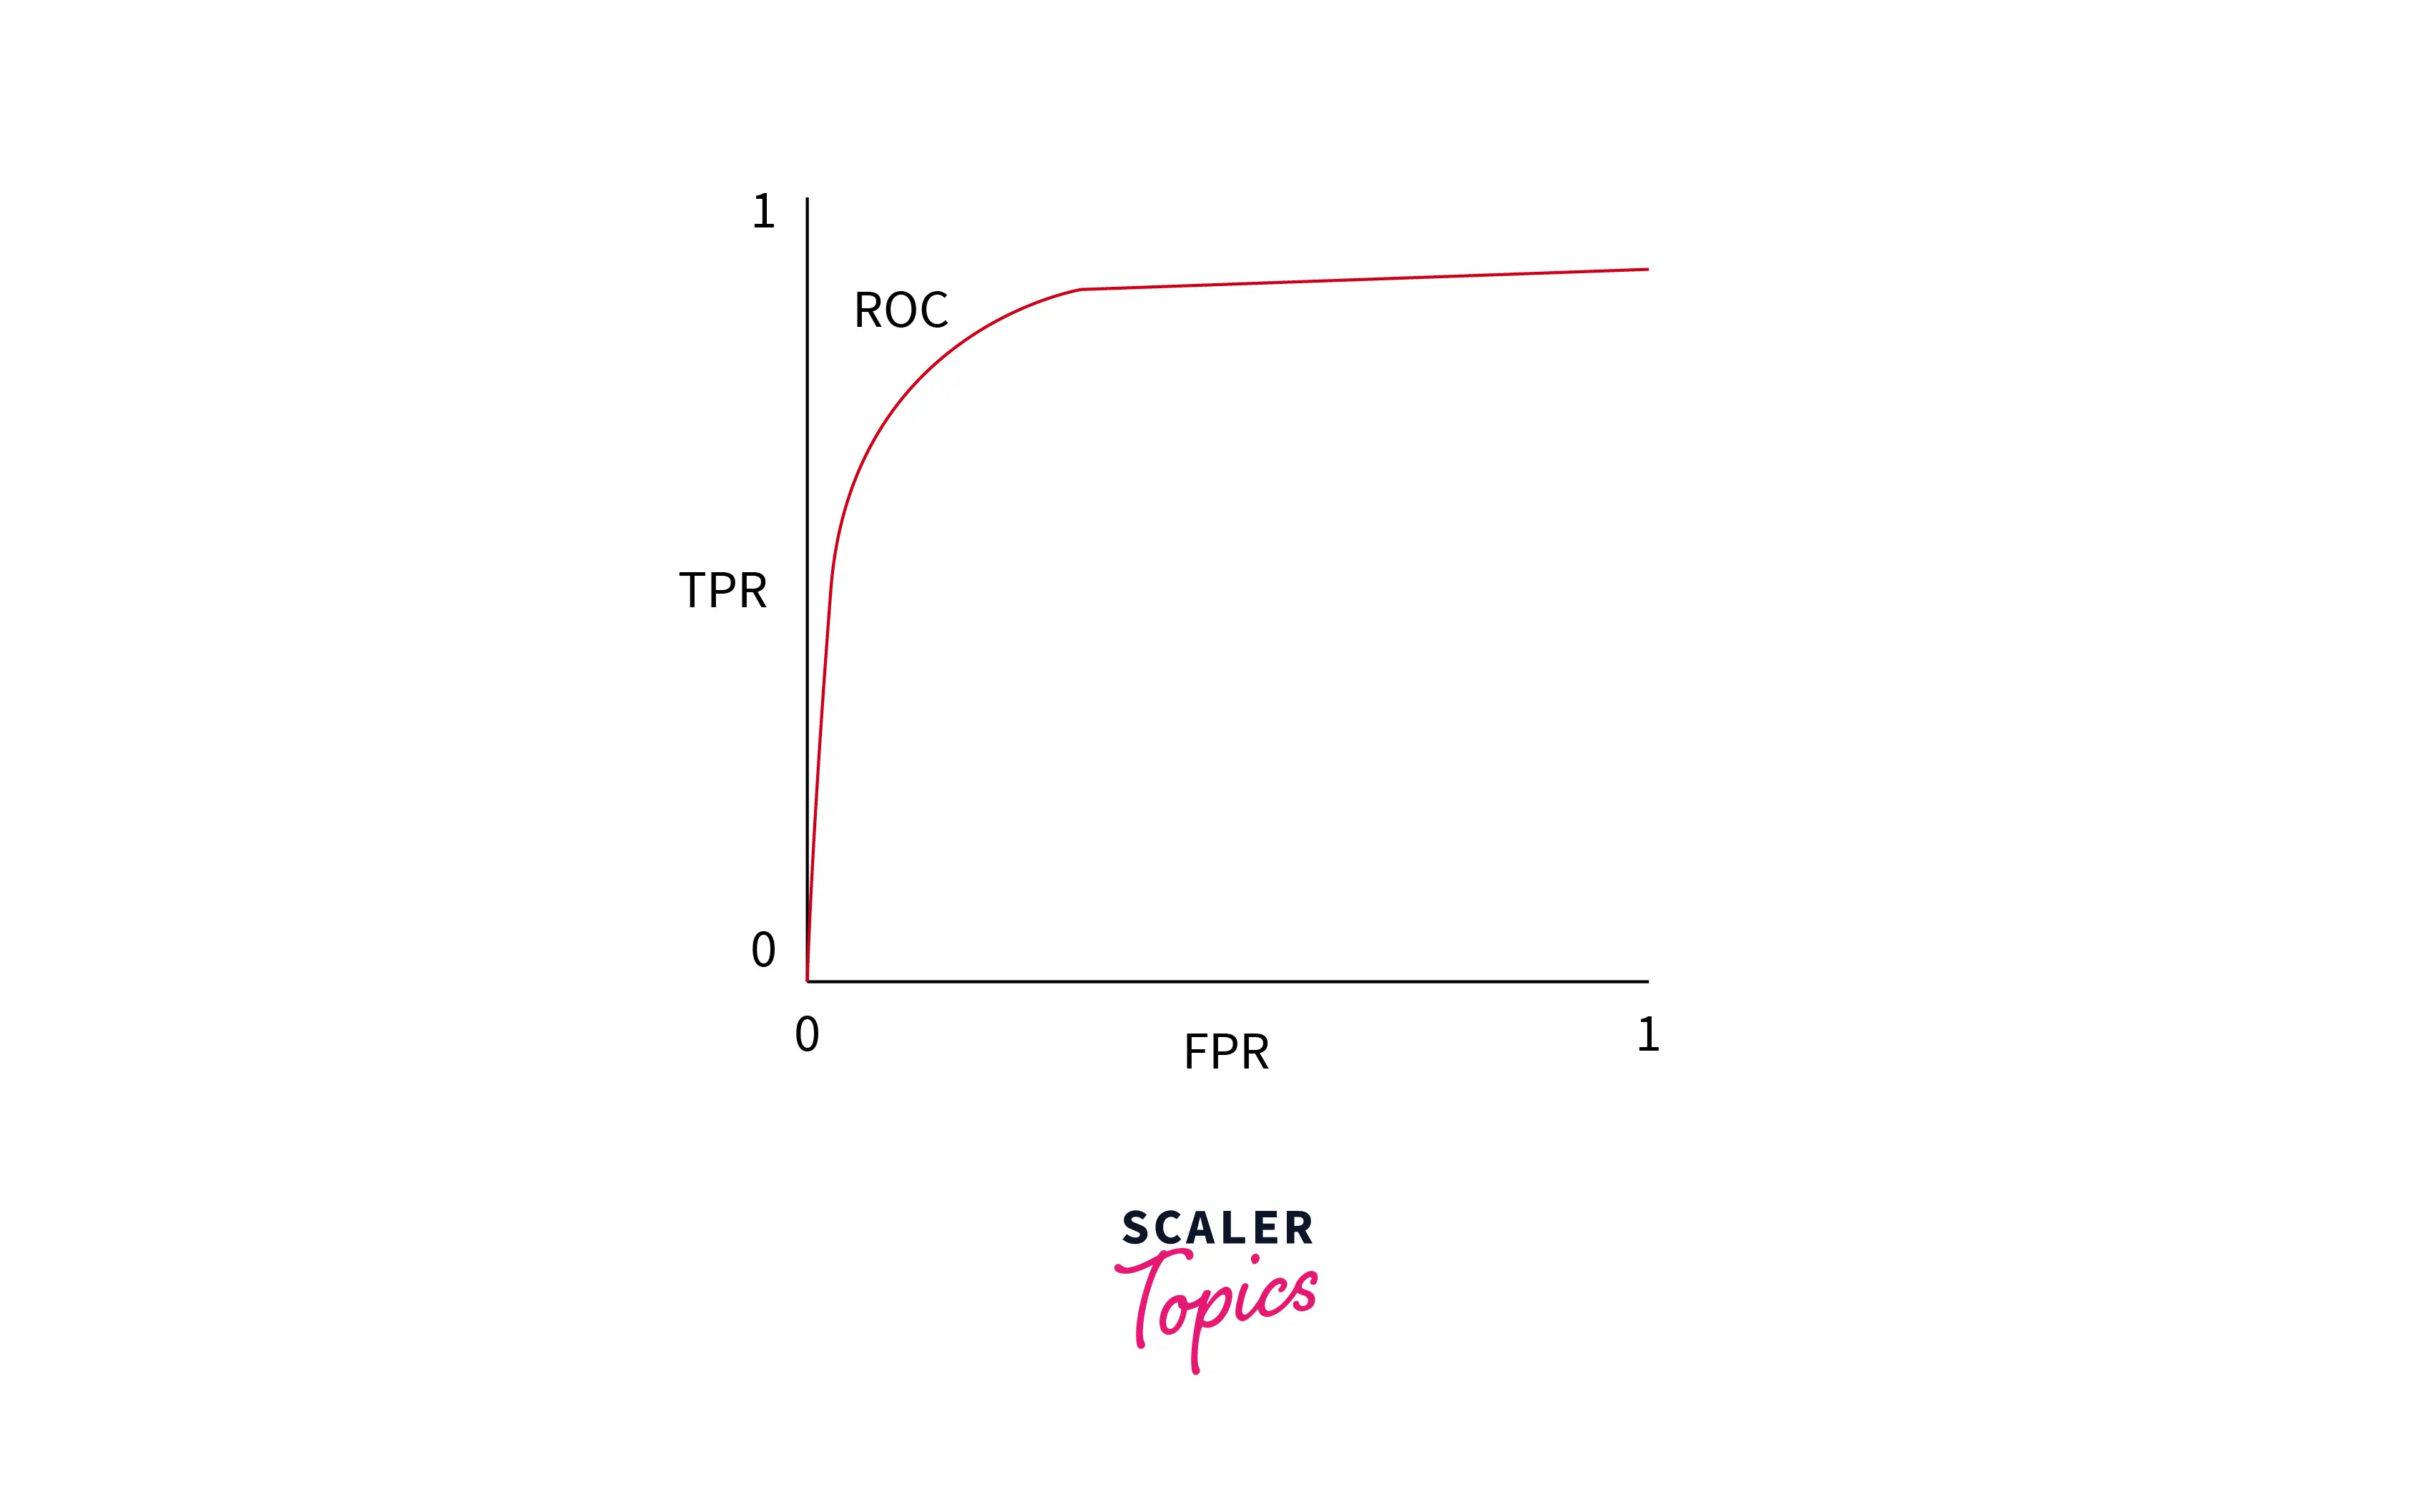
ROC or Reciever Operating Characteristic Curve is a visual representational graph that plots the performance of a classification model on various threshold levels.
The only limitation of ROC is that it can only be used for binary classification.
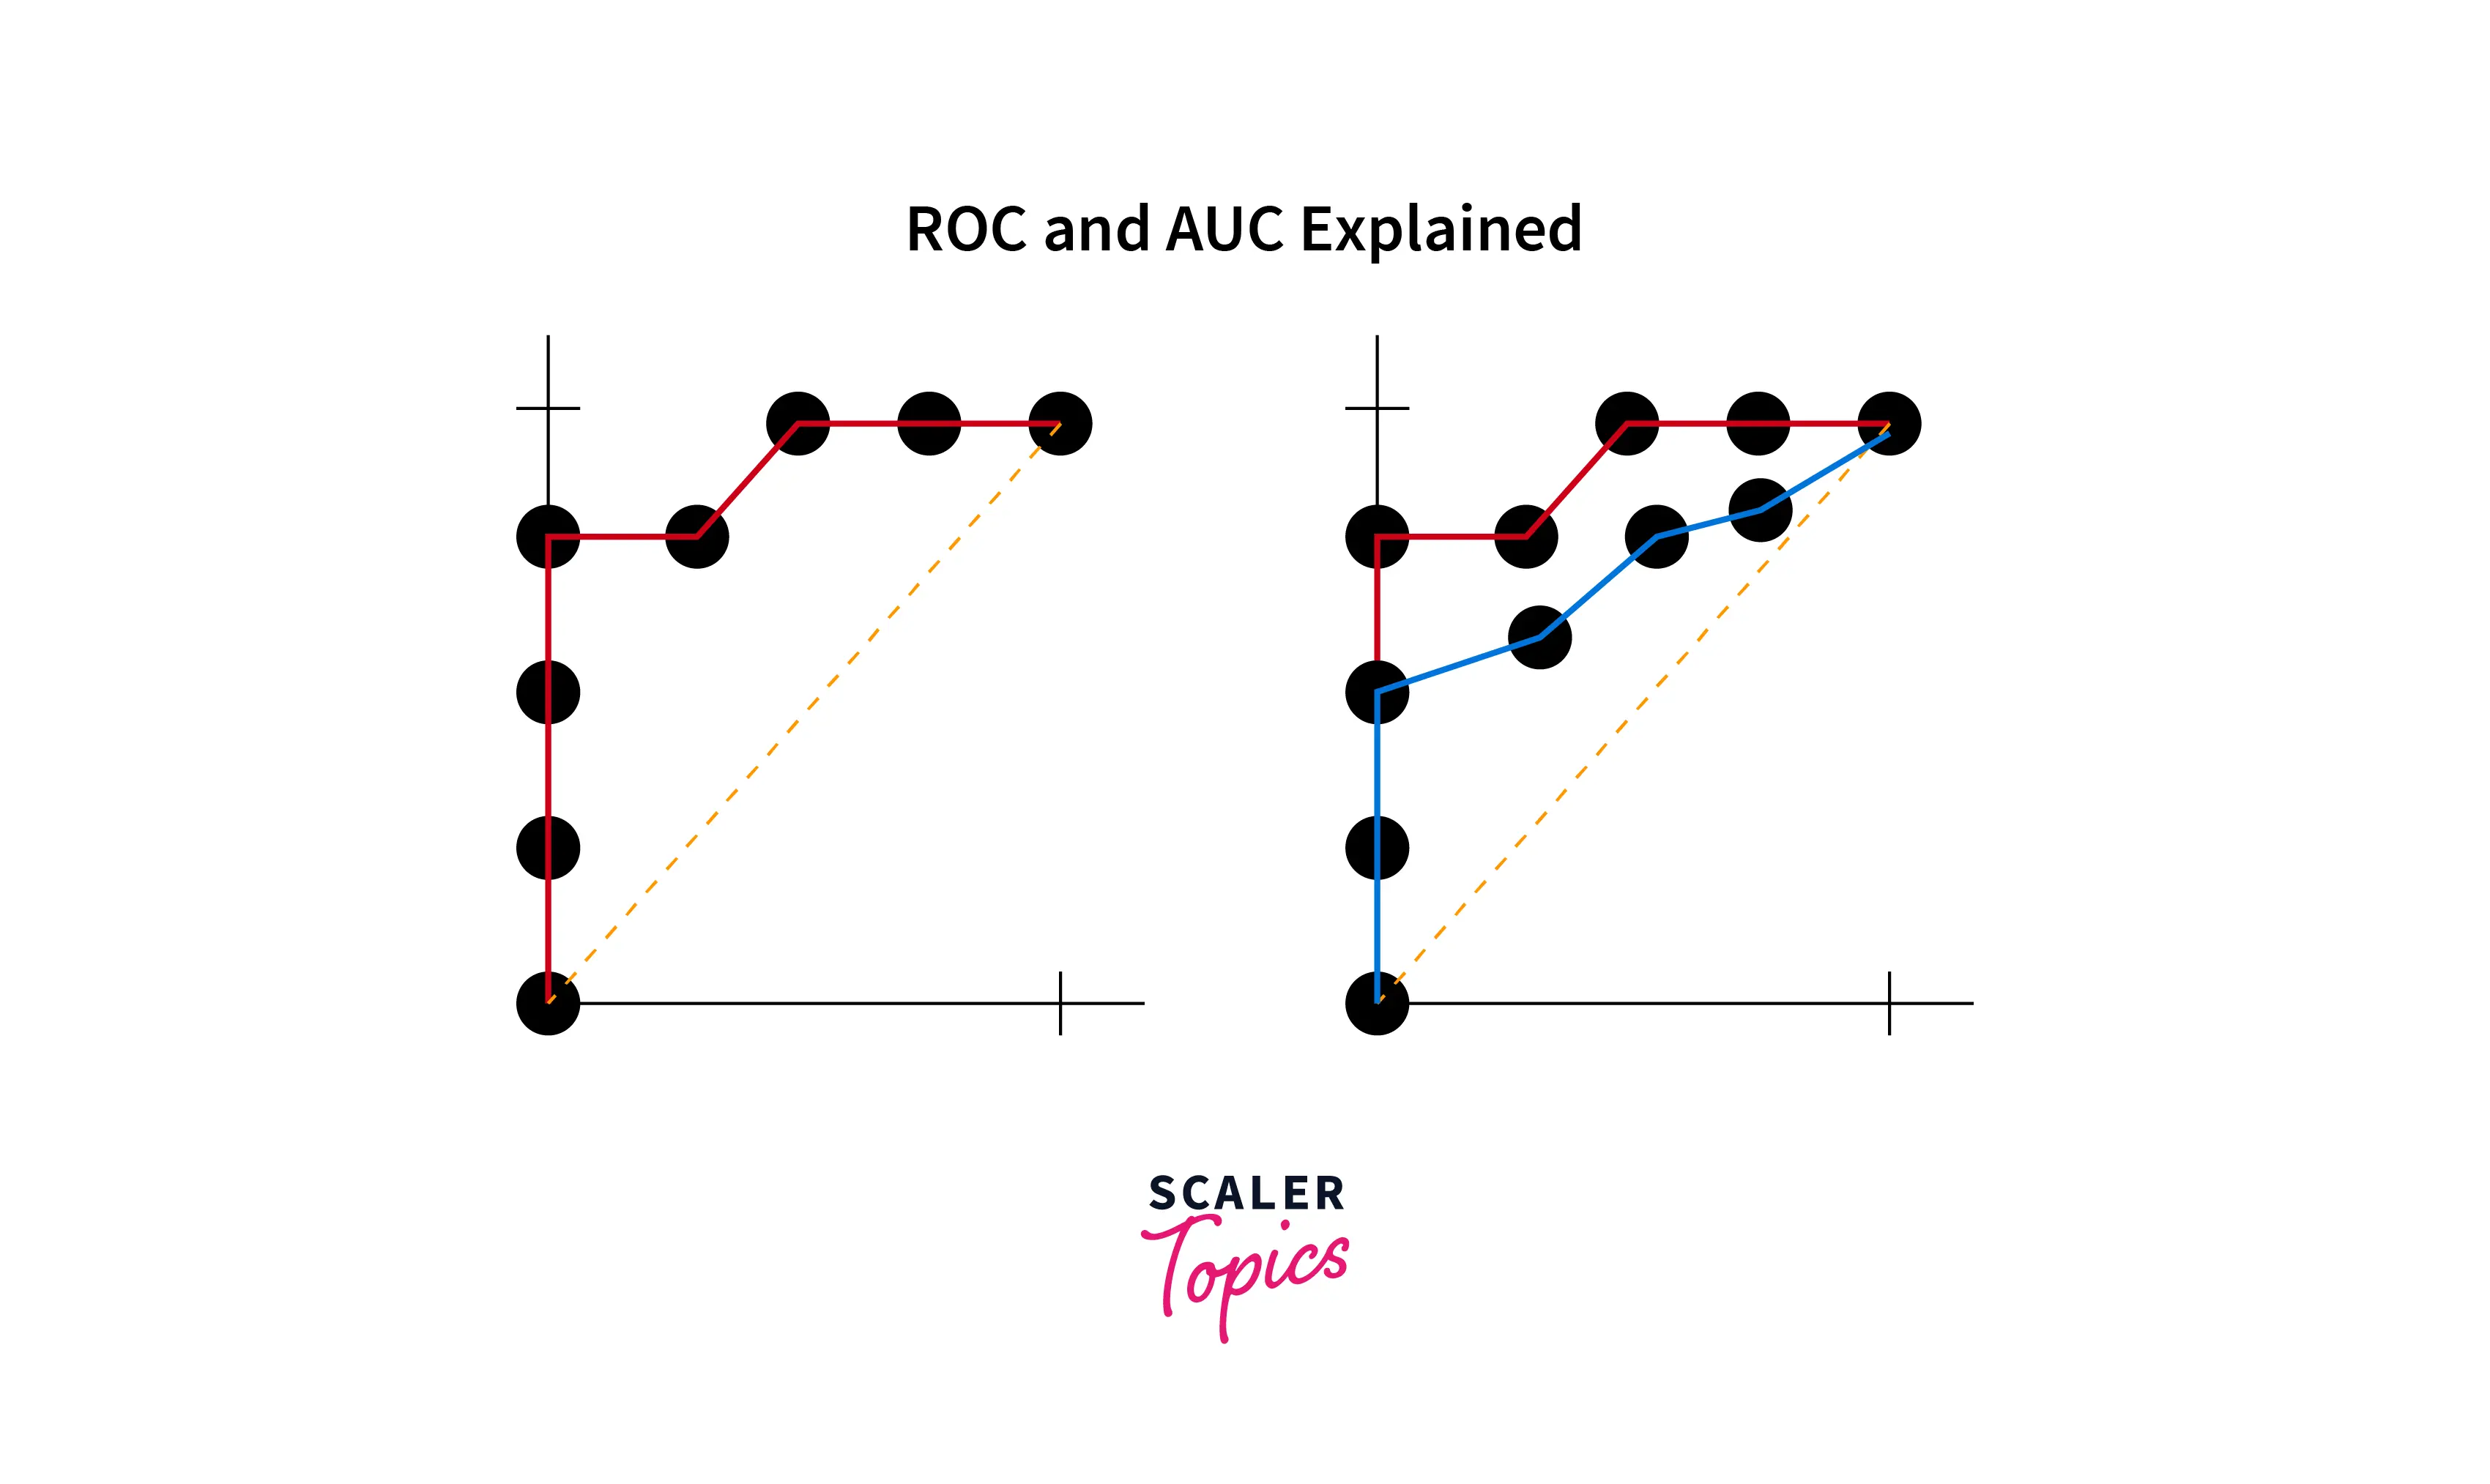
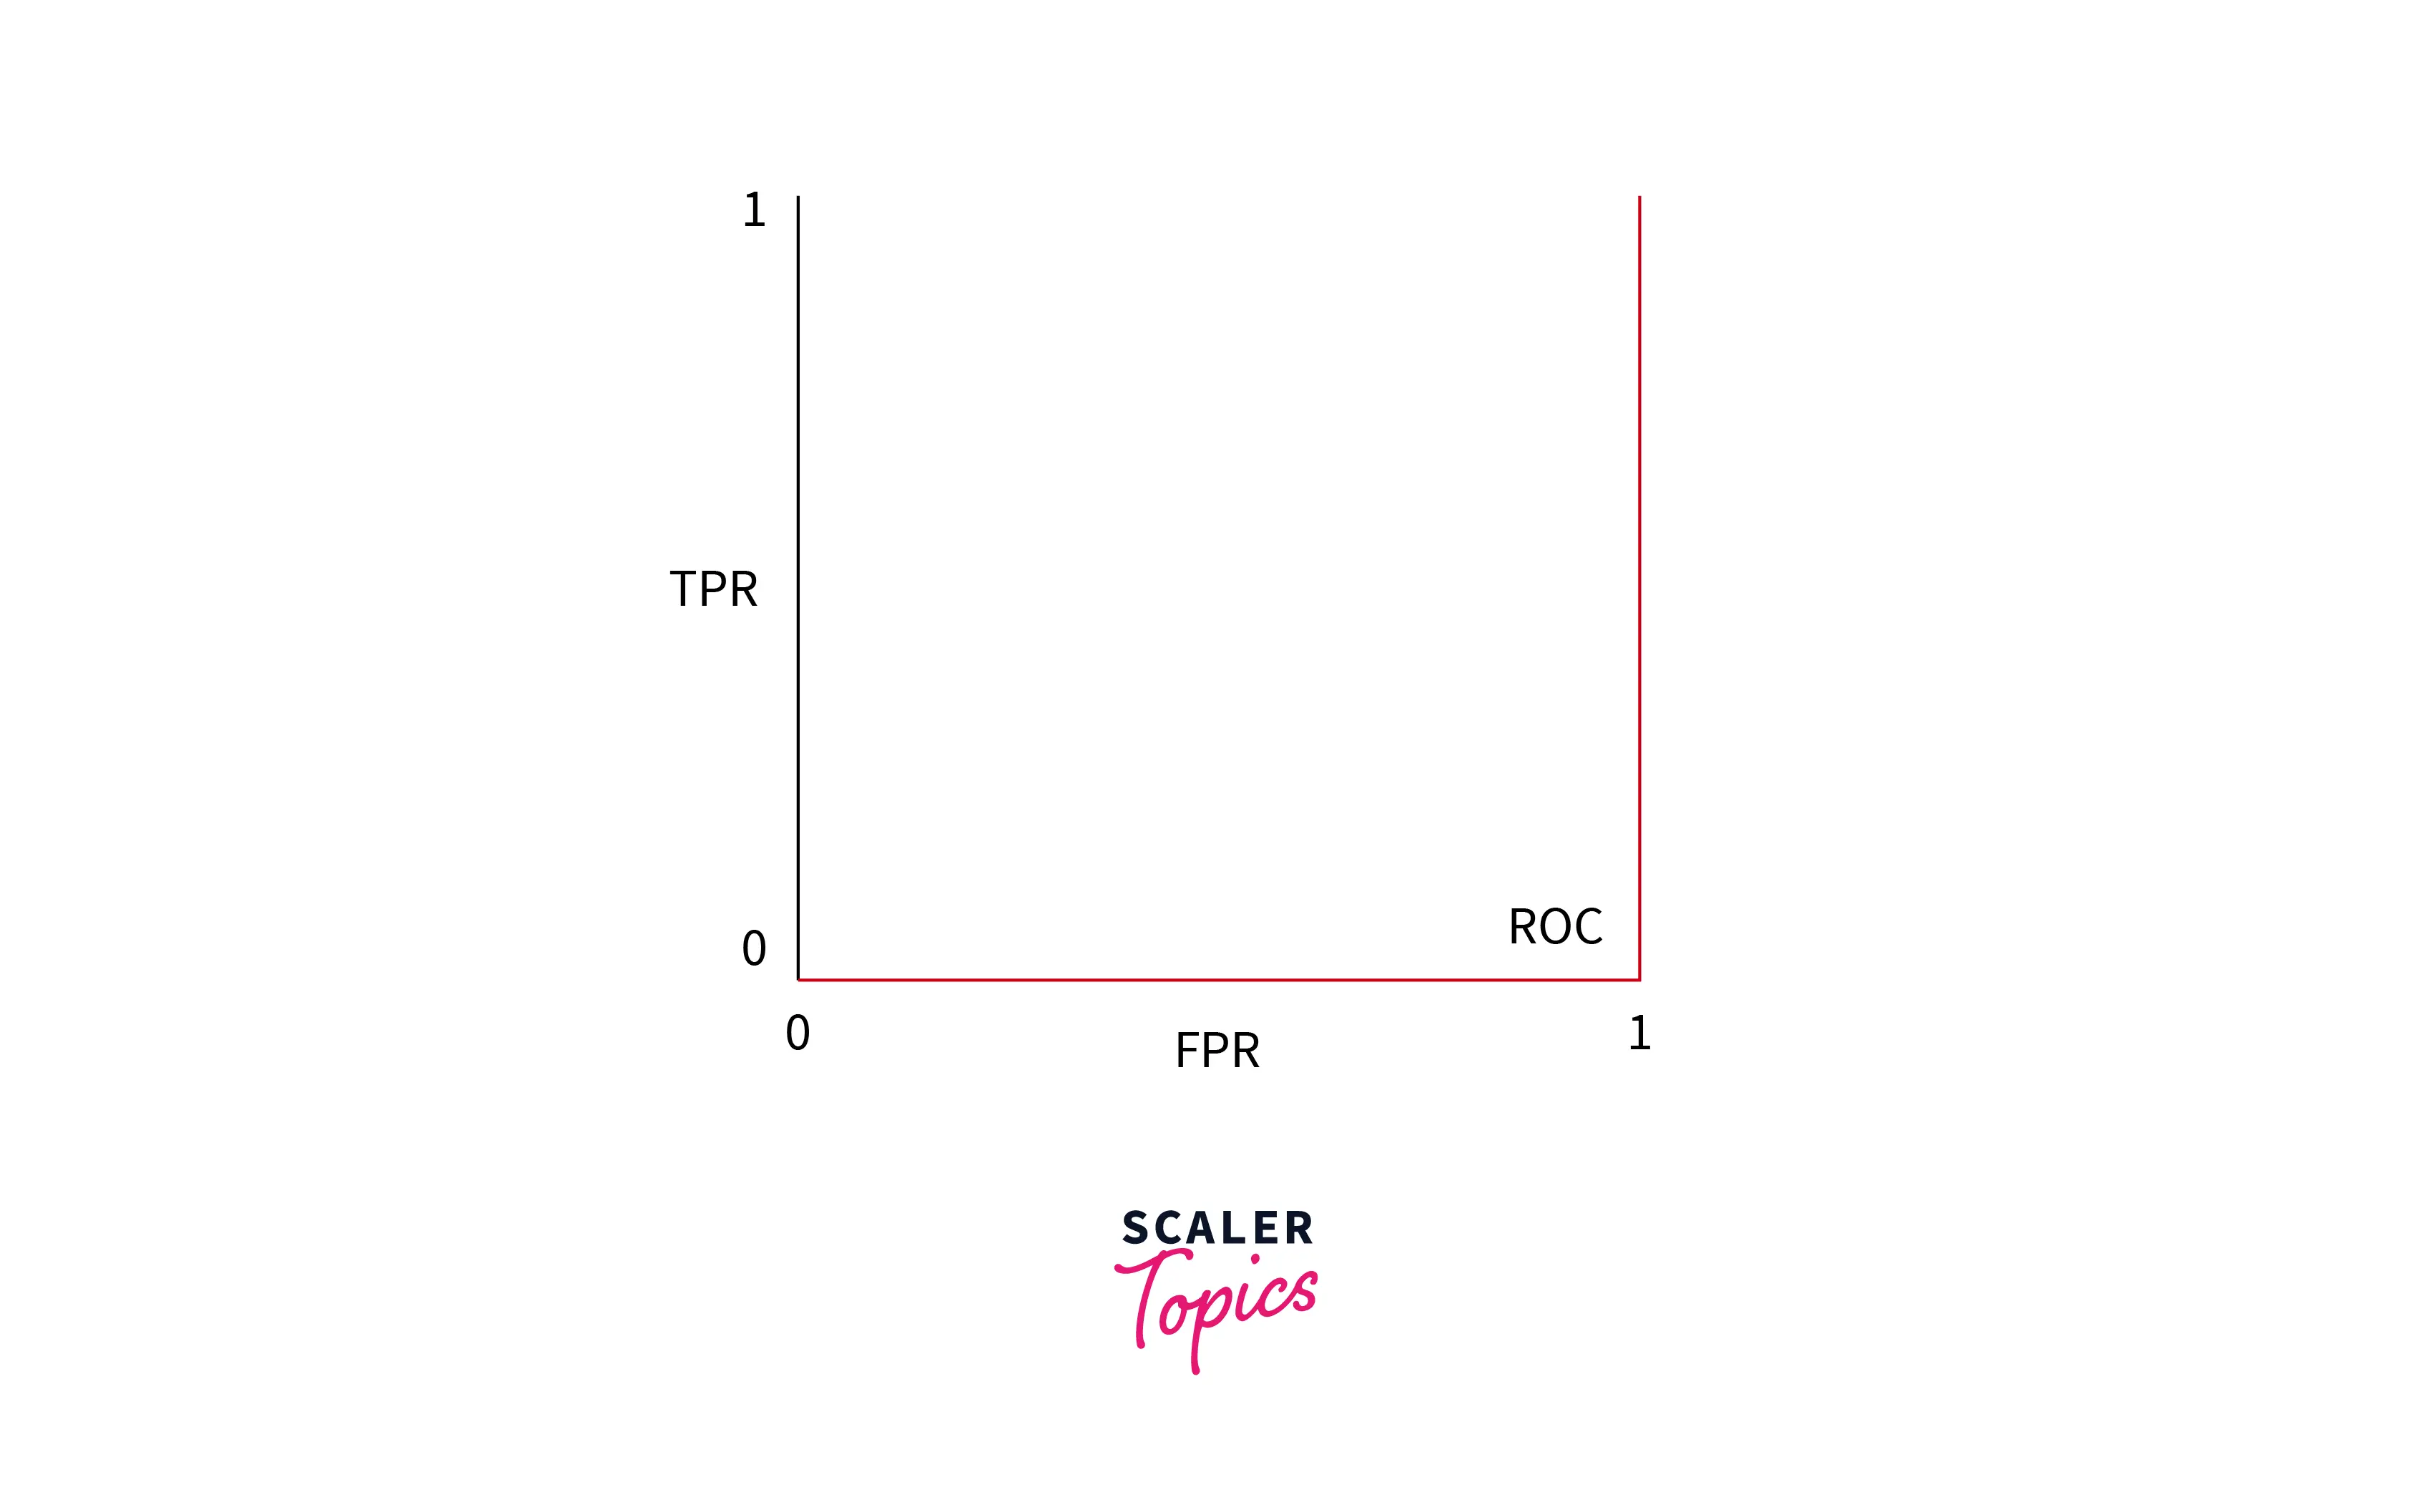
In the above image, the first image shows ROC, and the second one is AUROC.


What is the AUC - ROC Curve?
Now that we know what ROC is let us understand AUC - Area Under ROC Curve.
The integral measure of the ROC curve is AUROC, where the two axes represent a model's True Positive vs. False Positive rate.
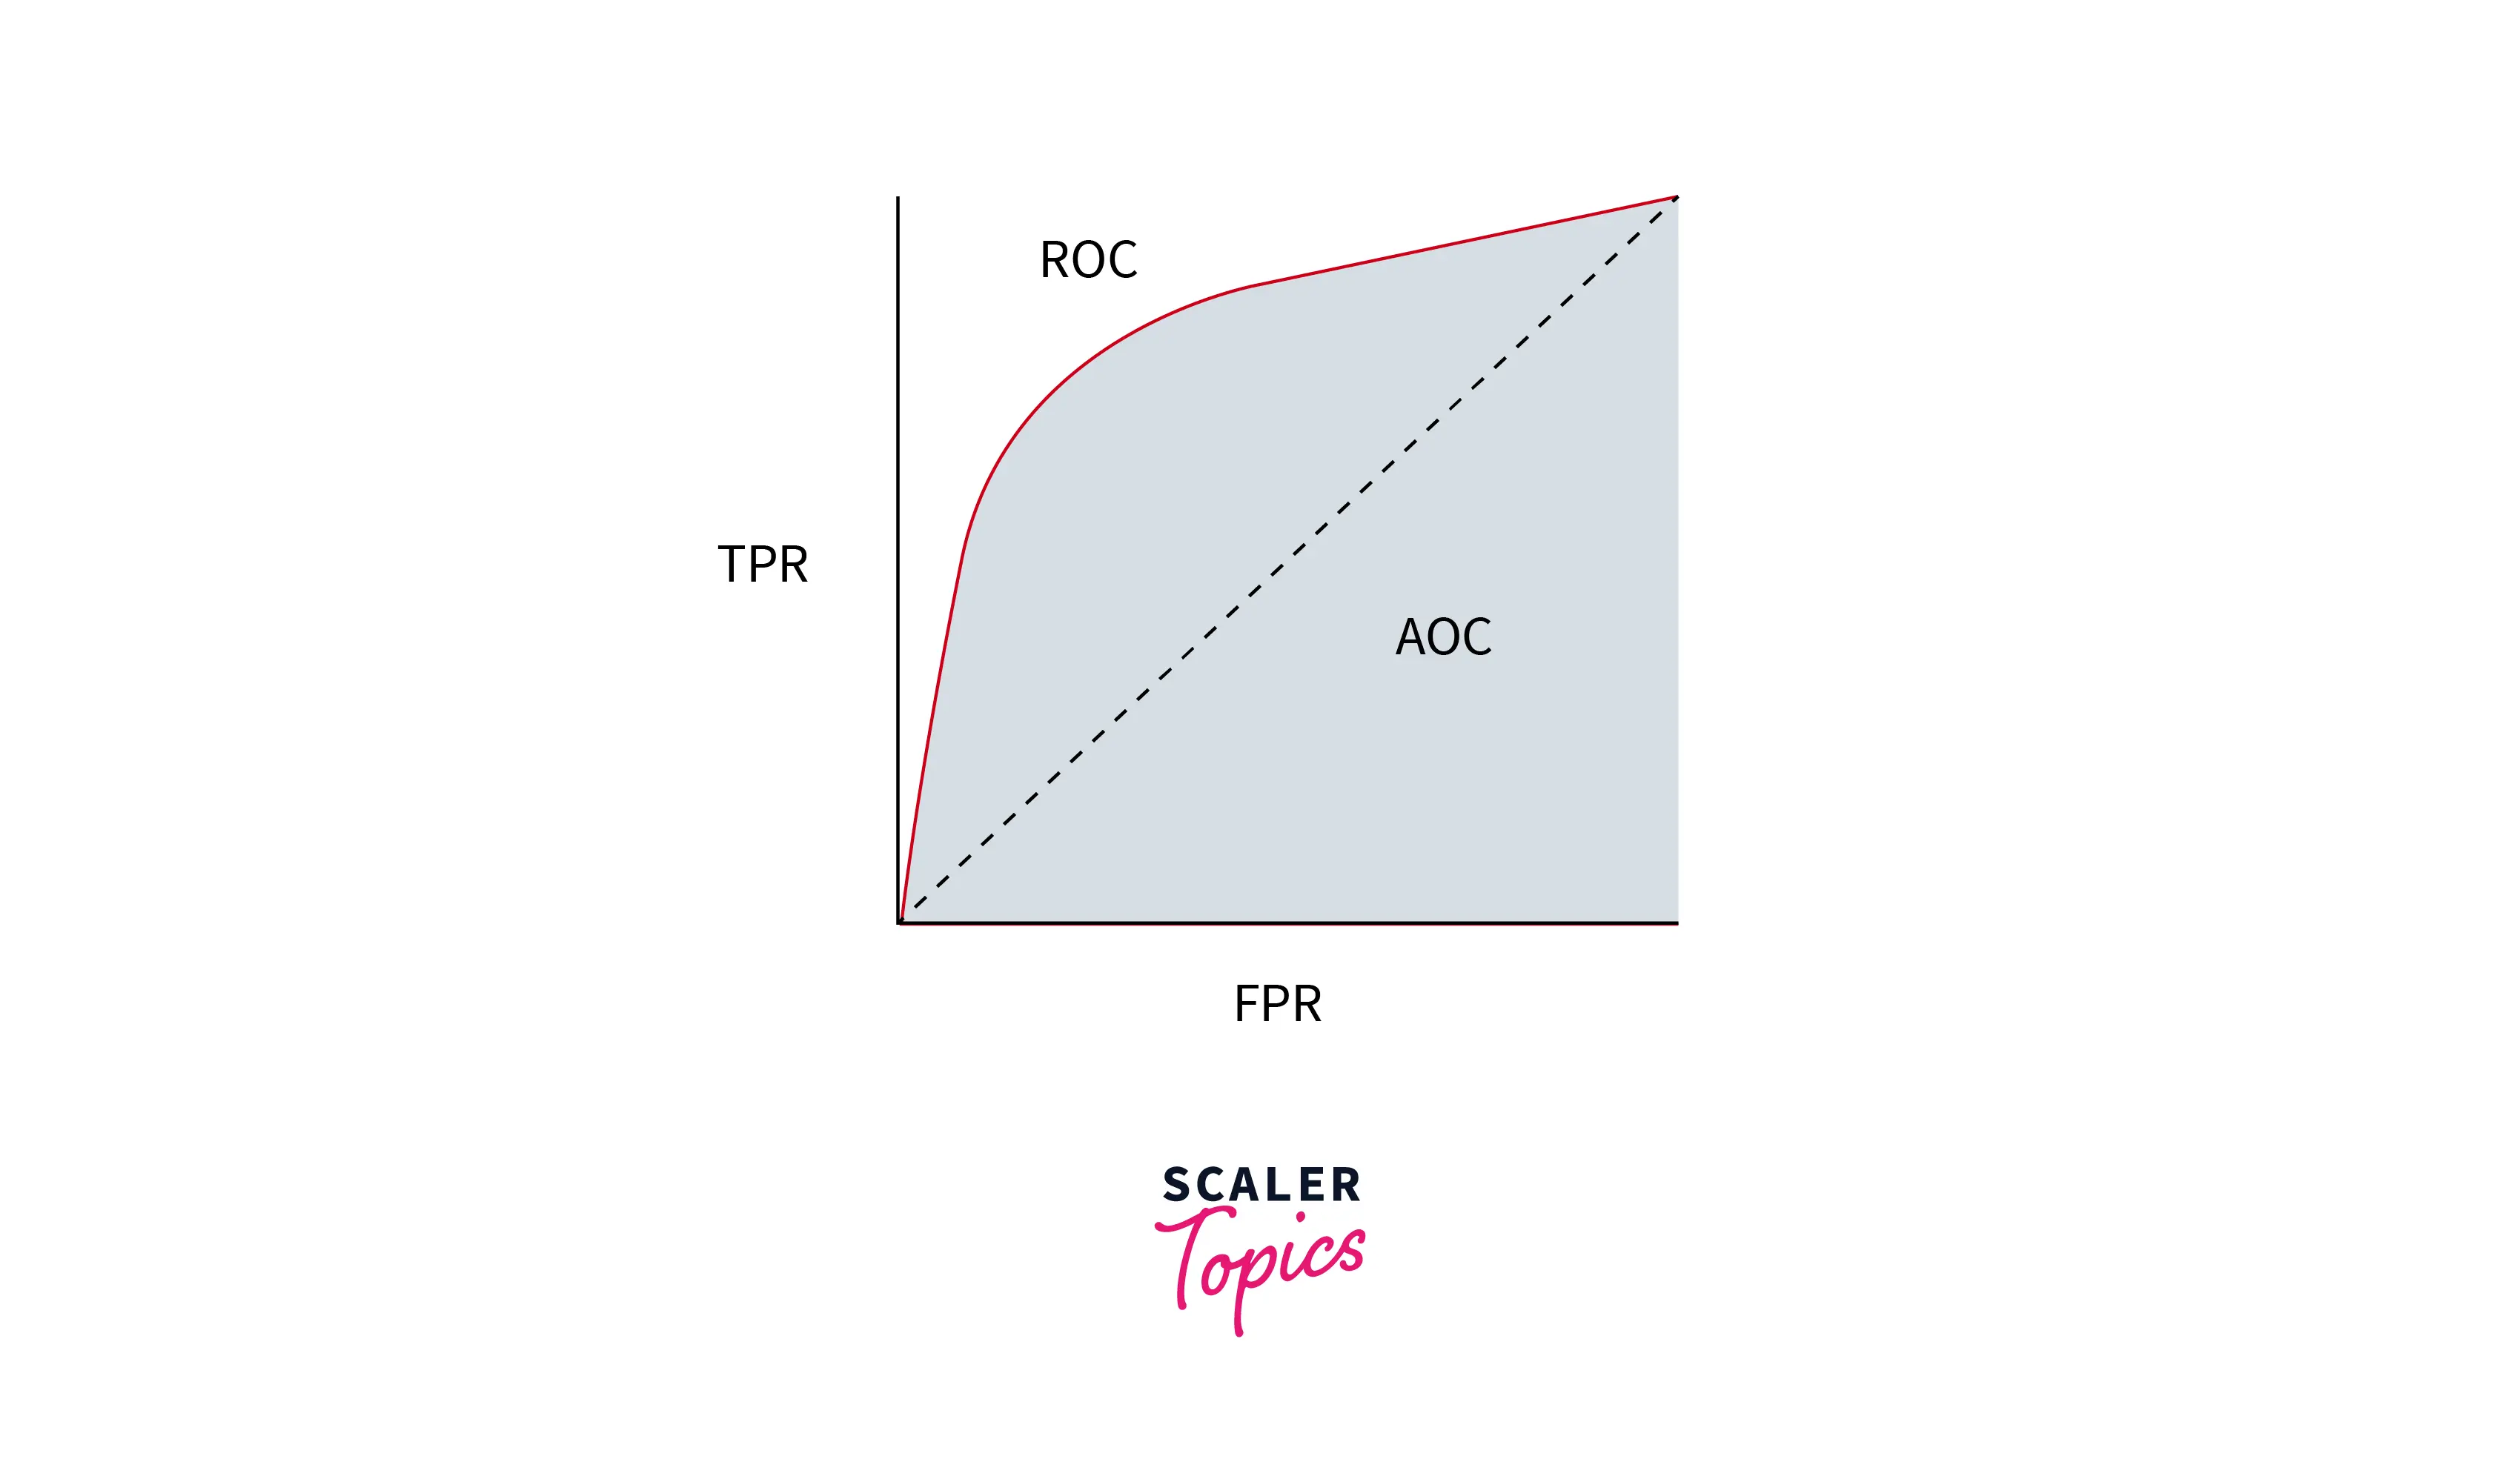
True Positive Rate and False positive Rate are measured as below -
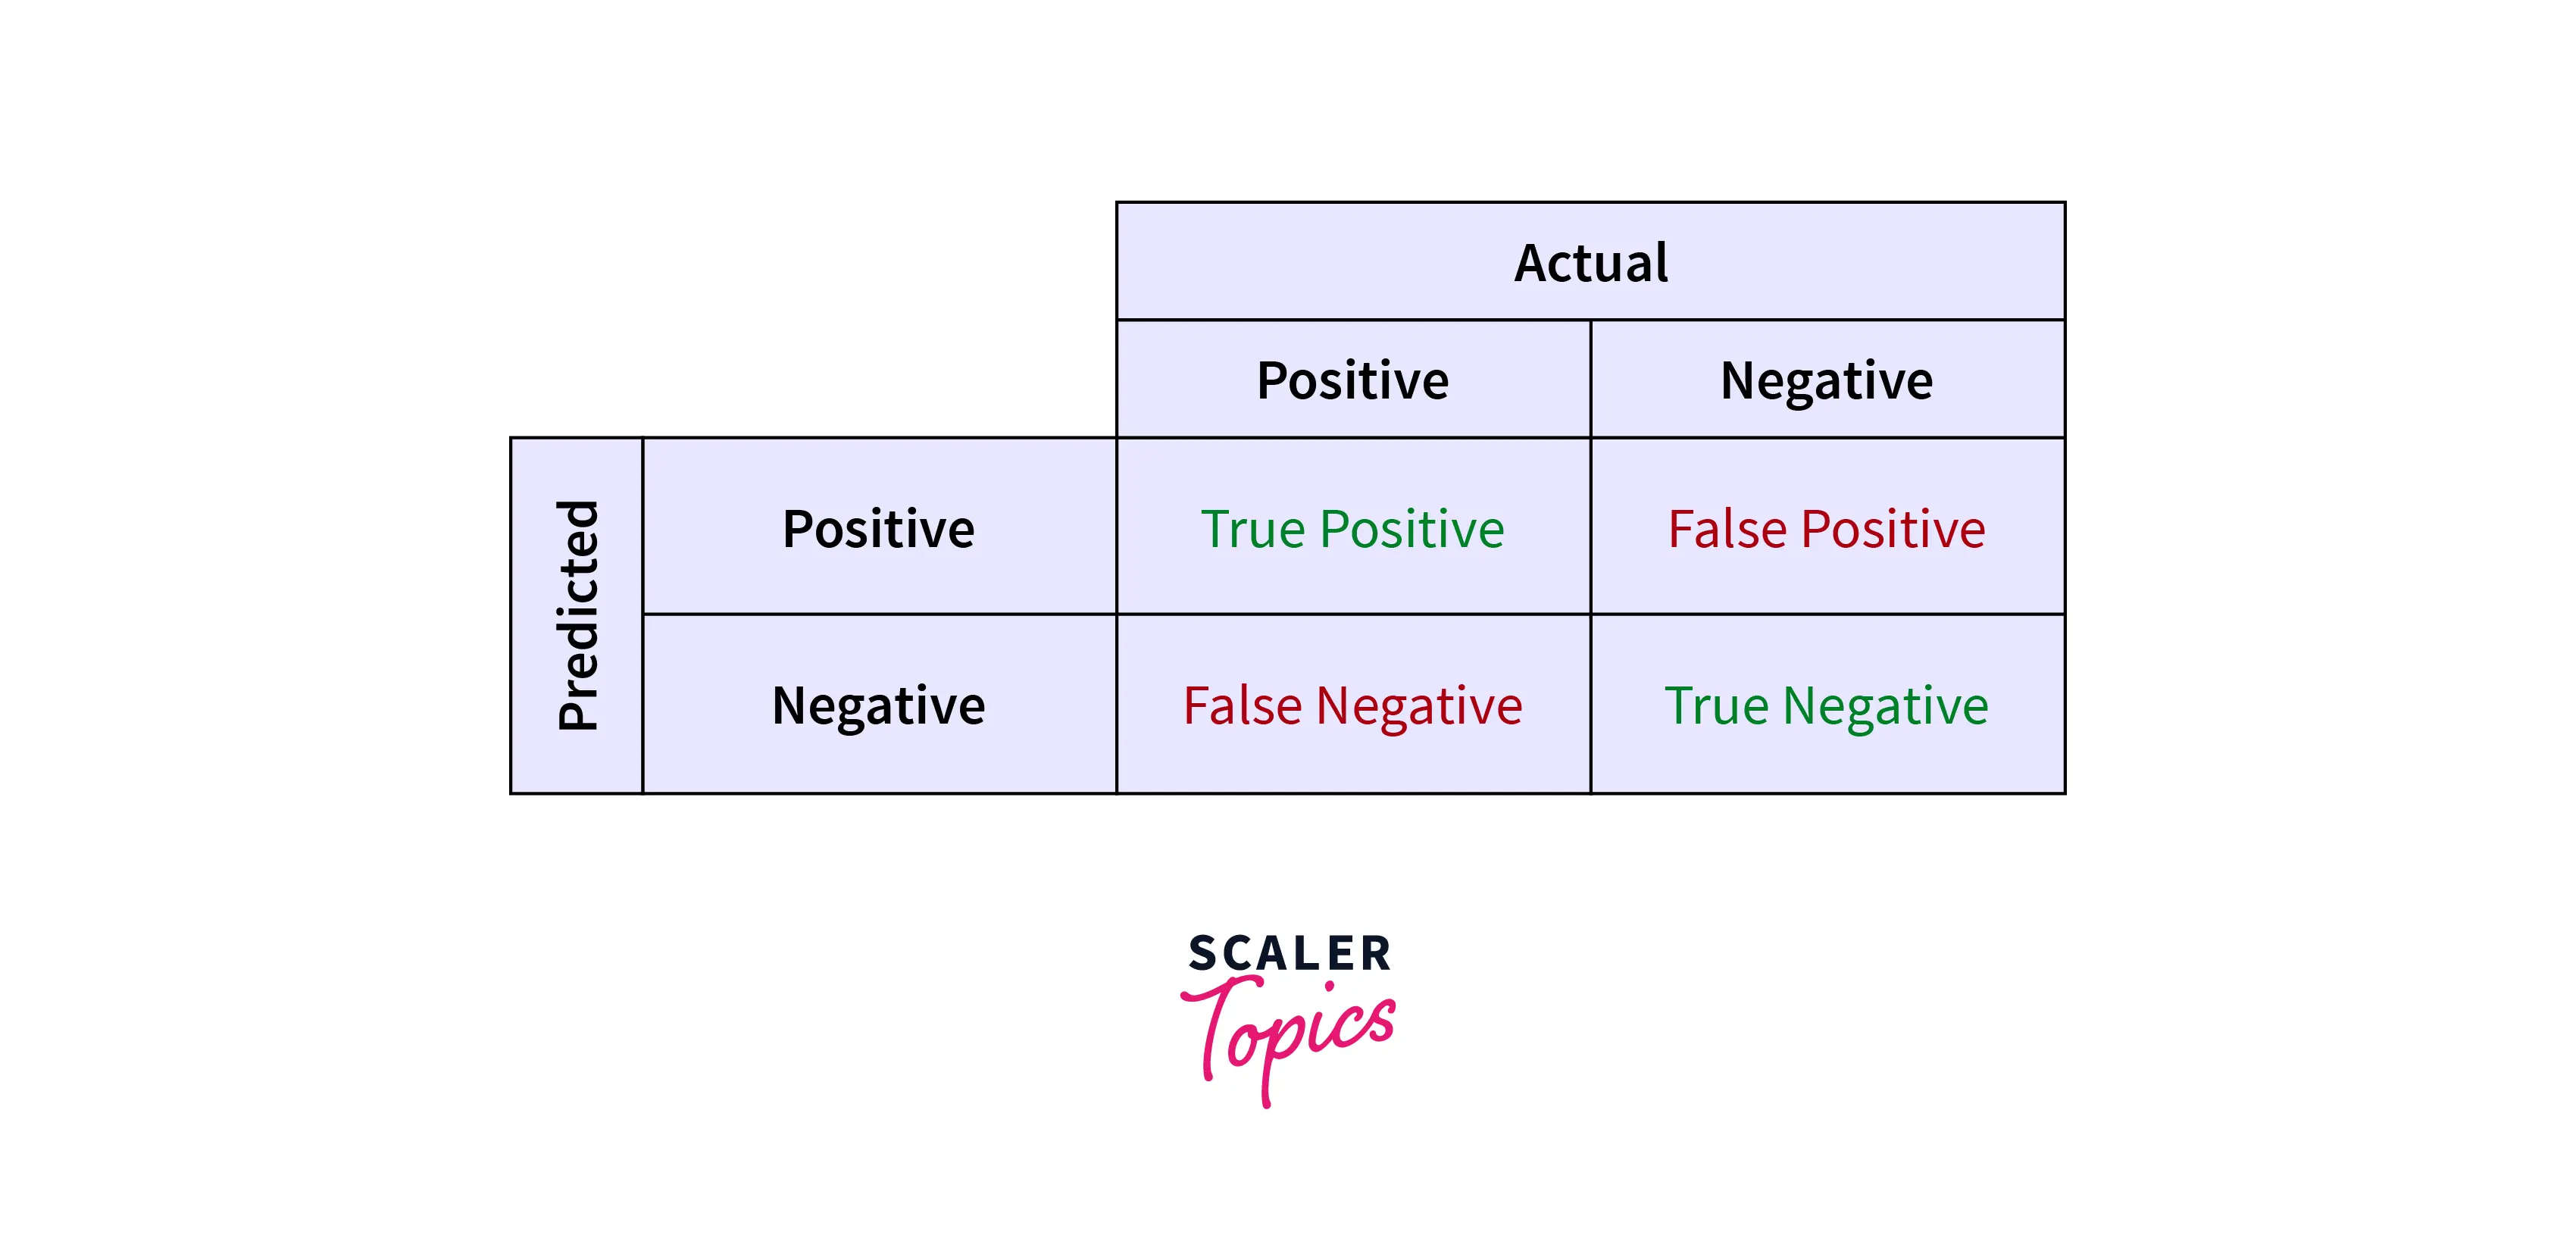
Where,
TP = True Positive - When the model accurately predicts positive
FN = False Negative - When the model predicts negative, but it is positive
FP = False Positive - When the model predicts positive, but it is negative
TN = True Negative - When the model accurately predicts negative
Scaler Placement Report and Statistics
Scaler learners achieved 2.5x salary growth with average post-Scaler CTC reaching ₹23L.
Defining Terms Used in AUC and ROC Curve
Some terms used in AUROC are listed below -
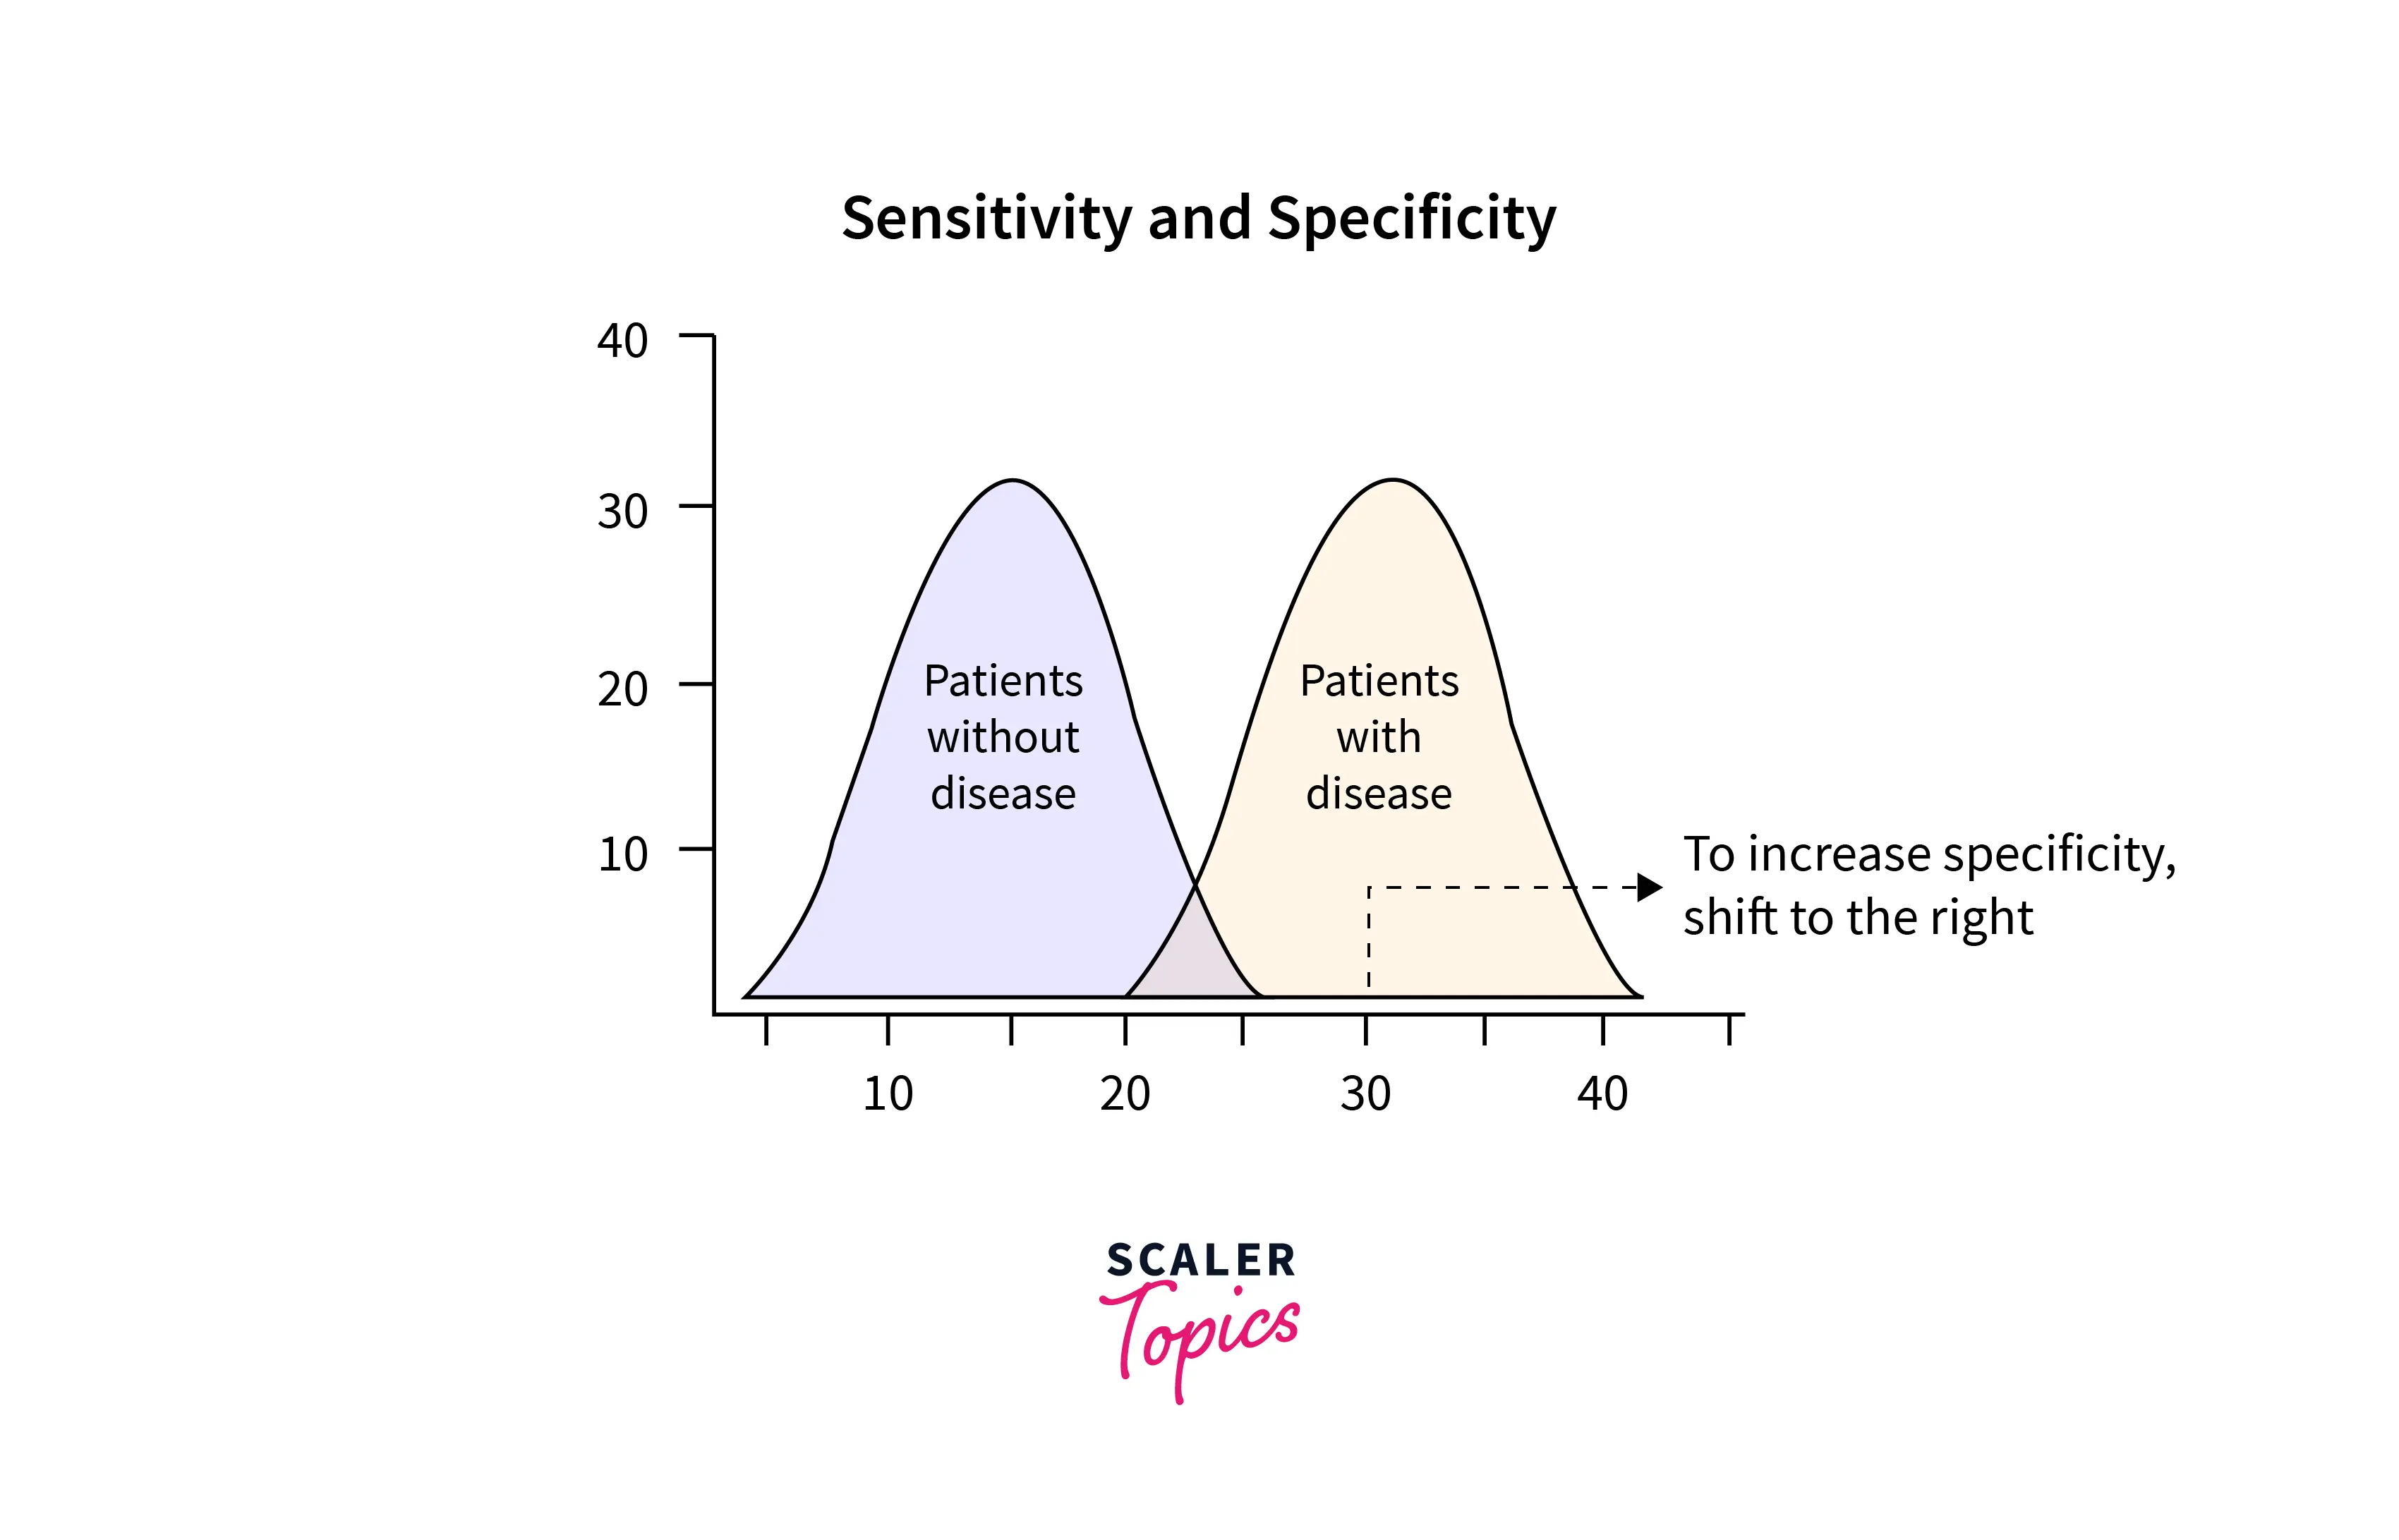
- Sensitivity - Sensitivity is the same as Recall or True Positive Rate. It is the accurately judged positive results. For example, while classifying a dog or a cat, if a cat is correctly identified cat, it is the sensitivity.
- Specificity - Specificity is the True negative rate. It is the measure of correctly identified negative results. For example, considering the same classification, if a dog is identified as not a cat, it is the specificity.
- Threshold - The most optimal and balanced point on the ROC Curve to locate the true positive and true negative.
The above two terms are used widely to evaluate a model.
How to Speculate the Performance of A Model?
Let us first try to understand the performance of a model using graphs.
Note: Since AUROC is a probabilistic measure, we plot this from a scale of 0 to 1.
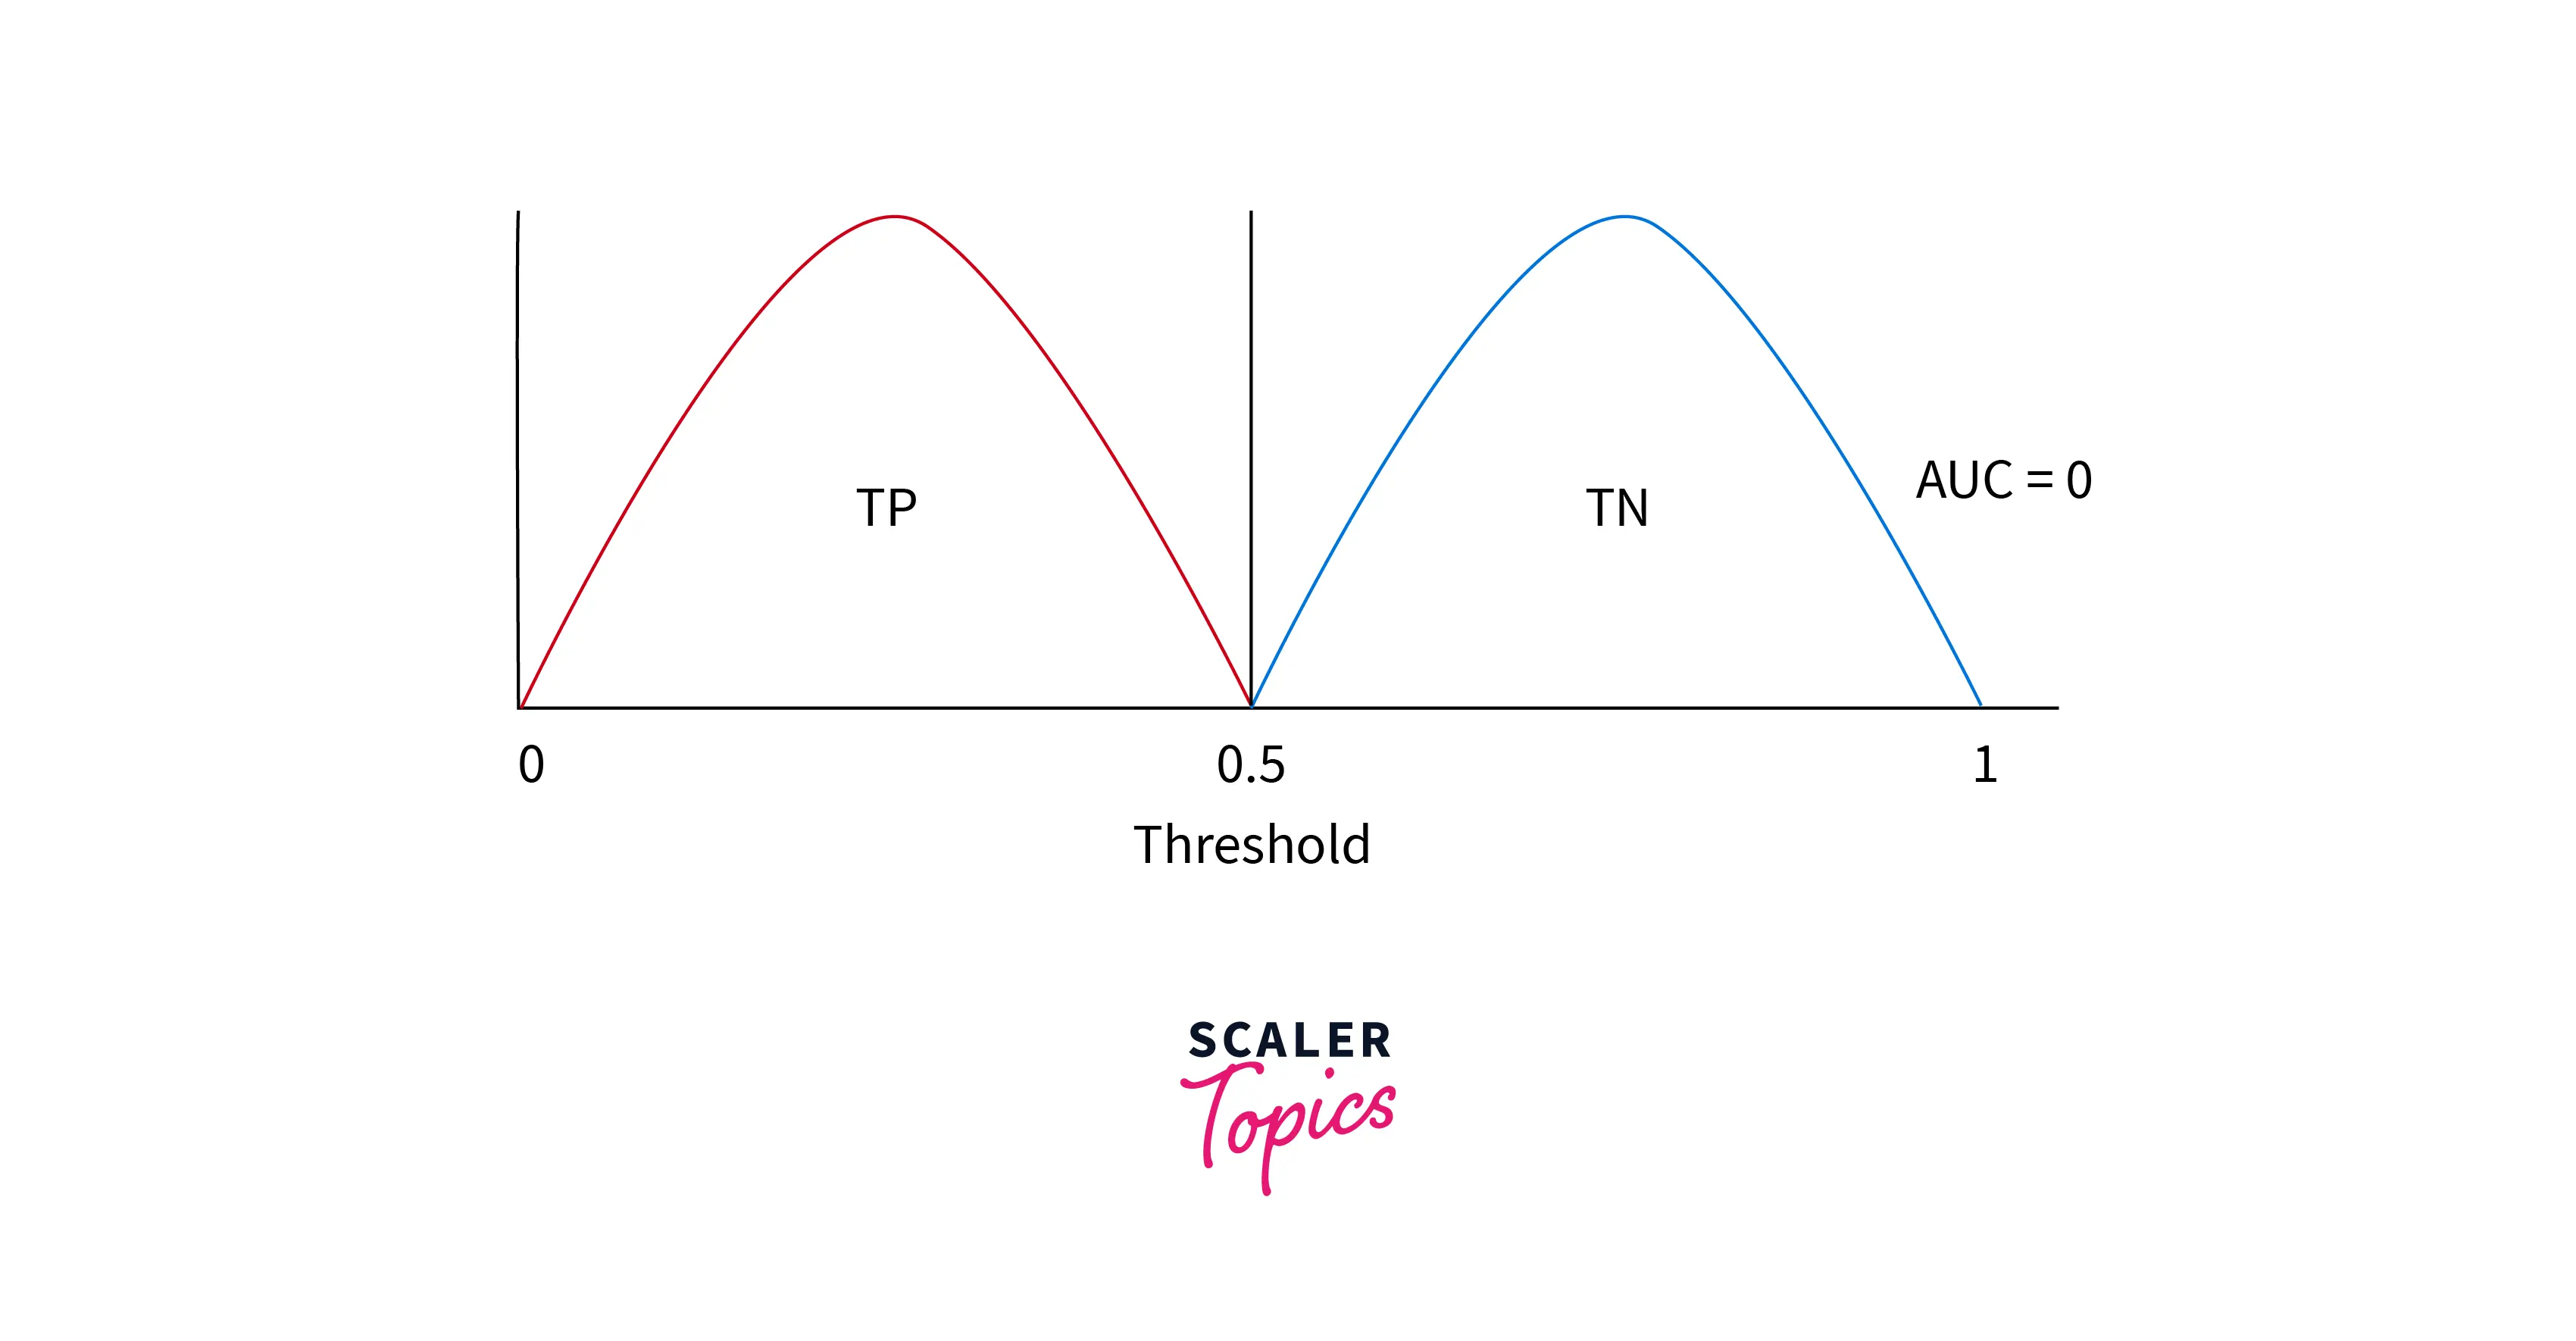
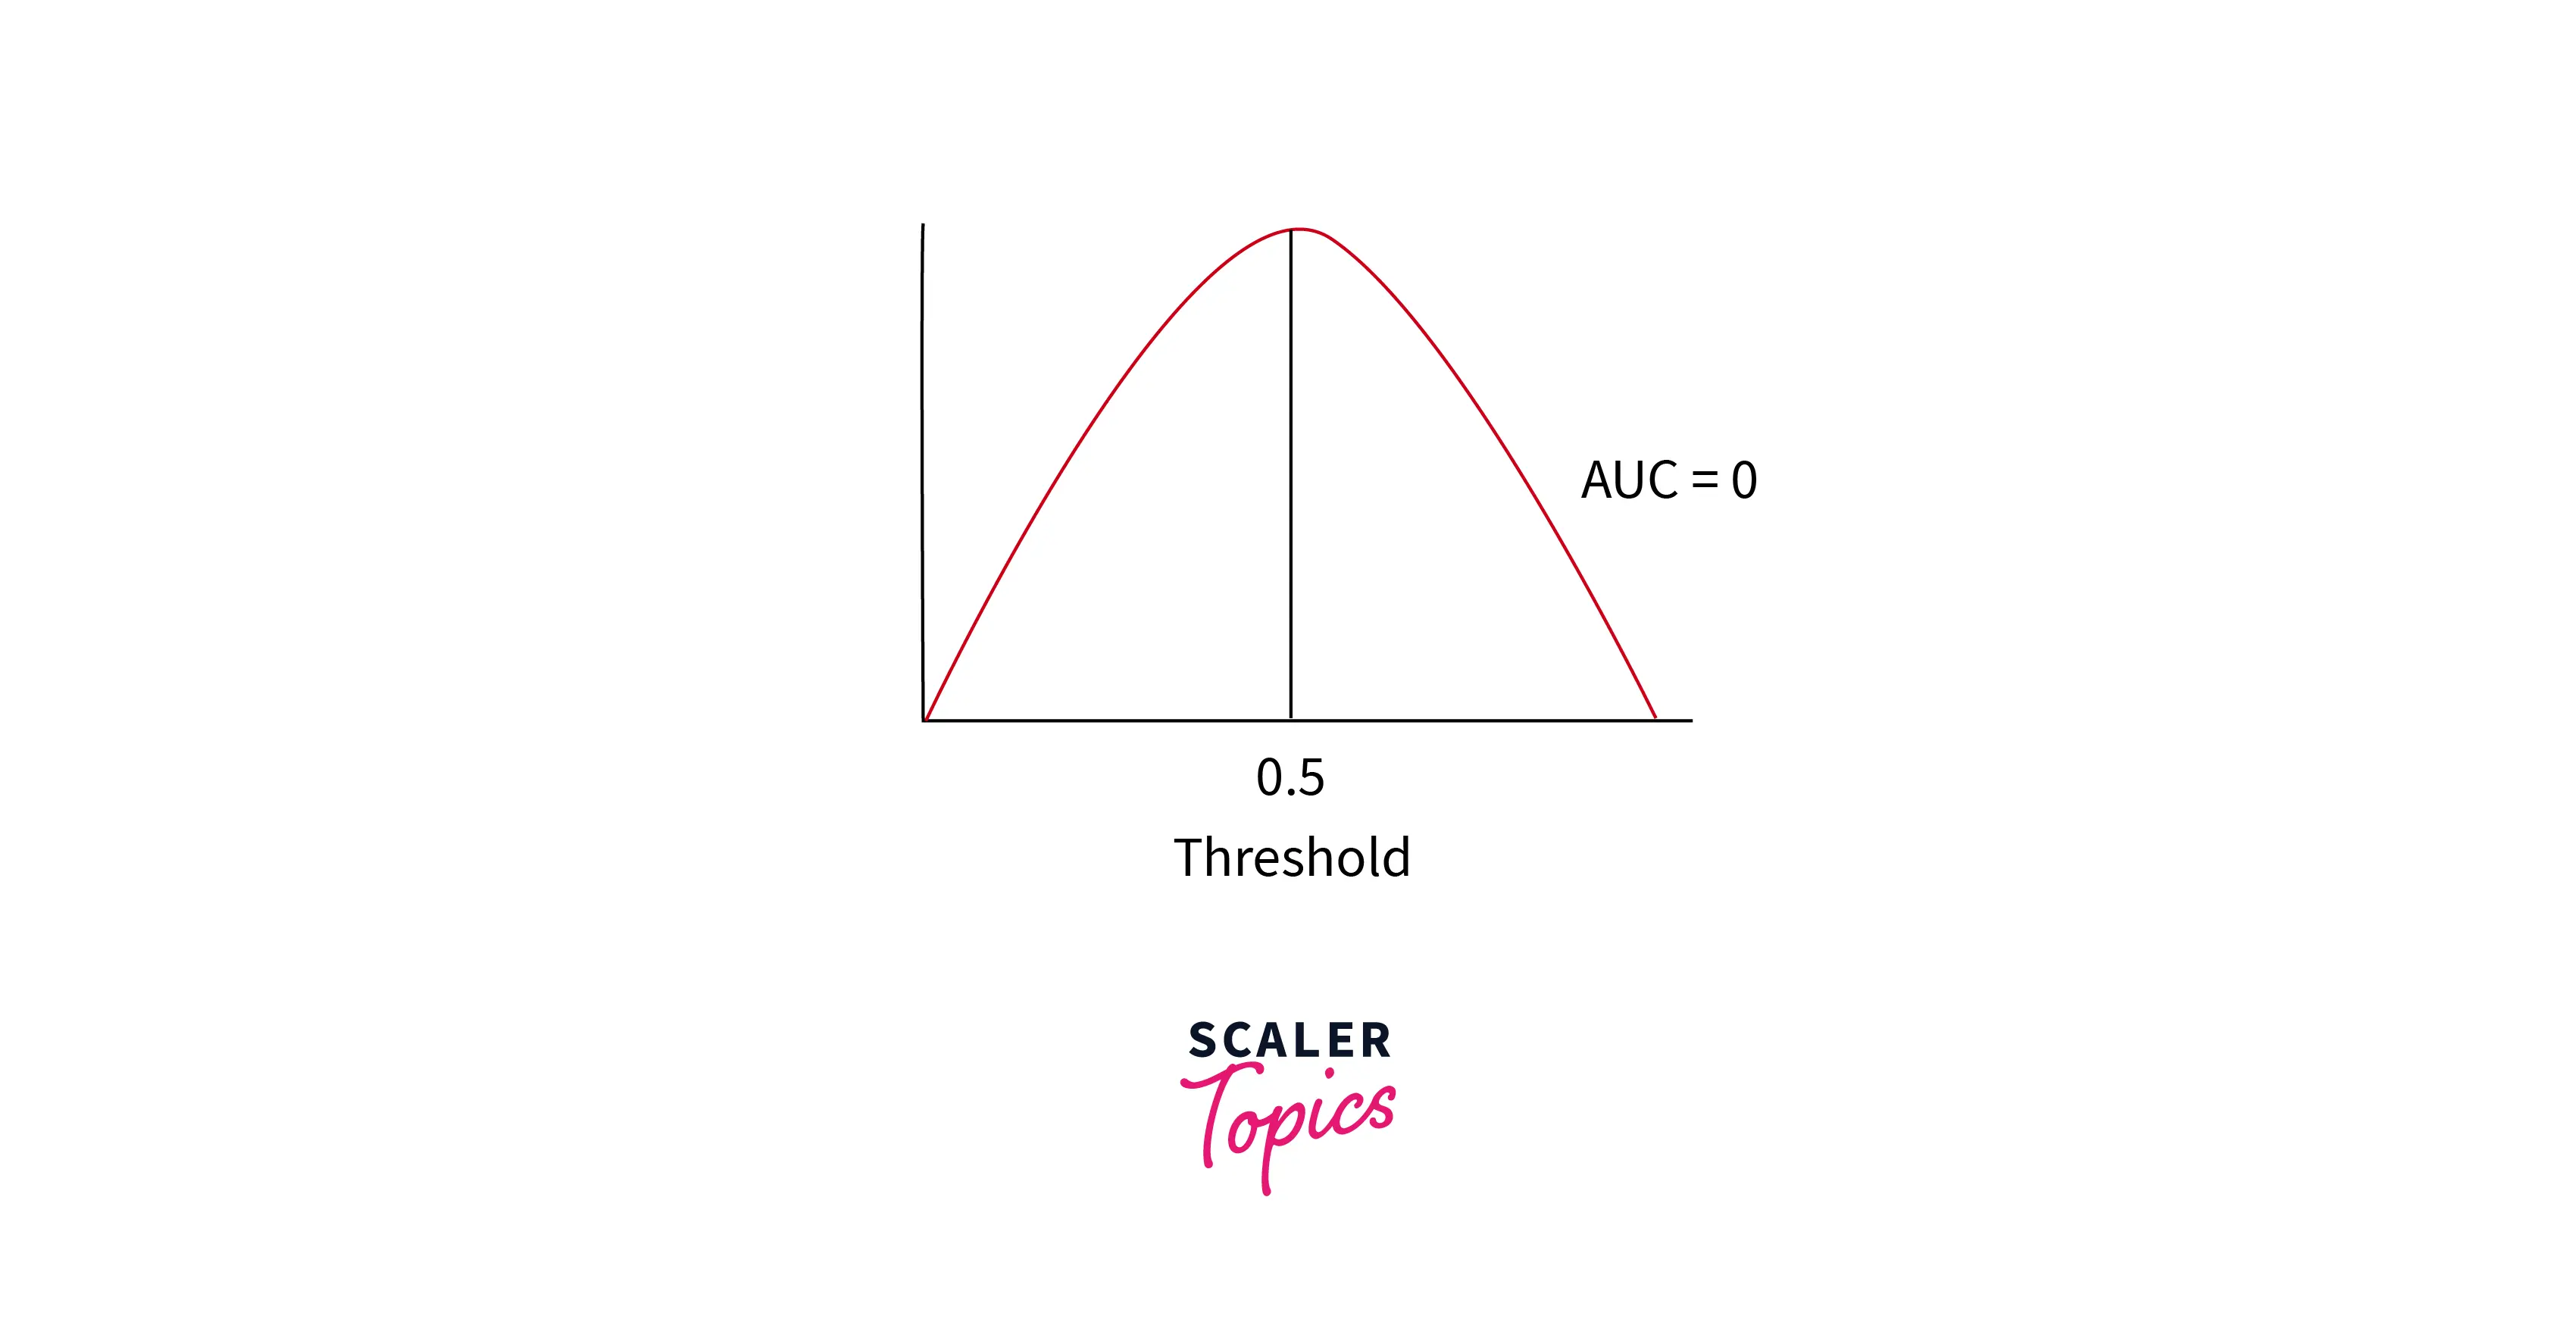
Case 1 : AUC = 0
When the area under the ROC curve is 0, the values required are inverted. Positives are depicted as unfavorable, and negatives are depicted as positives.
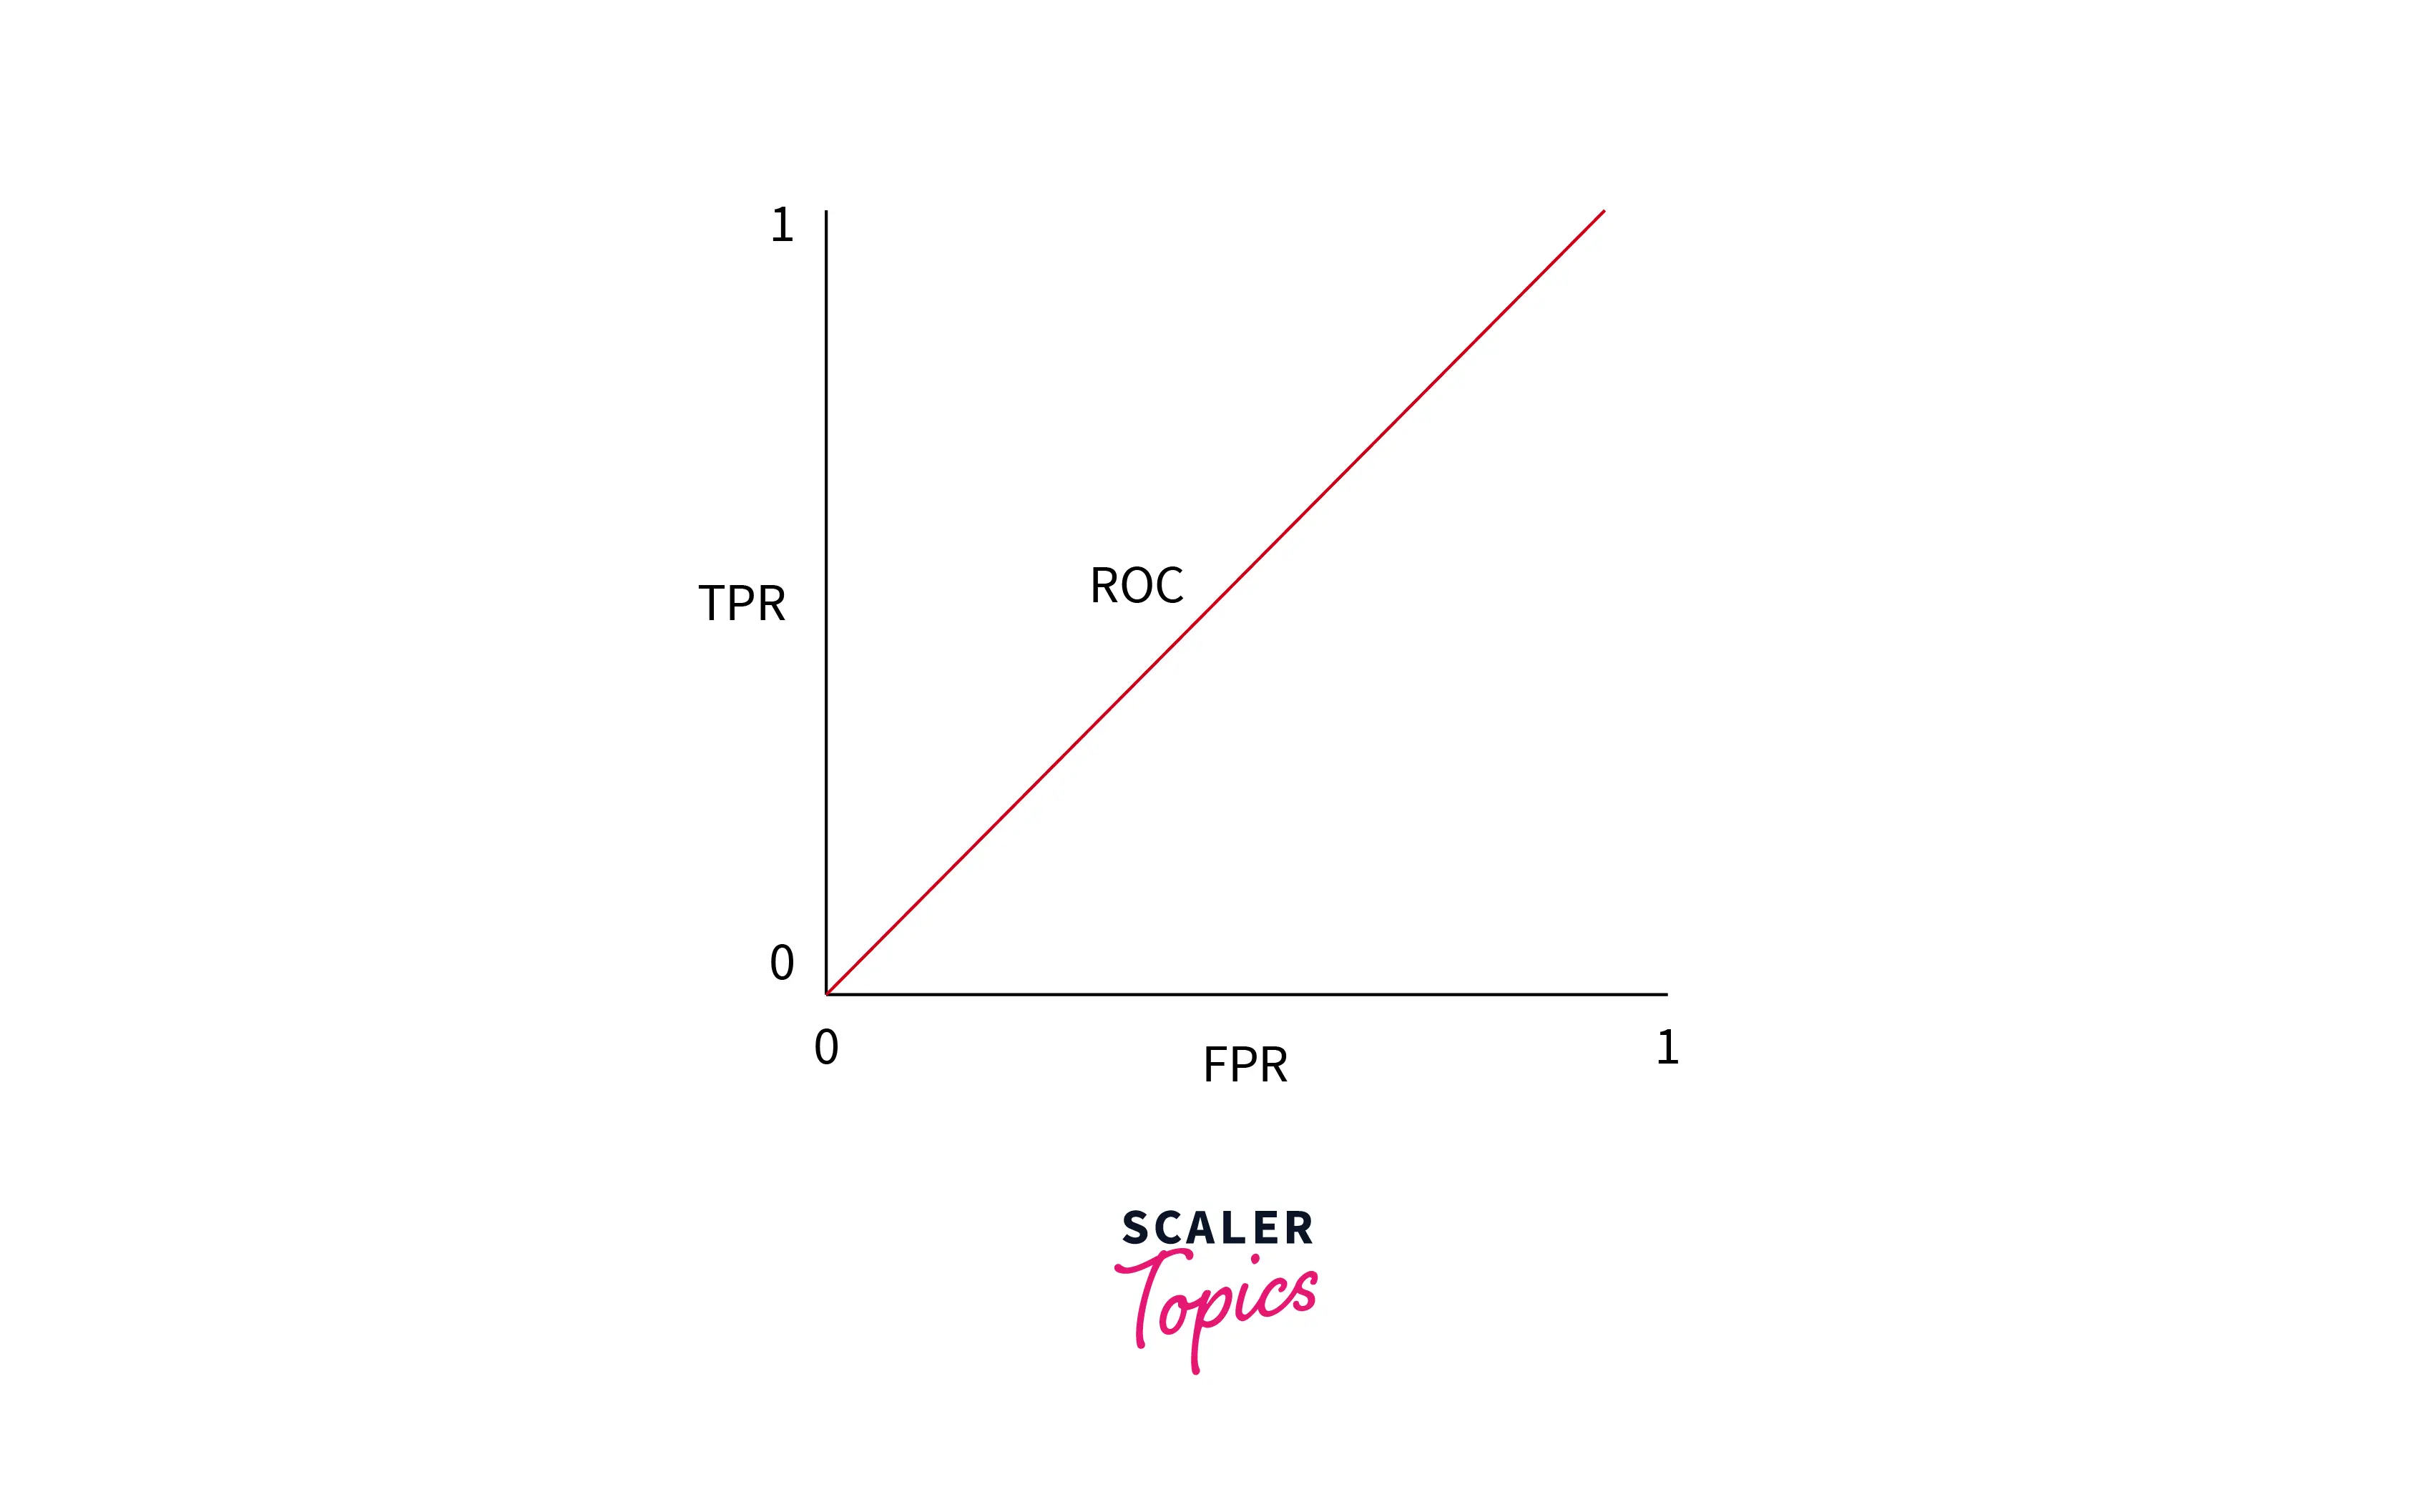
Case 2 : AUC ~ 0.5
In this scenario, the graph is that of a constantly increasing line. This means that the model cannot decide between positives and negatives.
With AUC of around 0.5, it can be considered the worst-case situation.
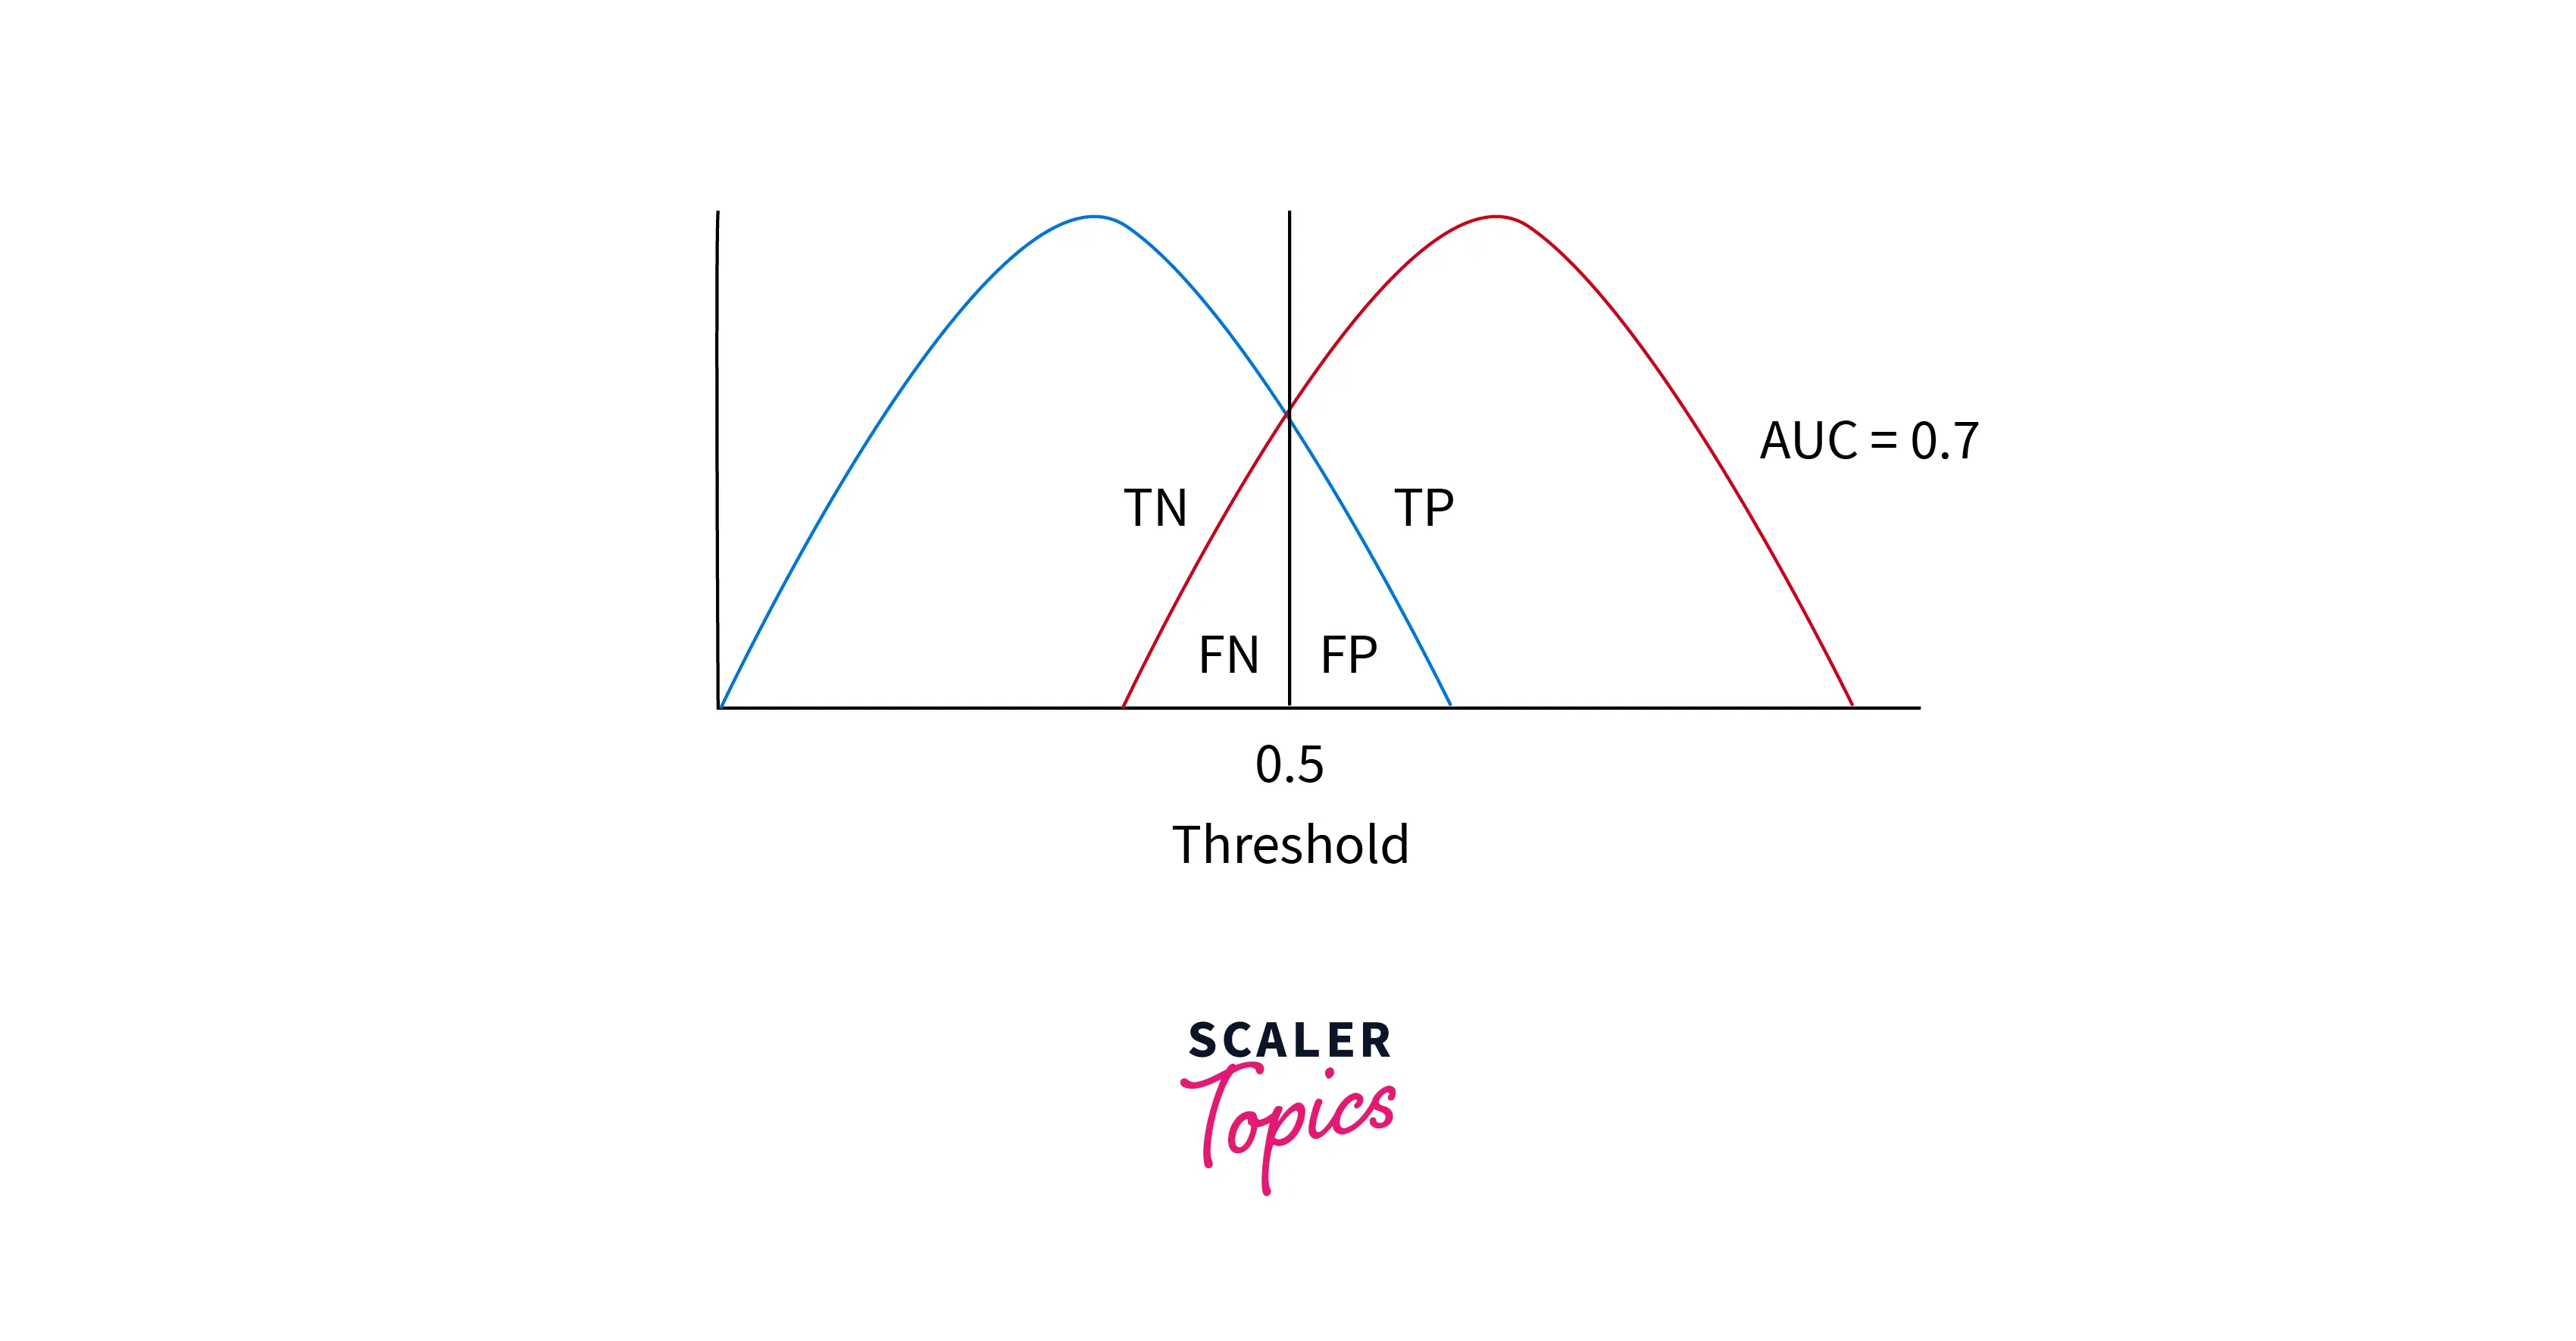
Case 3 : AUC = 0.7
Here, the model has a 70% chance of accurately getting the positives and negatives. This is a good enough result, if not perfect.
Adjusting the values of the Threshold helps get more accuracy.
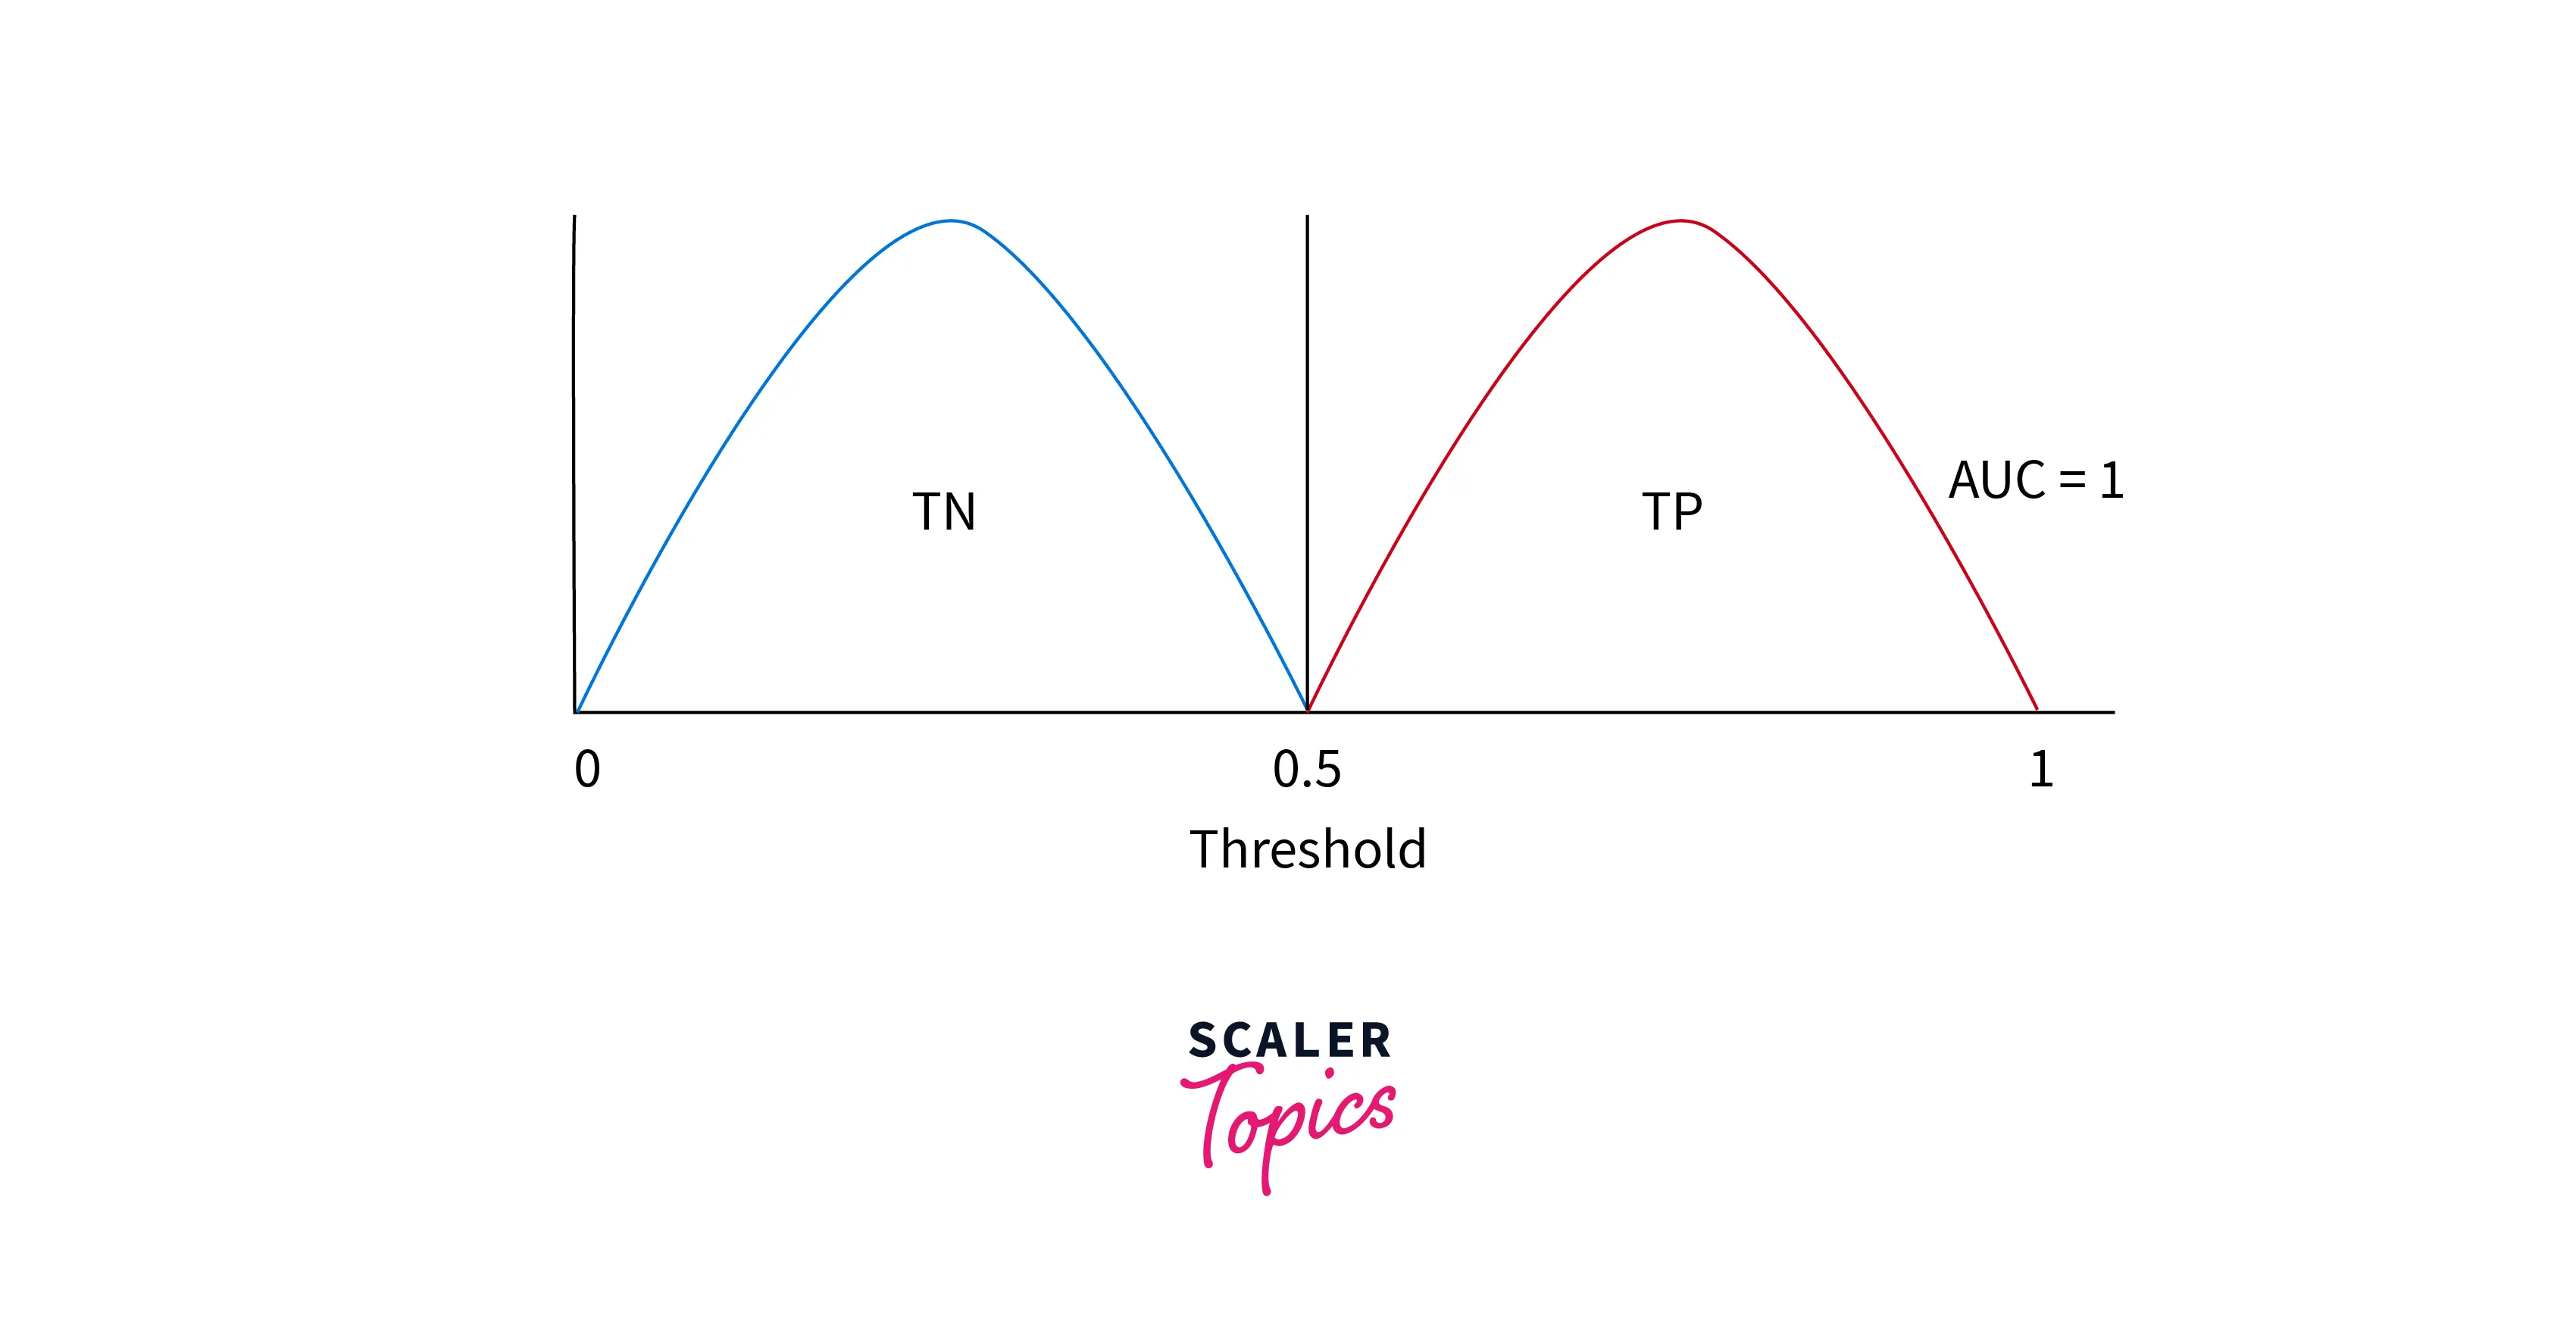
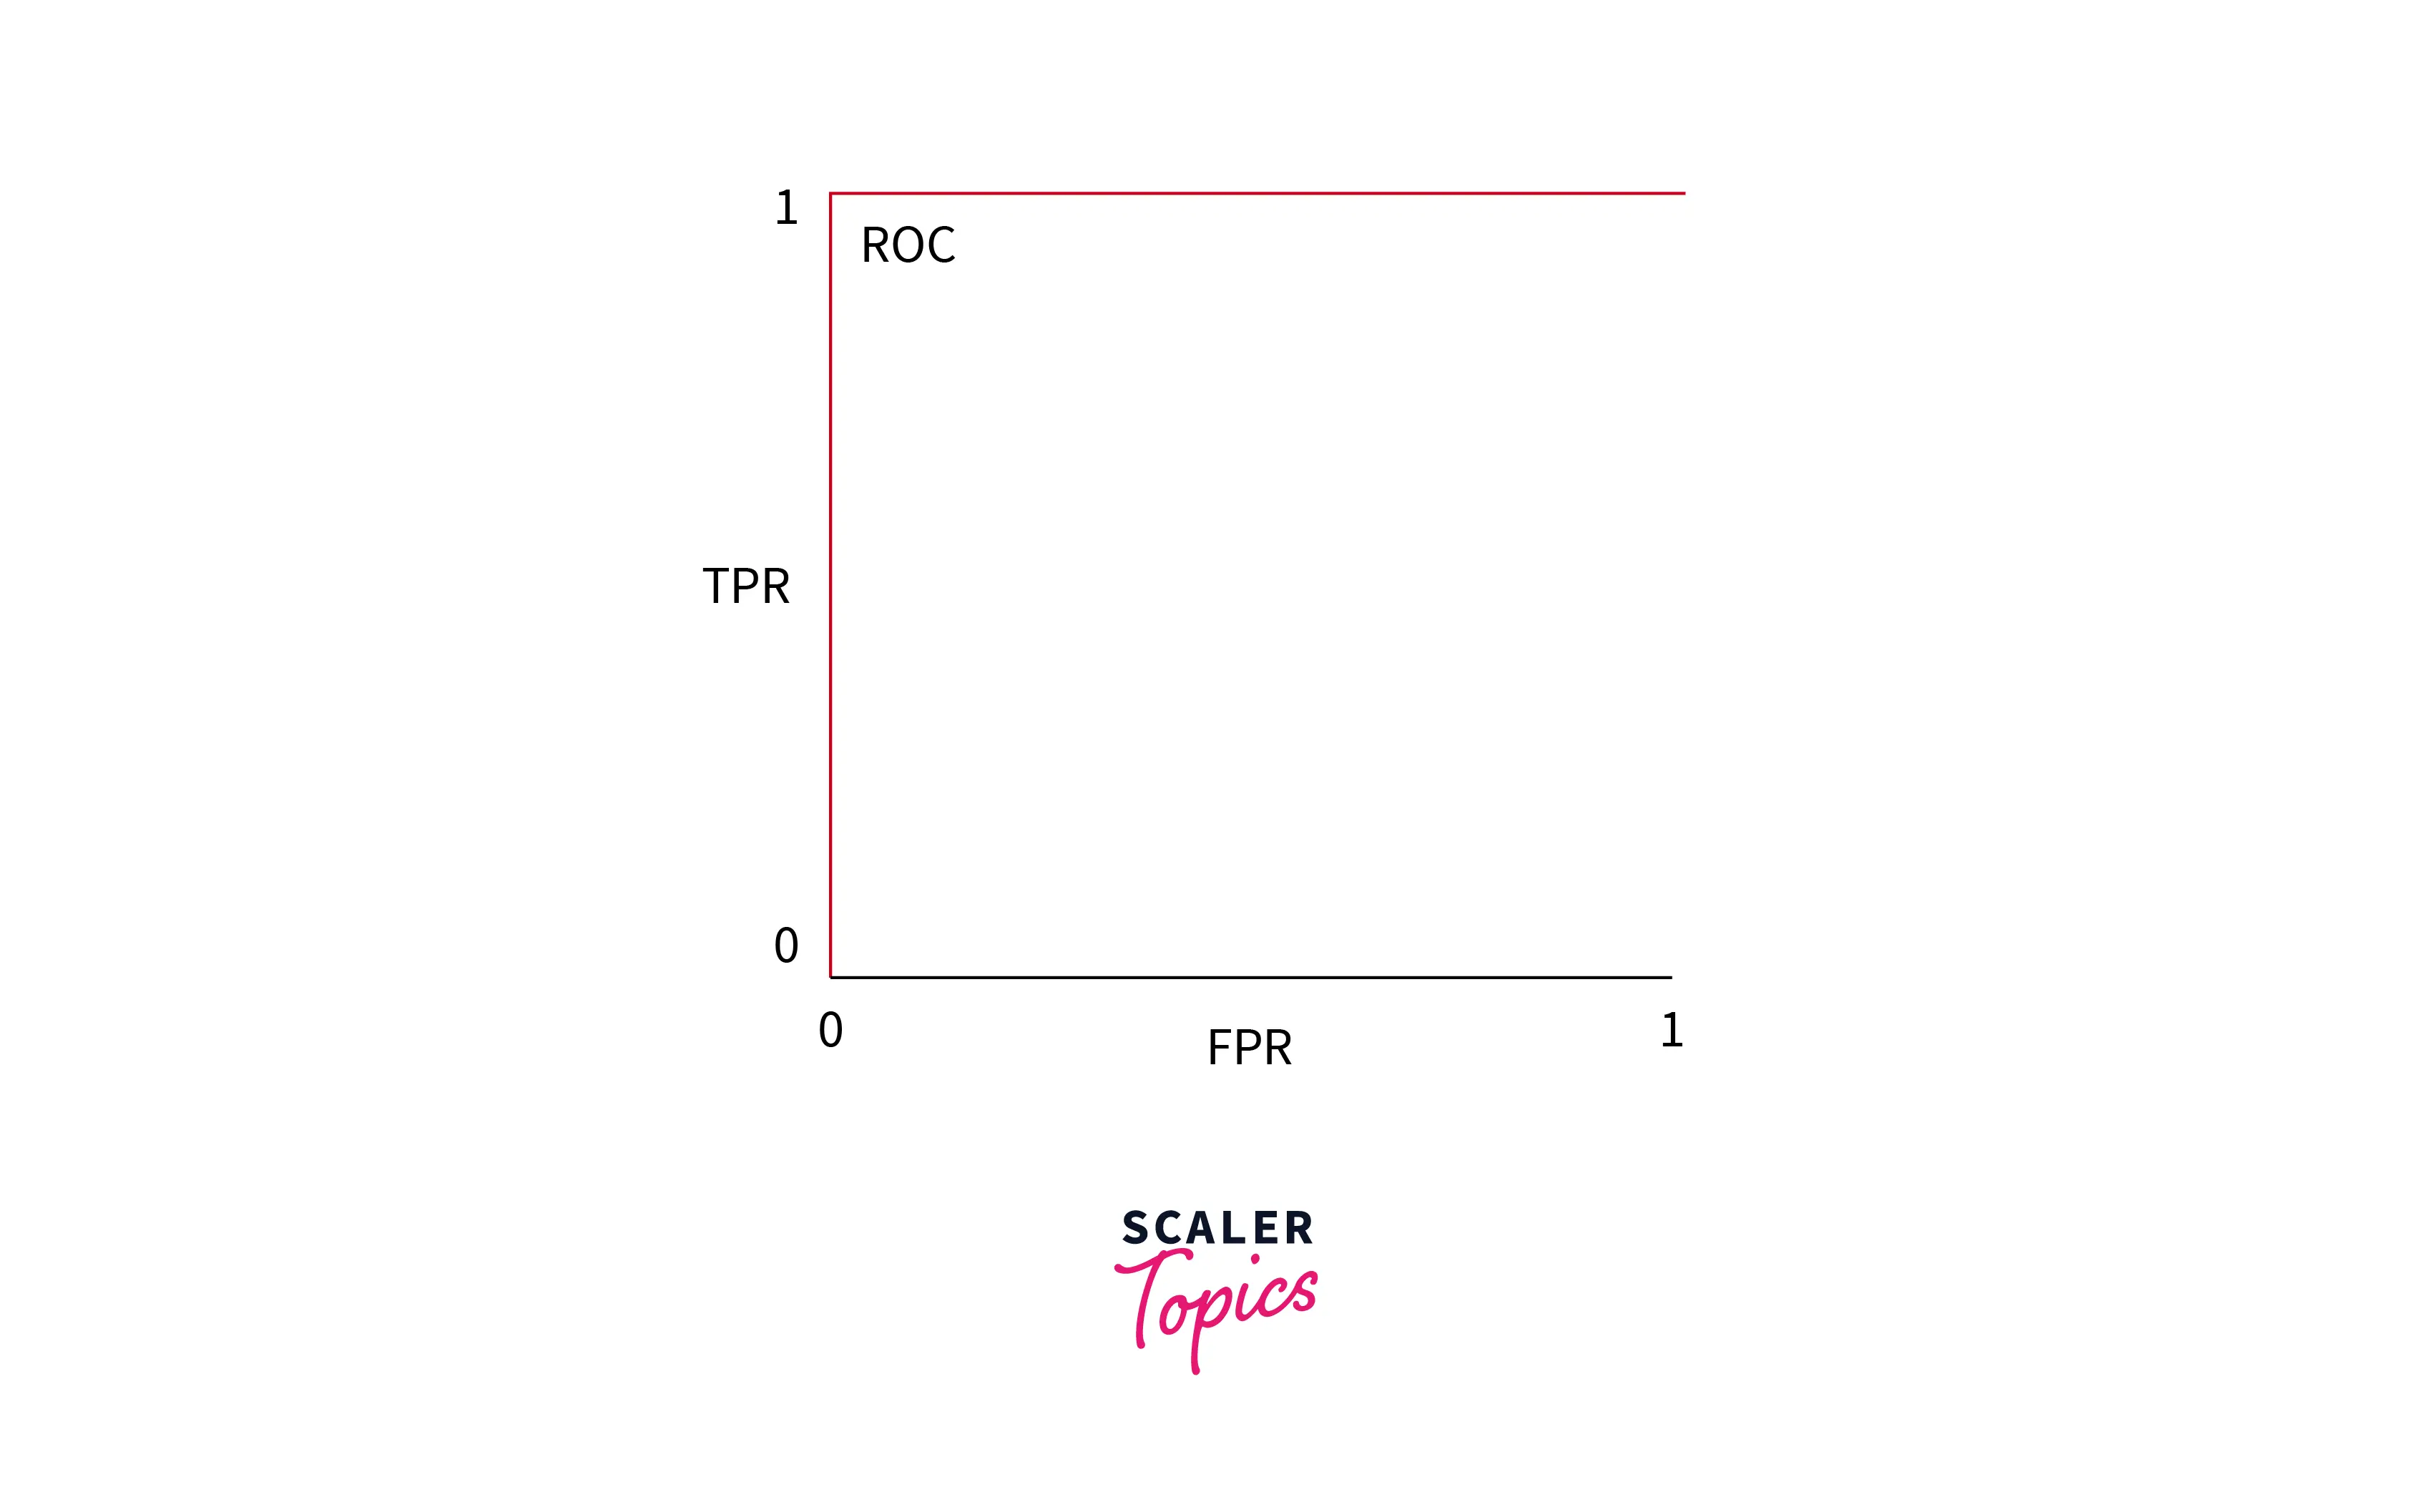
Case 4 : AUC = 1
This is an ideal situation where all the values are predicted accurately.
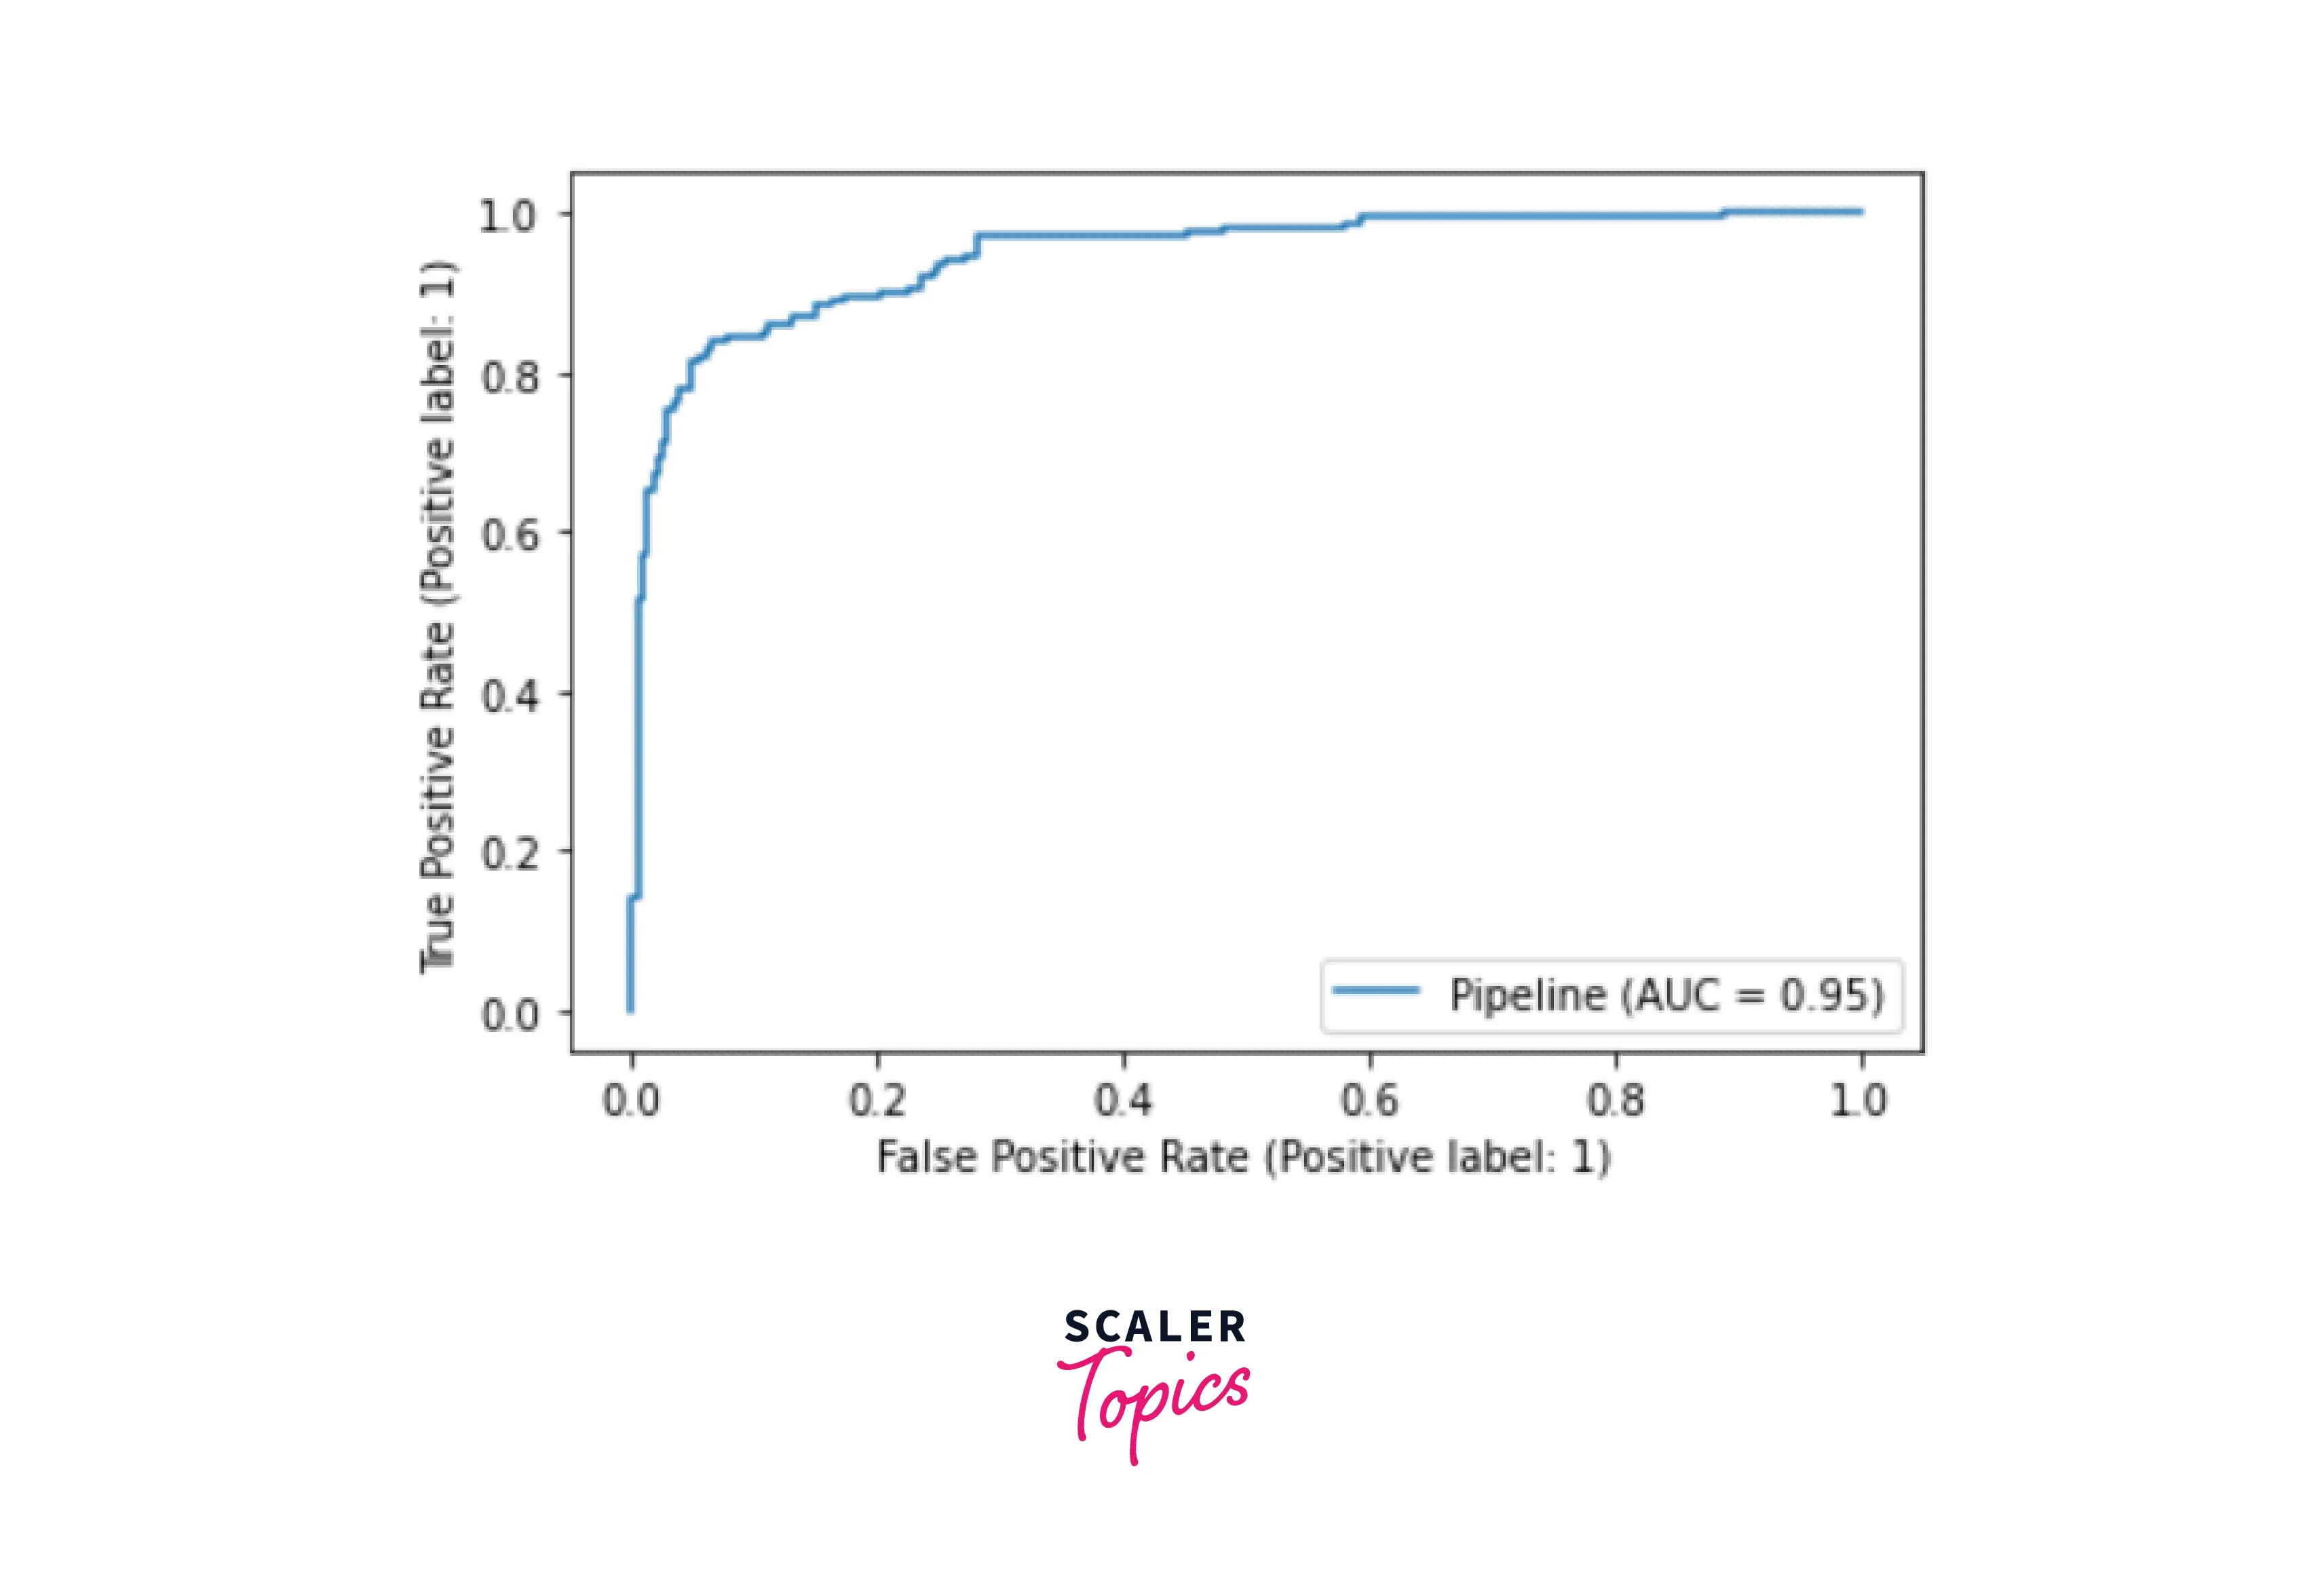
Code Implementation of AUROC Score -
Now that we know how AUROC Scores work, let us understand it using a small code.
Output -
Turn Learning into Career Growth
Relation Between Sensitivity, Specificity, FPR, and Threshold
Sensitivity and Specificity - Inversely Proportional If sensitivity increases, specificity decreases; if specificity increases, sensitivity decreases.
Based on the above equation, we can also draw another conclusion that True Positive Rate and True Negative - Inversely Proportional
More Threshold - More Negative values Thus, high Specificity and low Sensitivity
Inversely,
Less Threshold - More Positive values Thus, high sensitivity and low specificity
How to Choose a Threshold Value?
AUROC being a predictive model, the instinct would be to have a threshold of 0.5, although setting a standard value for the Threshold is sometimes the answer.
A threshold should be chosen based on datasets and the values present. The performance of our model is primarily based on this value.
We can calculate the Threshold using a few libraries to make things easier.
Let us look at the code implementation for the same.
Output -
Conclusion
- AUROC is a performance metric for machine learning models.
- The AUROC graph plots sensitivity and specificity, two parameters of ROC.
- Threshold is the point on the ROC curve that produces the most accurate Output.