Boston House Price Prediction
Overview
As the name suggests, Boston House Price Prediction Project predicts house prices based on various parameters like area, number of rooms, age, and more. In addition, the Boston House Price Prediction dataset has numeric values making it uncomplicated to compute and predict.
Moreover, this project can be developed for real-time applications in any city, helping developers, realtors, and buyers predict property value.
What are we Building?
In the Boston House Price Prediction Project, we are building a predictive model to evaluate the price of a house with provided parameters.
The parameters into consideration are - Per Capita Crime Rate by Town, Nitric Oxide Concentration, Weighted Distances to five Boston Employment Centres, Tax, etc.
In this project, we will use - Linear Regression, Random Forest, and decision tree classifier and compare the model accuracy.
Scaler Placement Report and Statistics
Scaler learners achieved 2.5x salary growth with average post-Scaler CTC reaching ₹23L.
Pre-requisites
To build the Boston House Price Prediction Project, the following pre-requisites will be a benefit -
- Understanding of Python
- Implementation of libraries like Pandas, Numpy, Seaborn, Matplotlib, and SciKit Learn
- Familiarity with Machine Learning algorithms like Regression, Decision Trees, and Random Forests
- Basic acquaintance with concepts like Data Cleaning, Processing, Model Evaluation, Model Testing, Model Training, and Feature detection
Transform Your Career
Choose from our industry-leading programs designed for career success
Modern Software and AI Engineering Program
Master full-stack development with AI integration

Modern Data Science and ML with specialisation in AI
Advanced data science techniques with AI specialization
Advanced AIML with Specialisation in Agentic AI
Deep dive into AIML with focus on Agentic systems
DevOps, Cloud & AI Platform Engineering
Build and manage AI-powered cloud infrastructure
AI Engineering Advanced Certification by IIT-Roorkee
Premier AI engineering certification from IIT-Roorkee
How are we going to build this?
Let us have a walkthrough of building the project -
- Libraries and Data - Importing the necessary libraries and dataset
- Analysis - Reviewing the values, data types, and columns of the dataset
- Visualisation - Data Visualisation to check for underlying trends and patterns in the dataset
- Feature Analysis - Analysing the features to check if refactoring, dropping of columns, or missing data is to be filled
- Data Cleaning - Filling in missing values and dropping columns that are not needed
- Feature Engineering - Scoring the features to assess their significance in predicting
- Training, Testing, and Splitting data - Getting the data prepared for prediction by dividing it into training and testing data
- Models - Fitting the models and then predicting outputs
- Evaluation - Obtaining the model score and checking their accuracy
Final Output
Given below is the score of each of the models applied to the dataset.
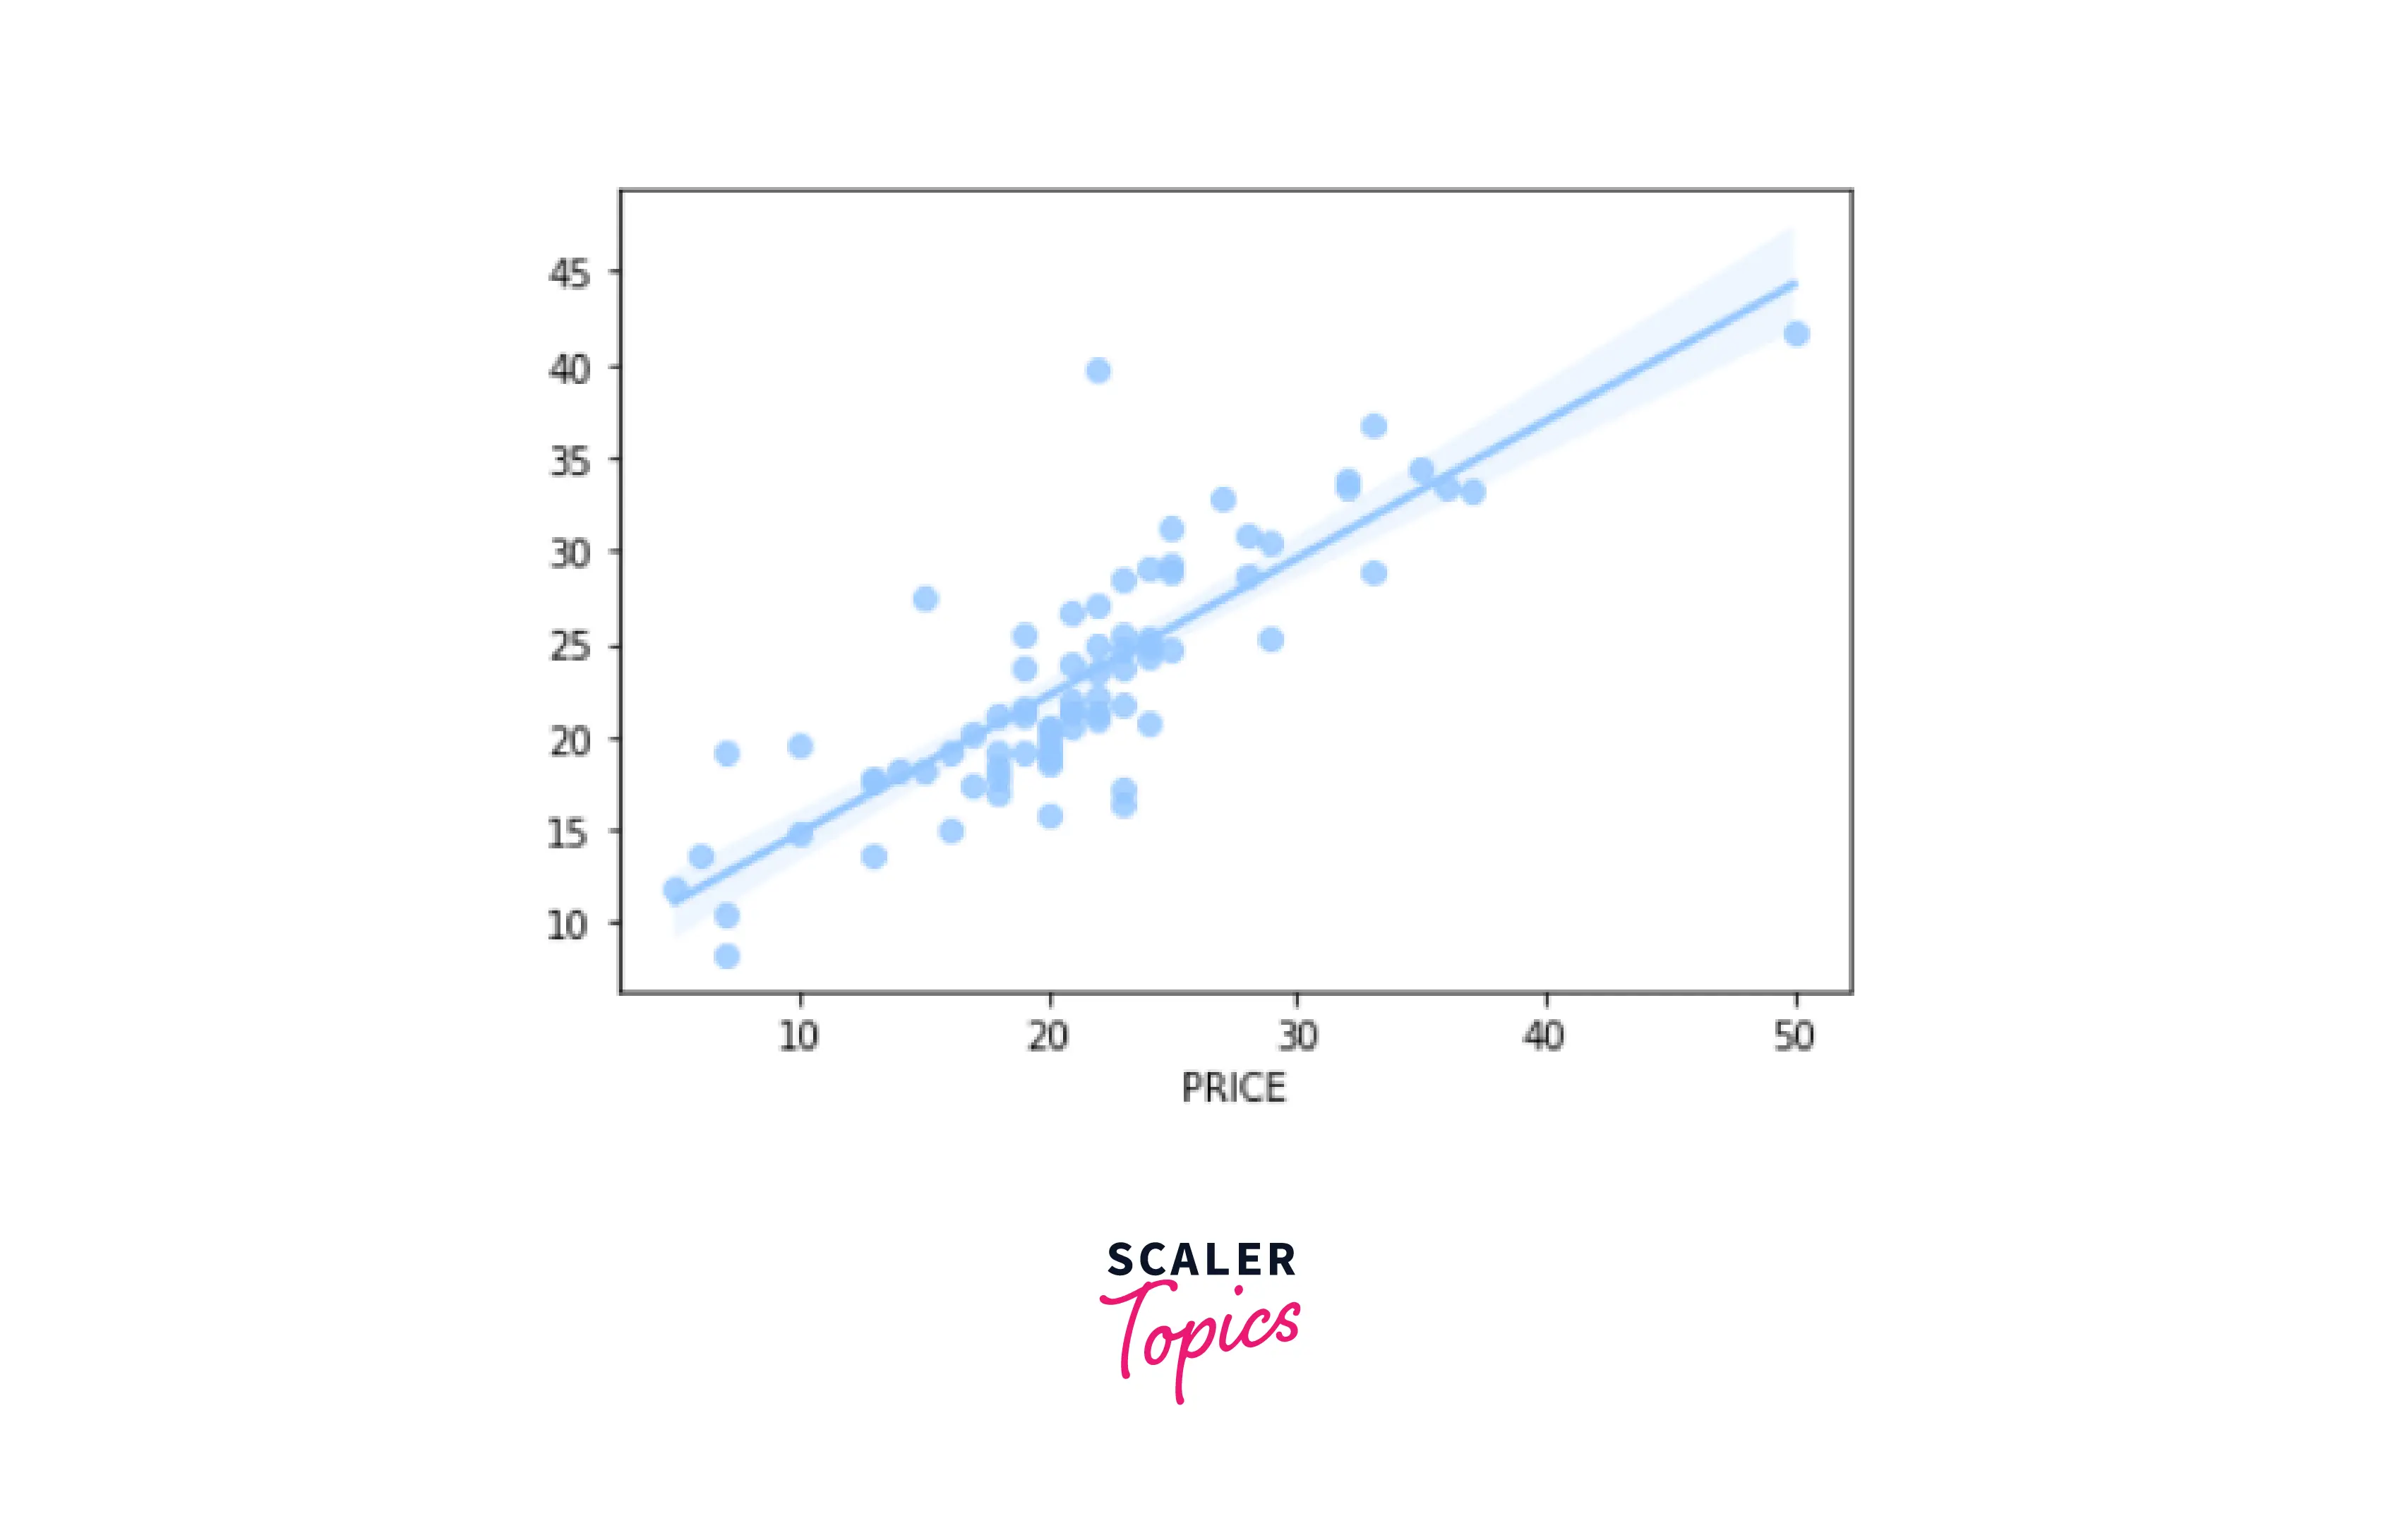
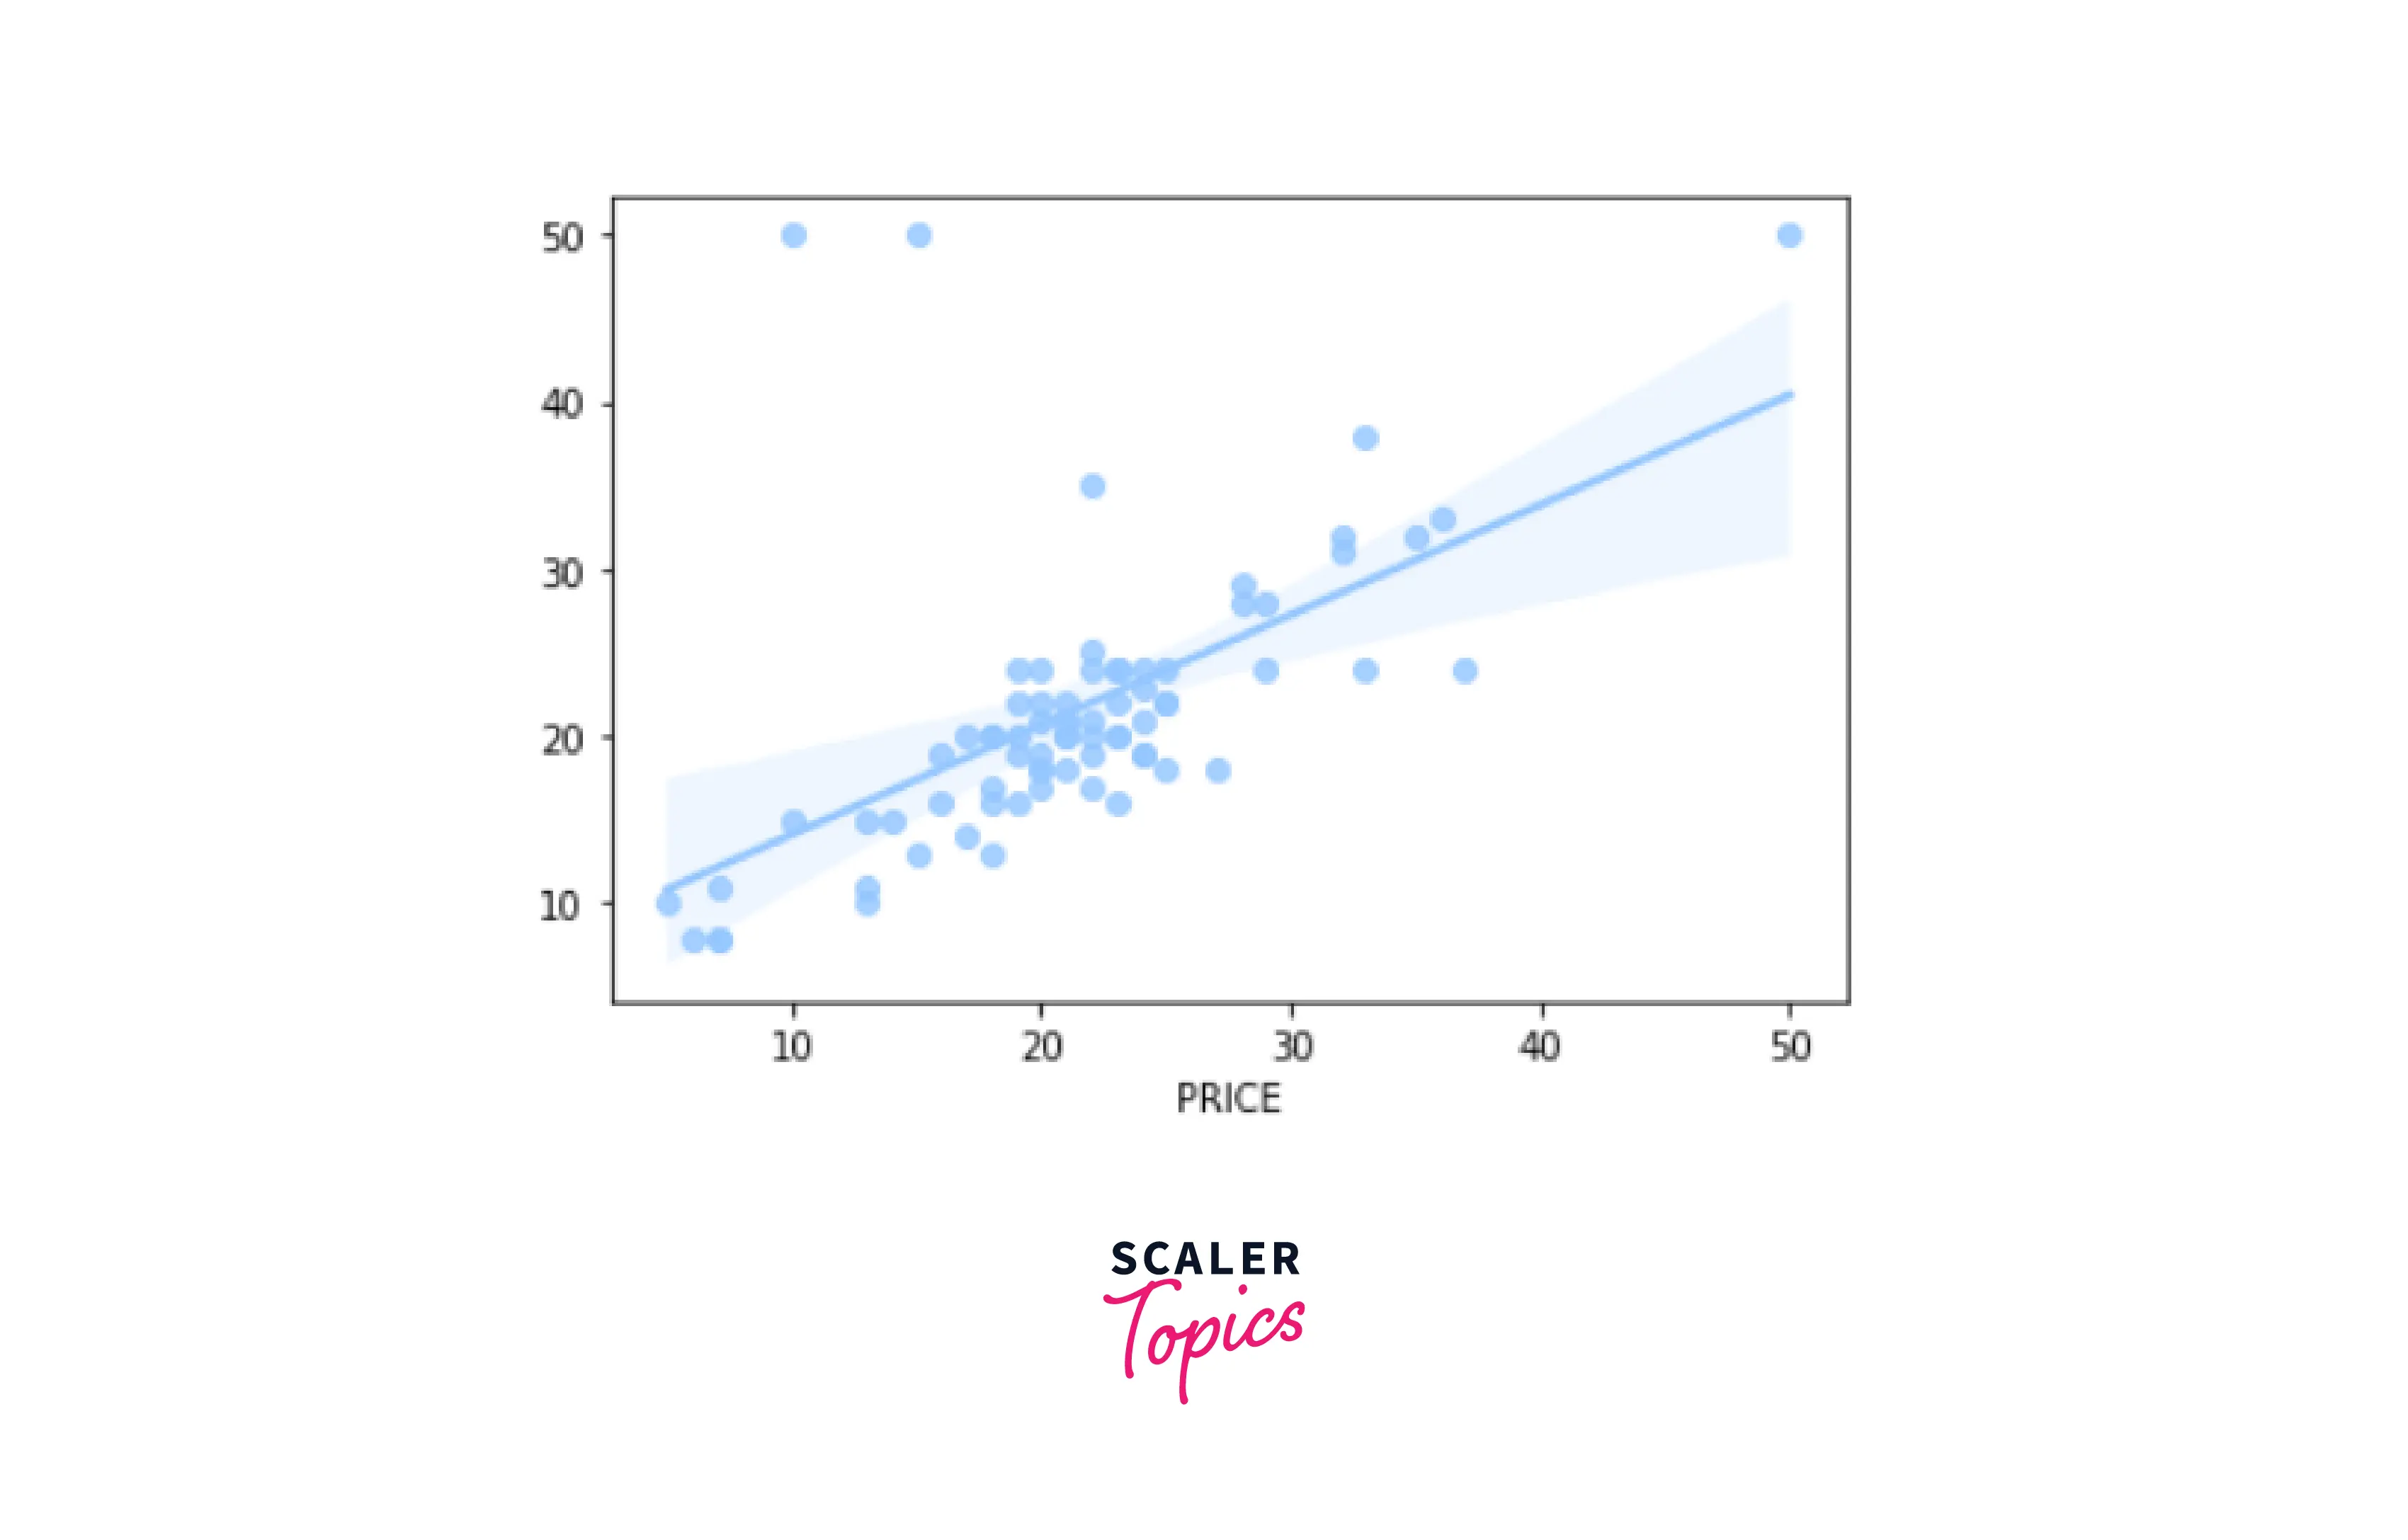
Linear Regression Graph -
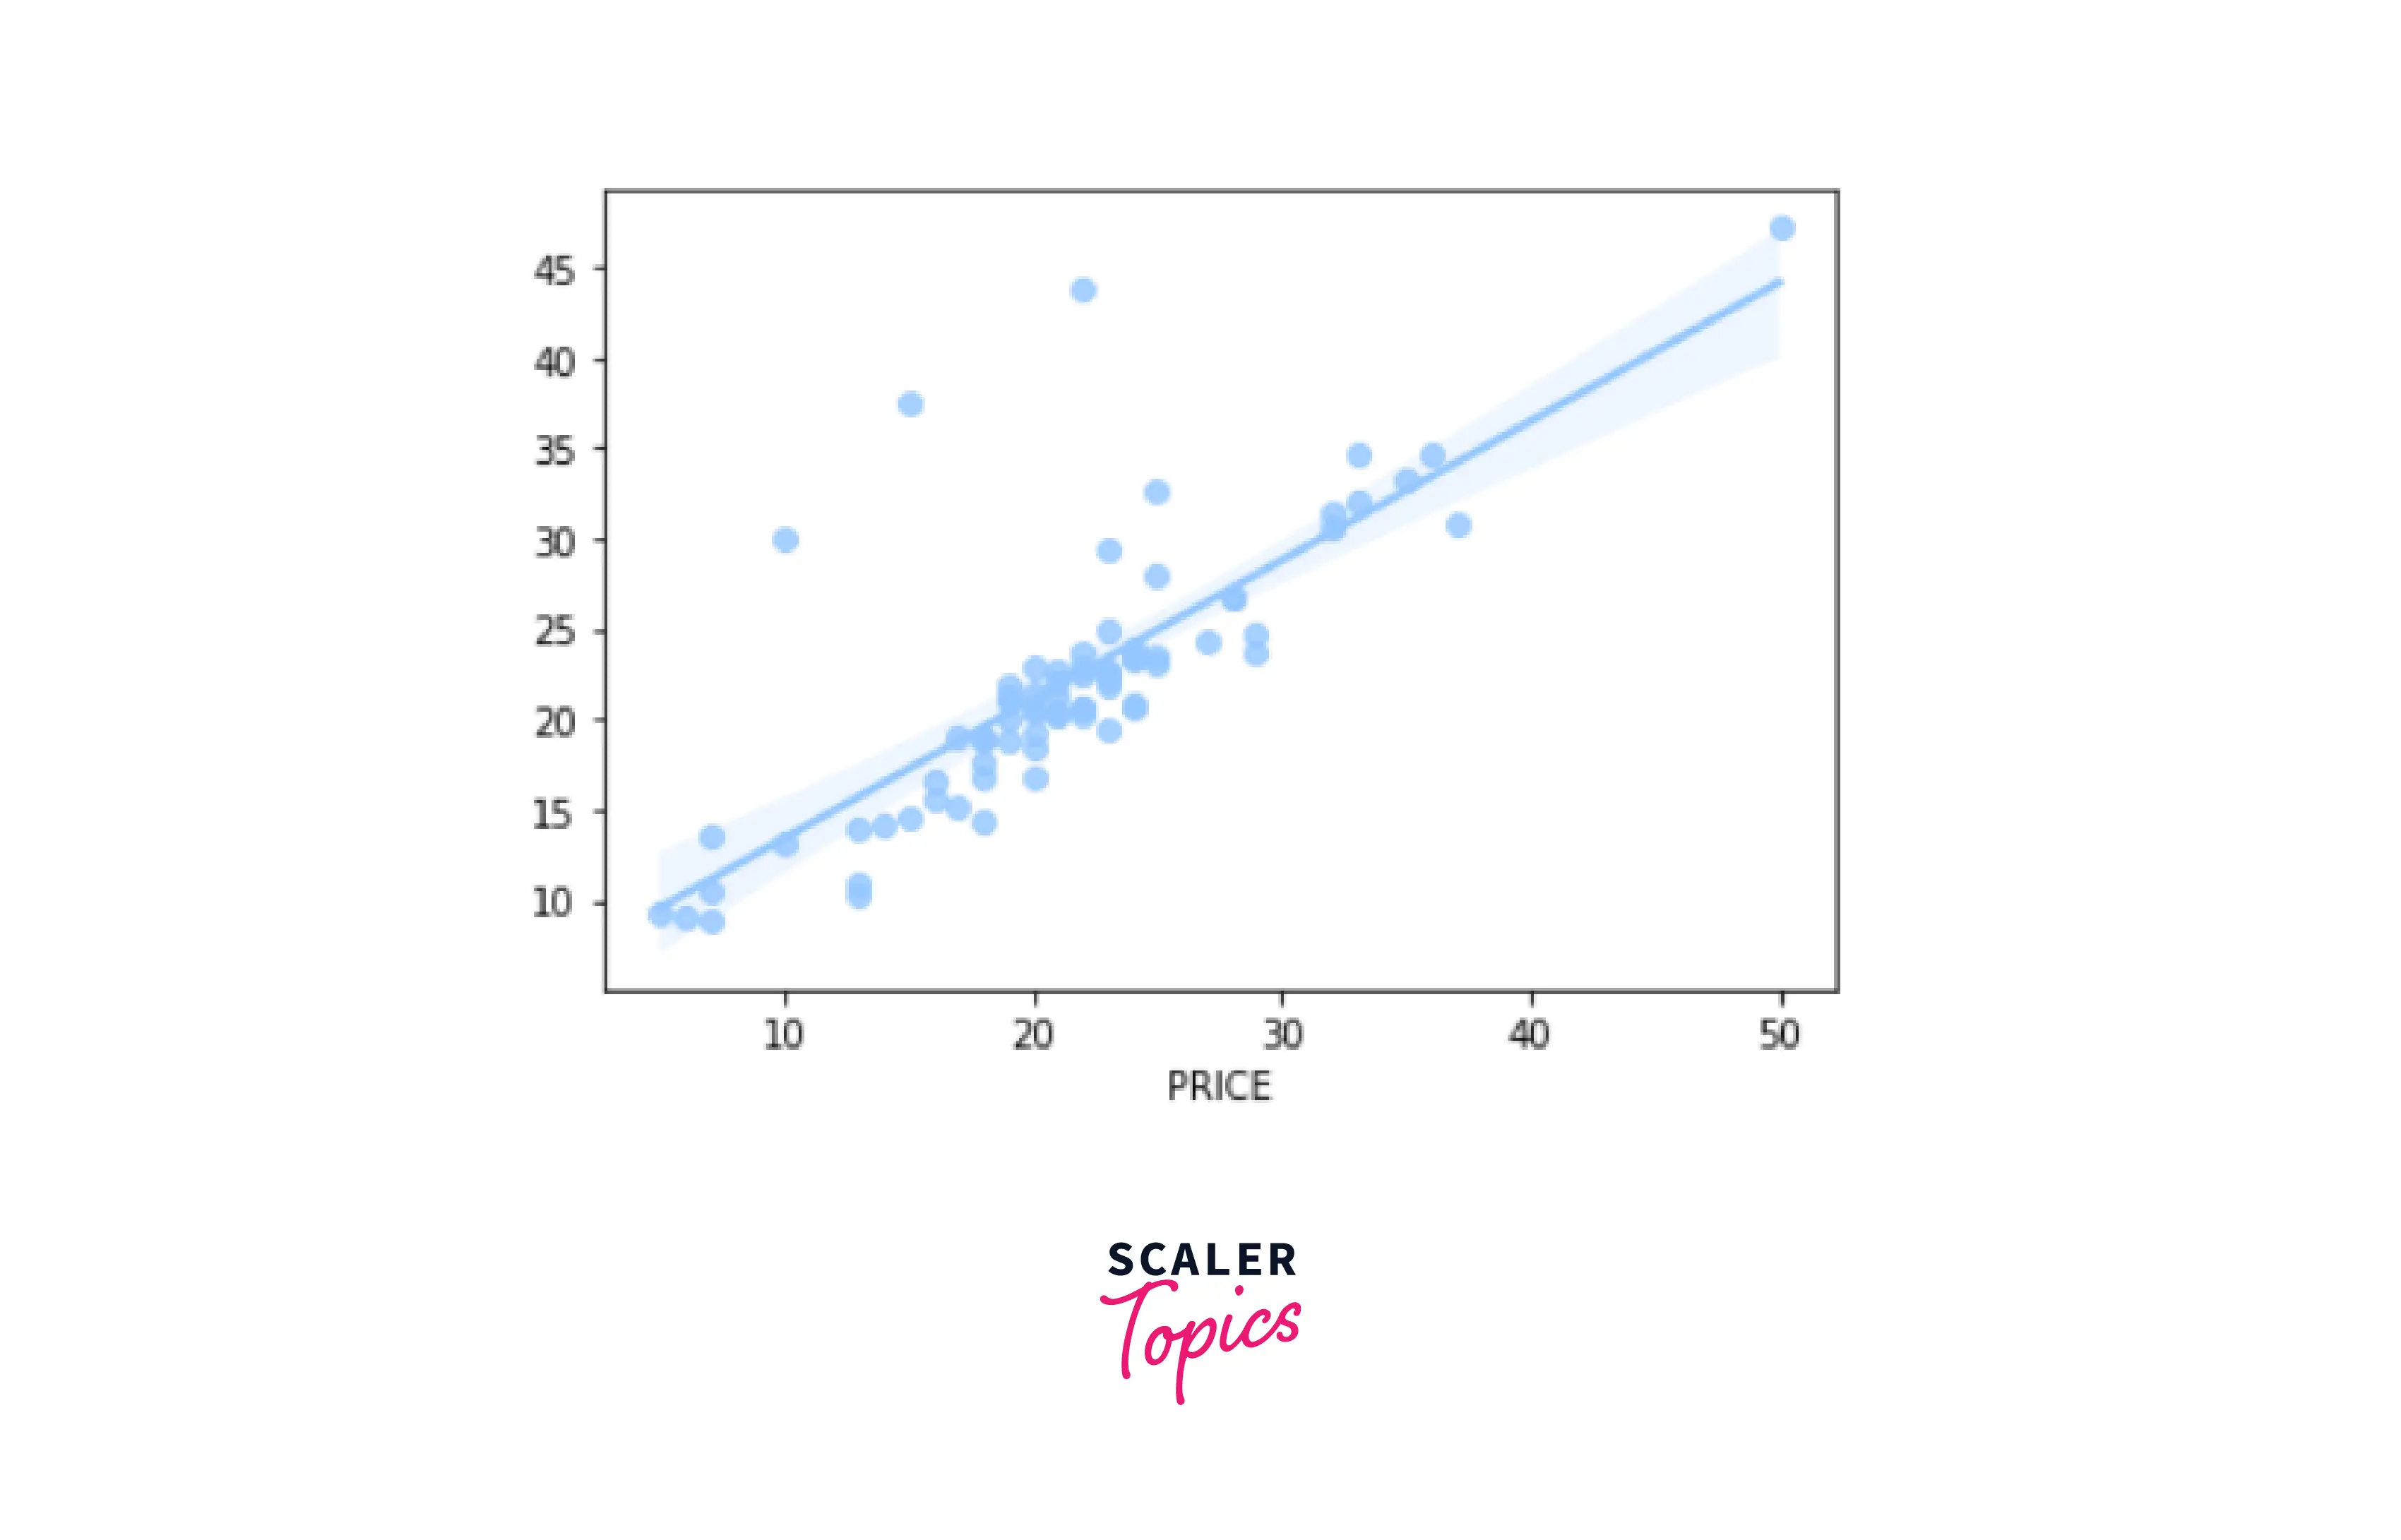
Decision Tree Graph -

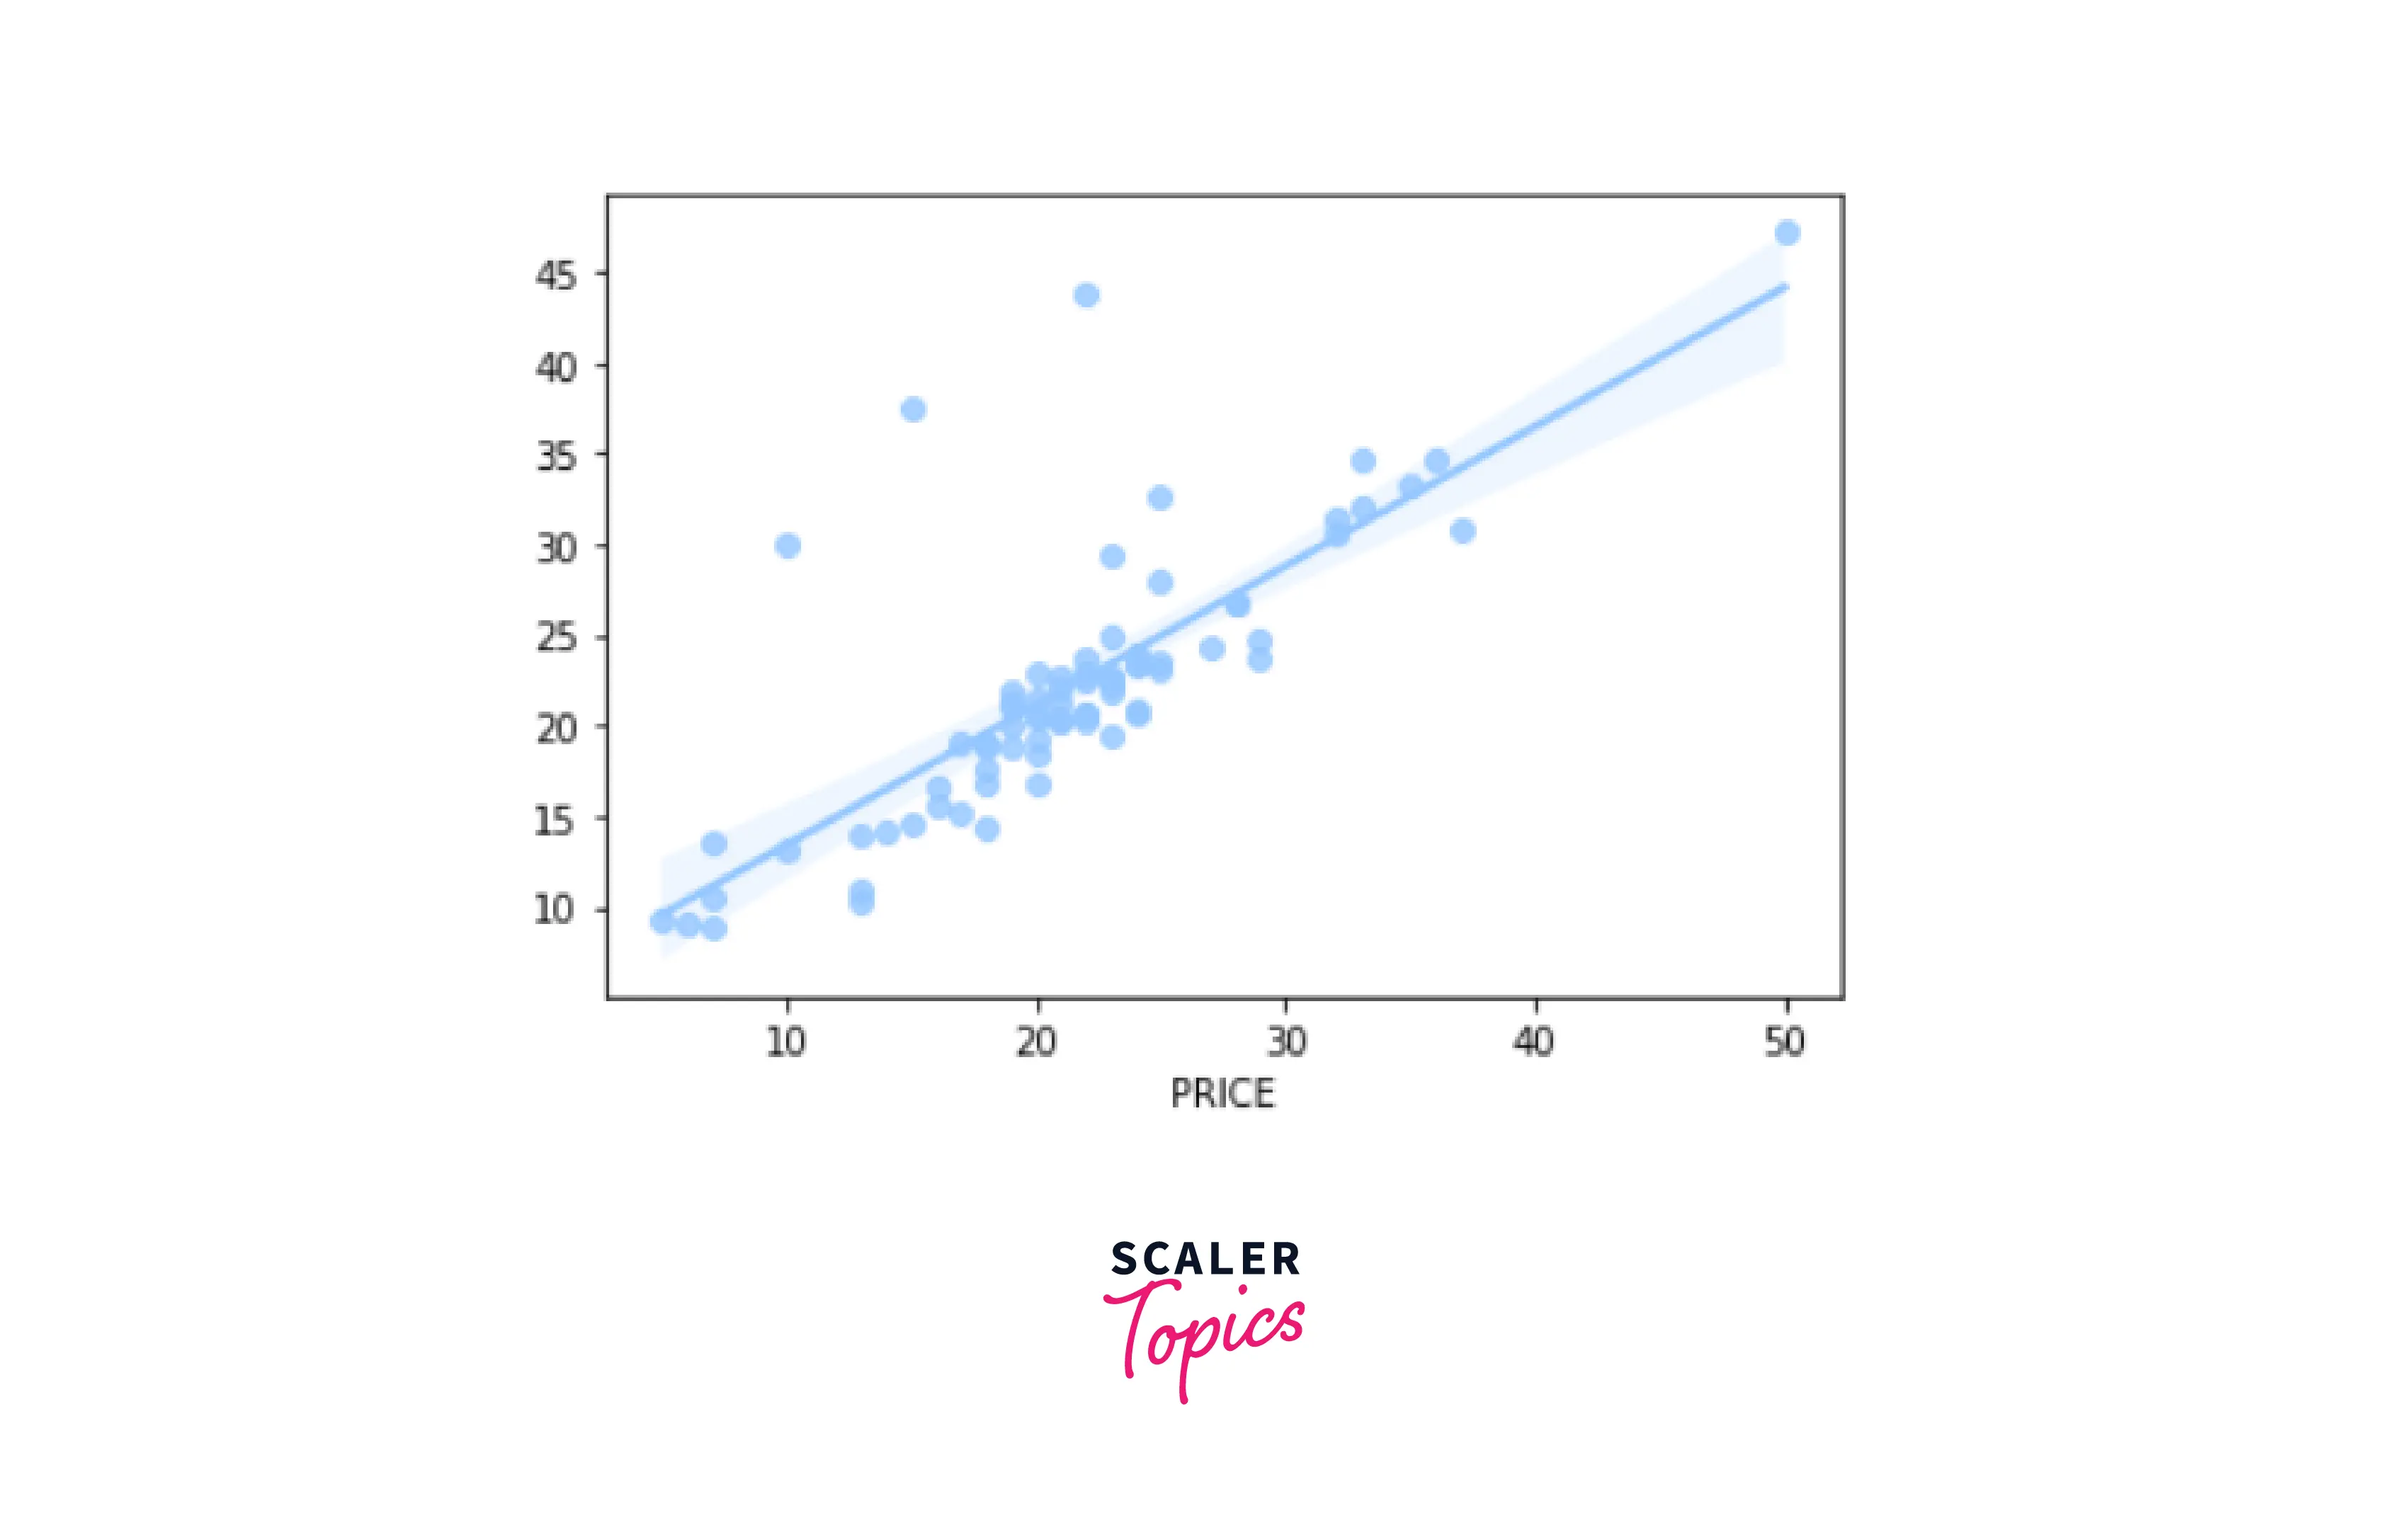
Random Forest Graph -
Requirements
- Environment - Either an online or offline compiler
- Libraries - Pandas, Numpy, Seaborn, Matplotlib, and SciKit Learn
Turn Learning into Career Growth
About the data
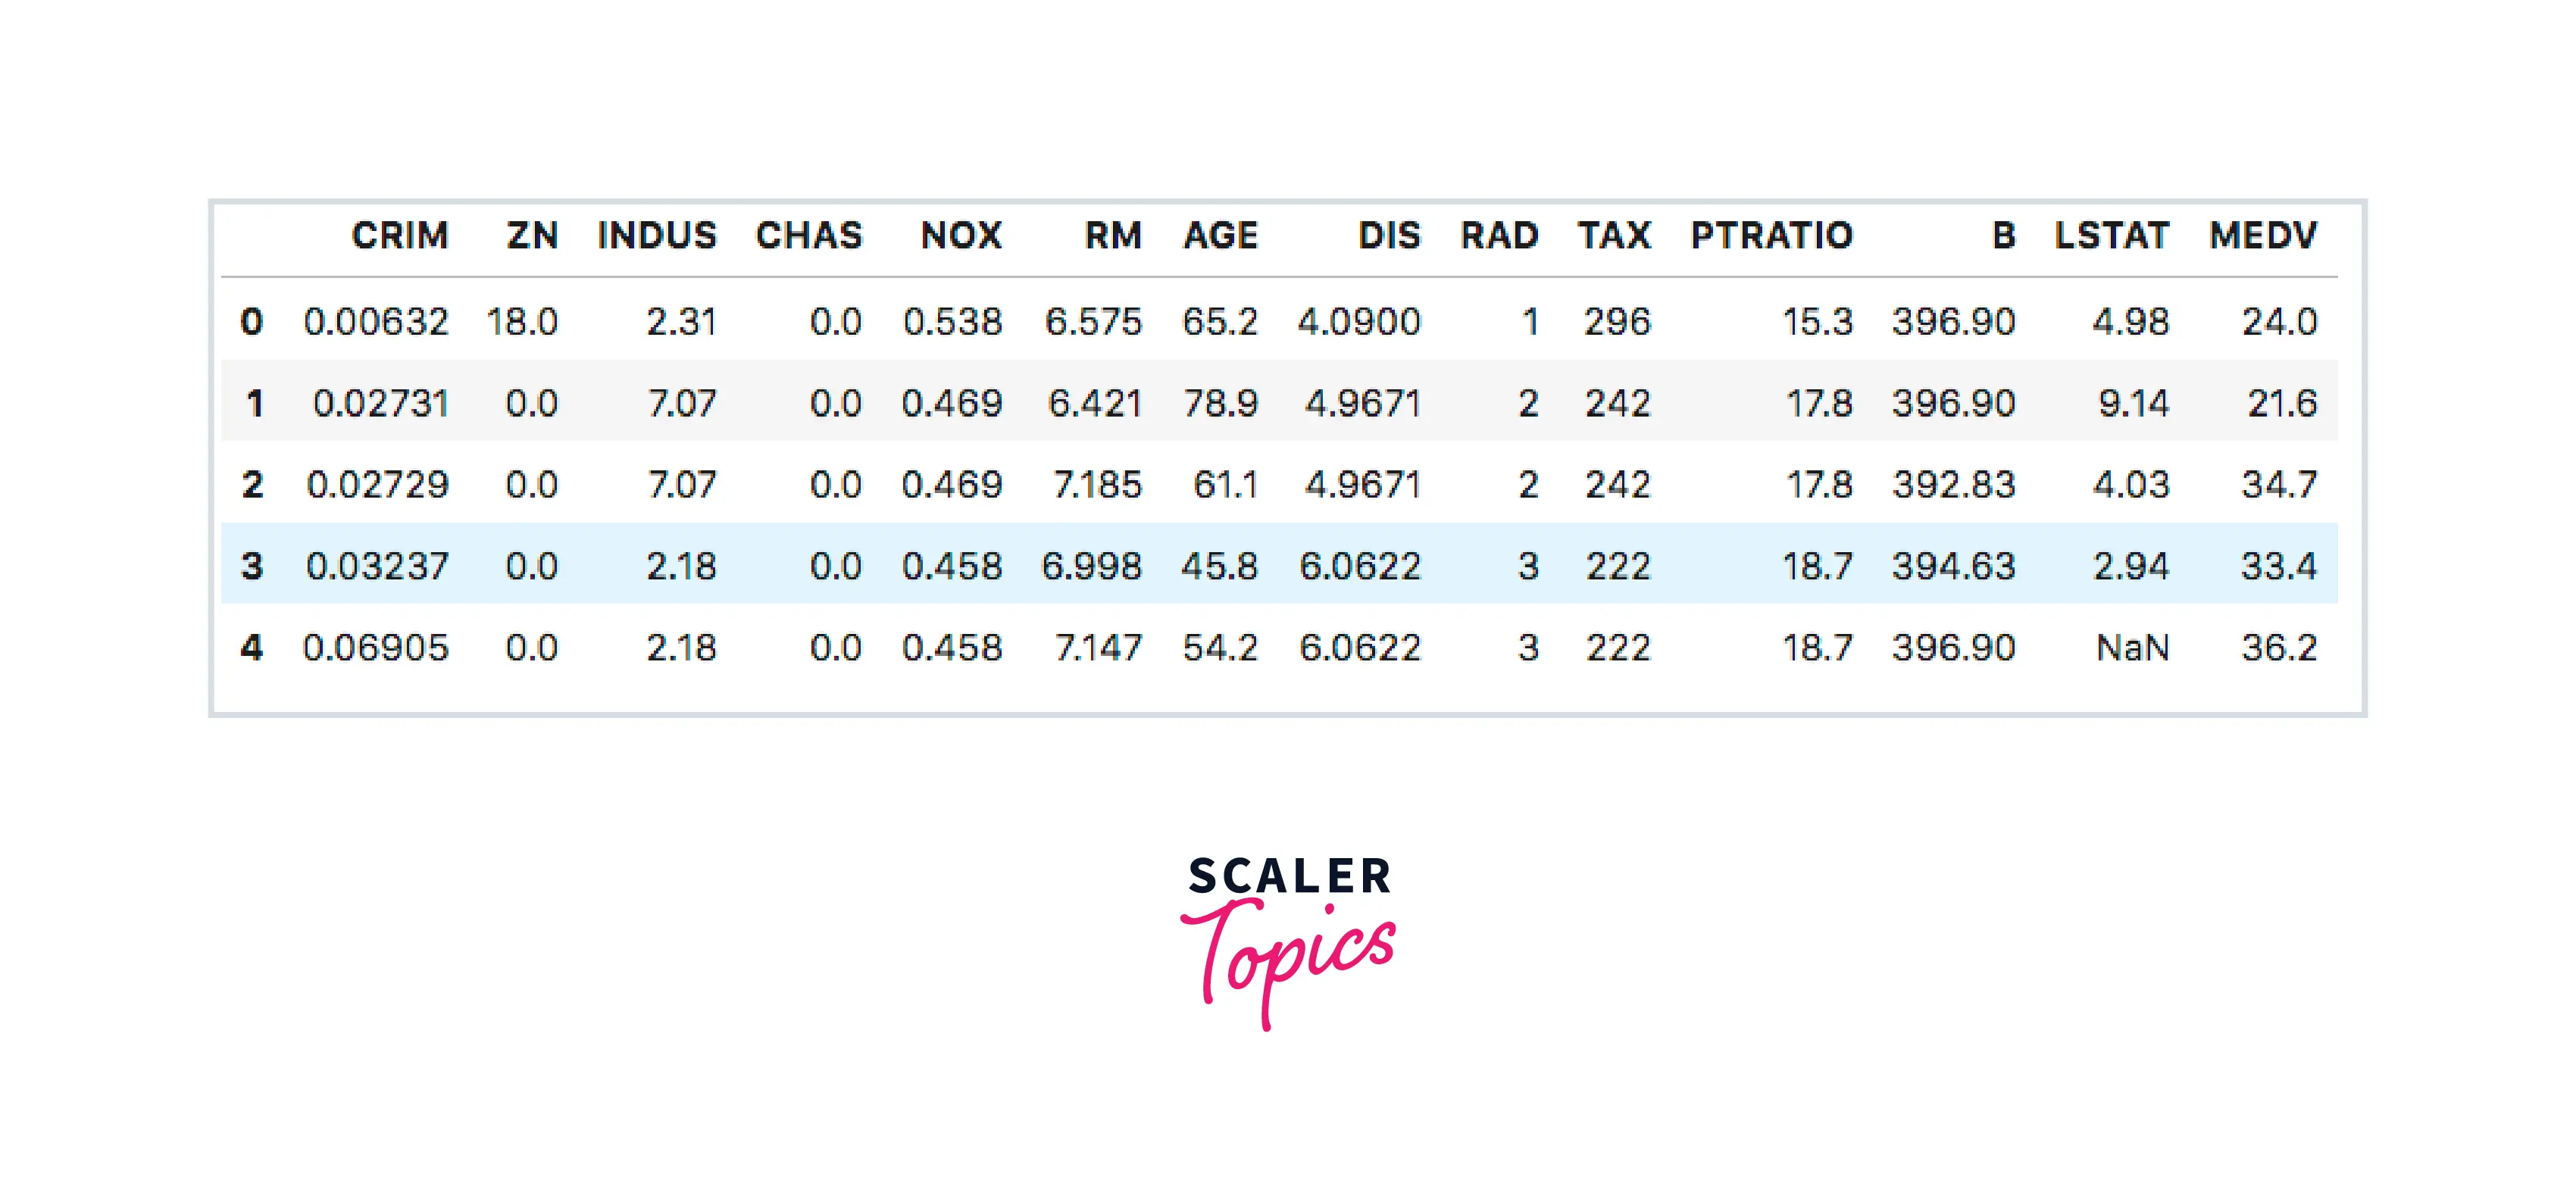
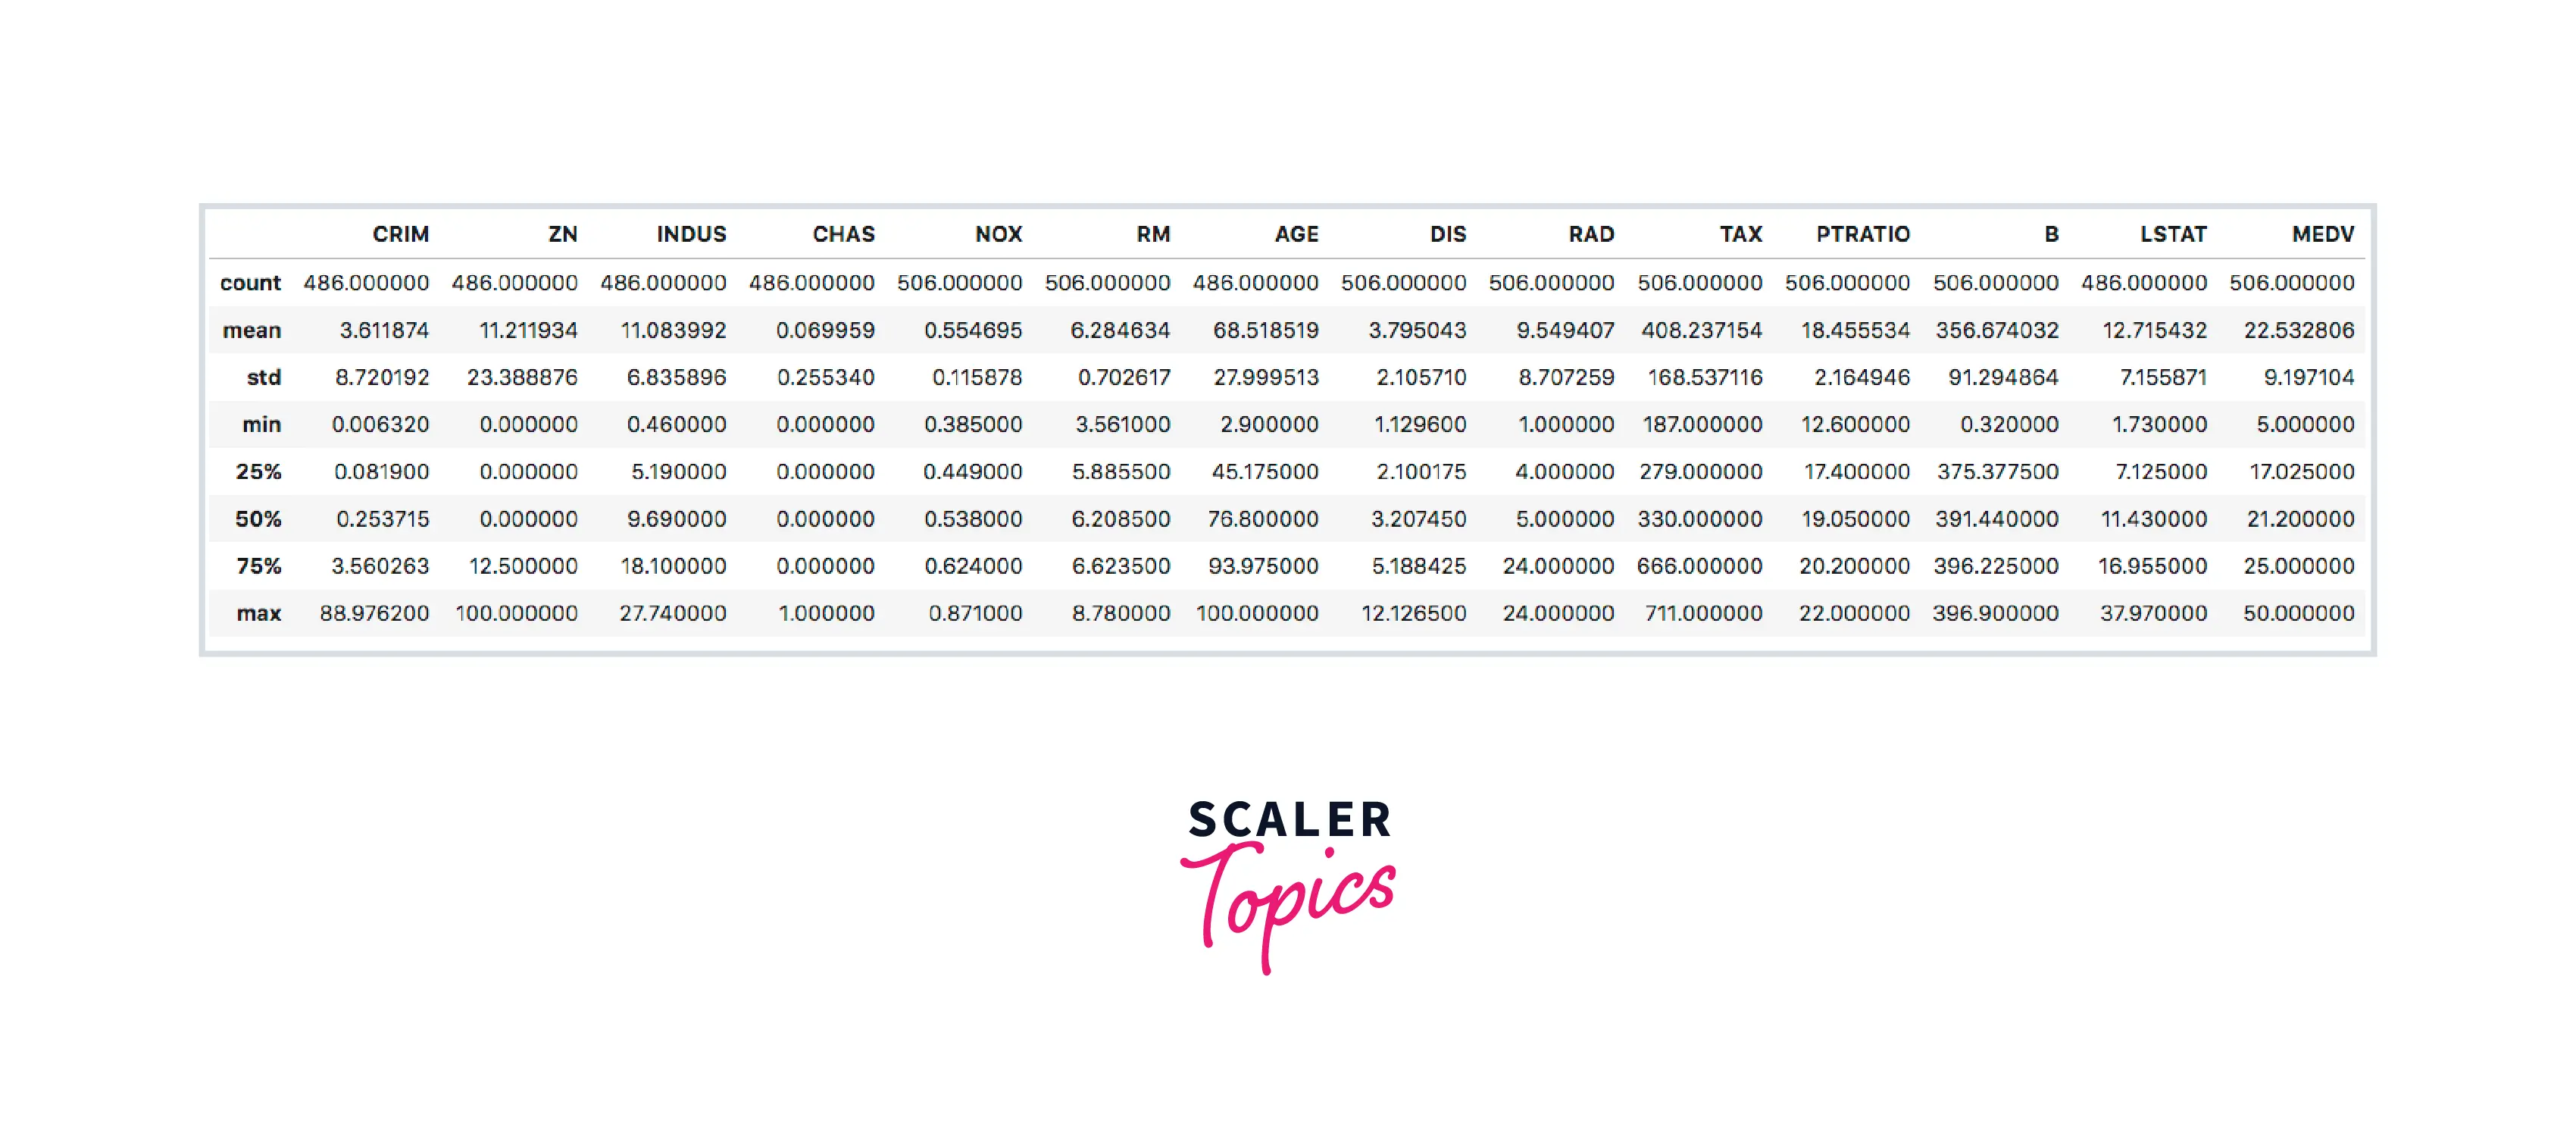
The Boston Housing Data has 506 rows and 14 columns. All the values are either integers or float.
Below are the columns and their description -
- CRIM - Per Capita Crime Rate
- ZN - Proportion of Residential Land Zoned for Lots over 25,000 sq. ft
- INDUS - Proportion of Non-Retail Business Acres
- CHAS - Charles River Variable
- NOX - Nitric Oxide Concentration
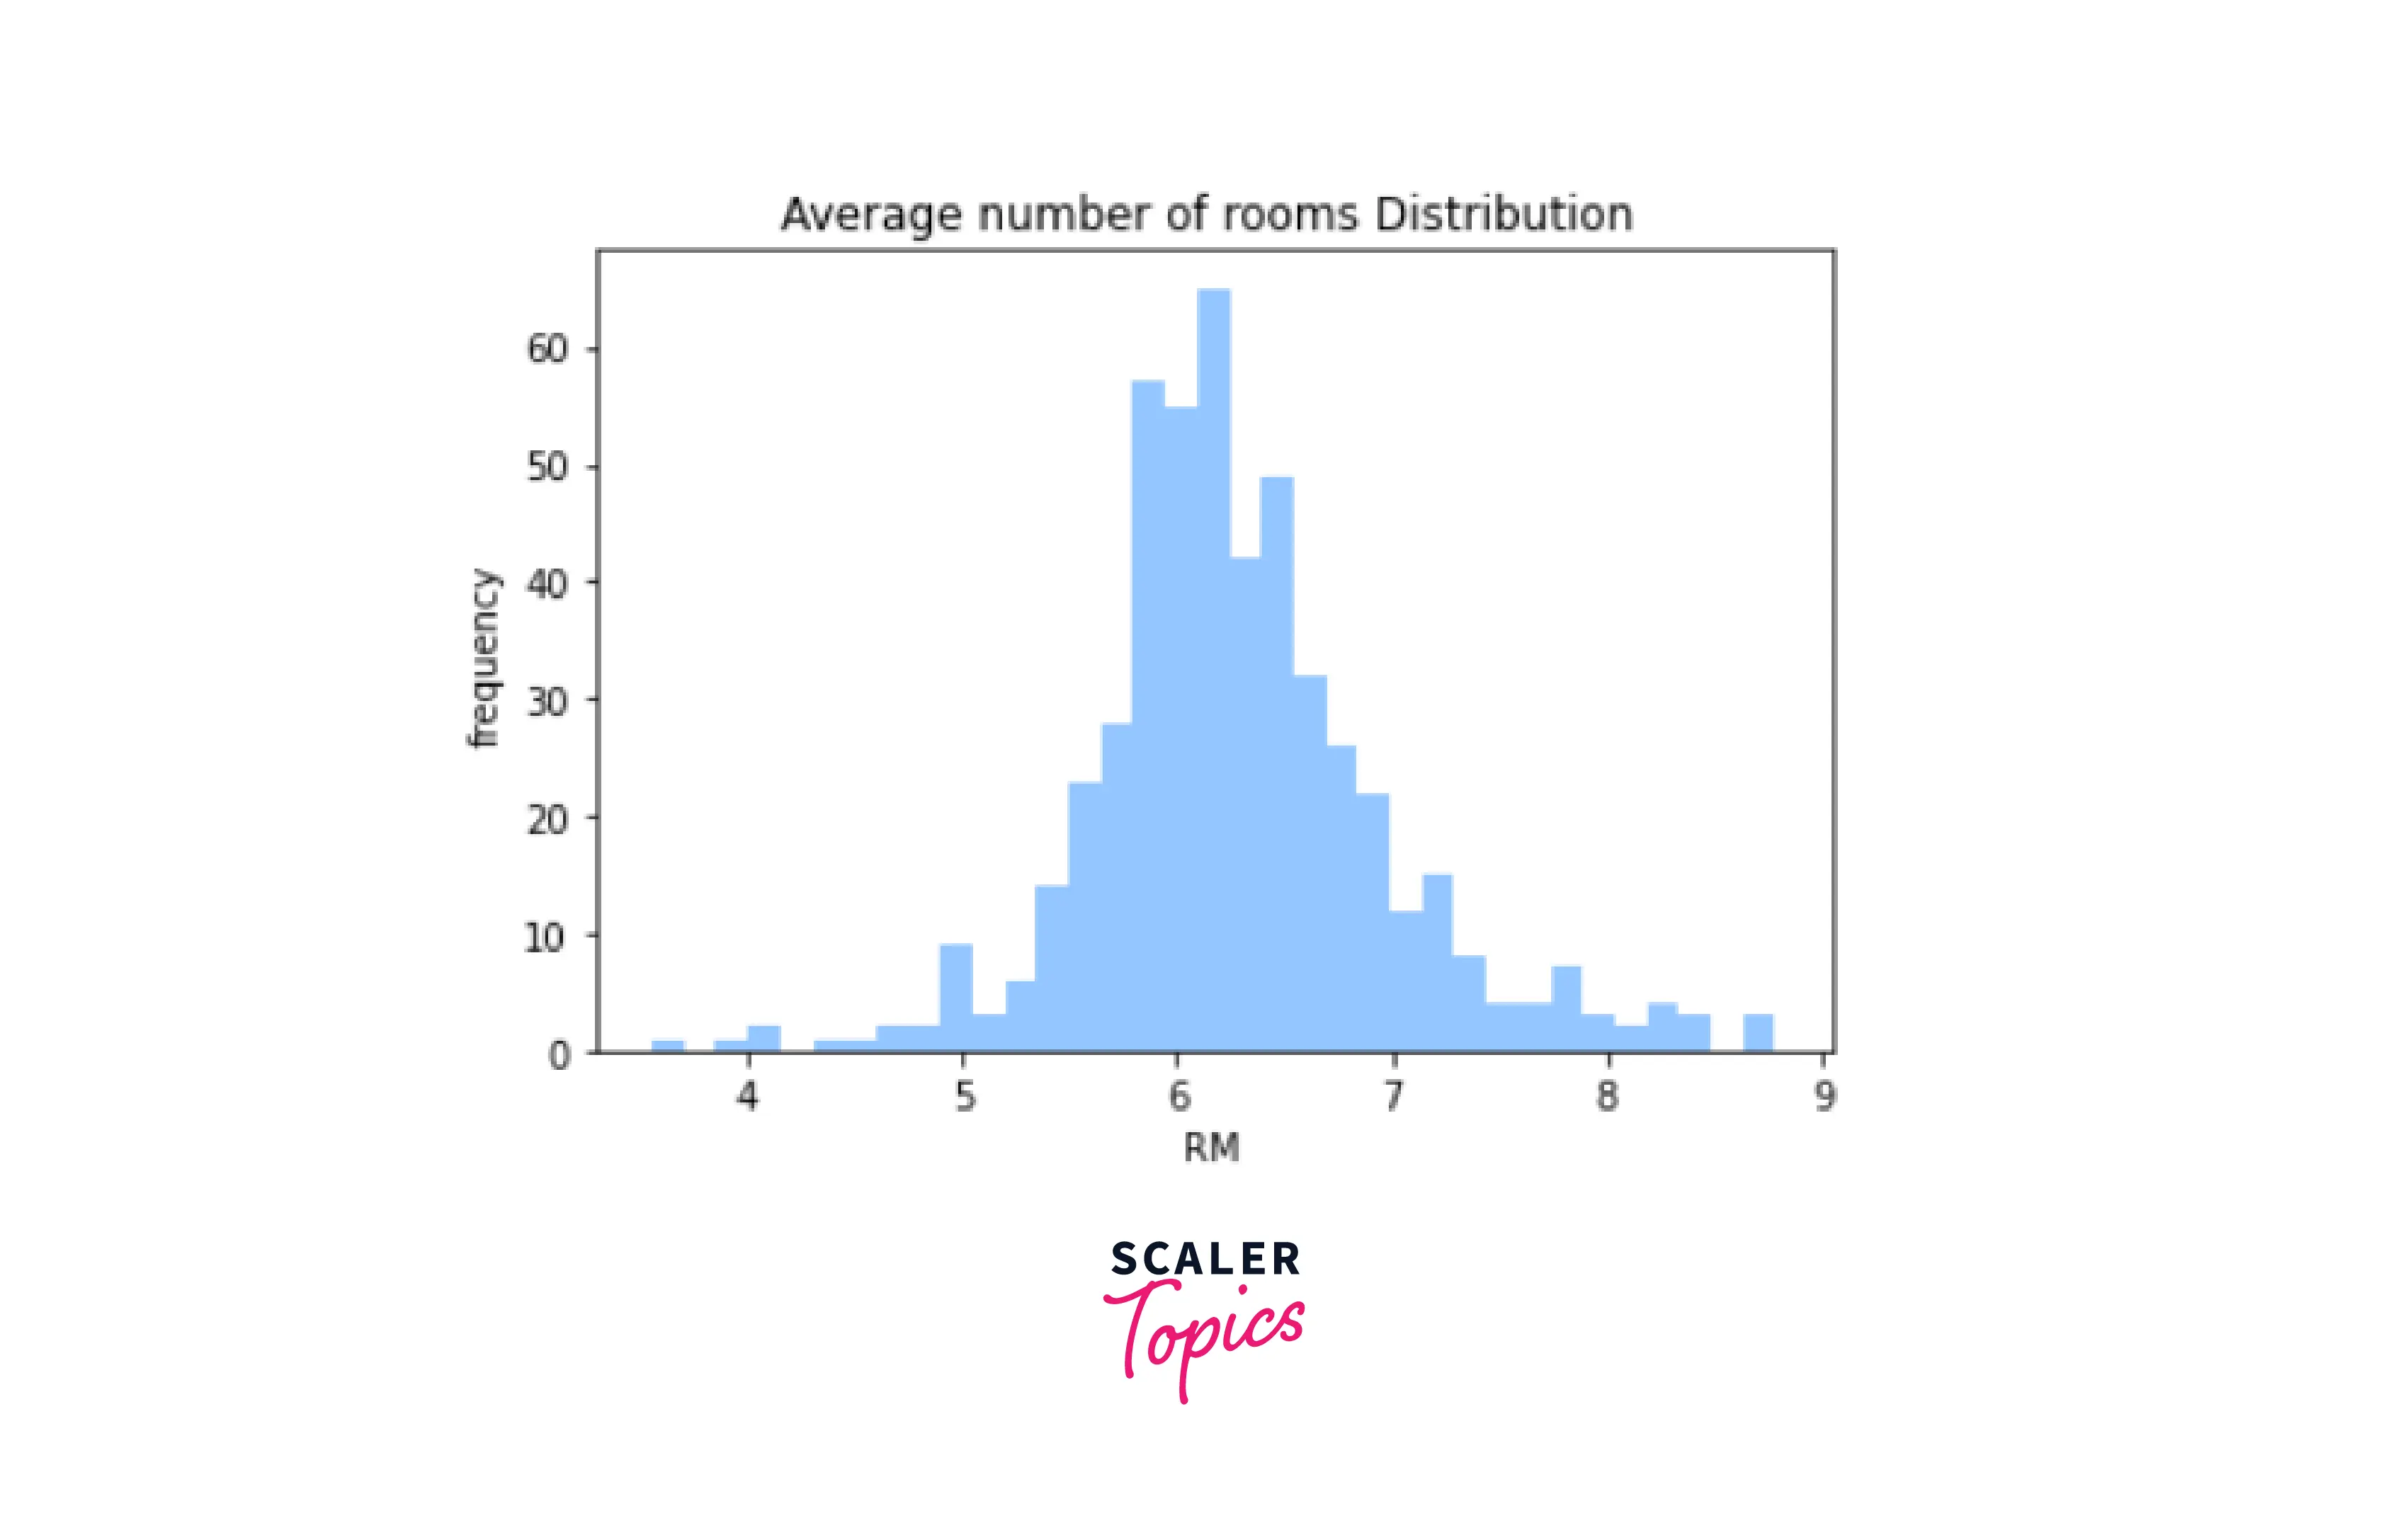
- RM - Average number of Rooms
- AGE - Proportion of owner-occupied units built before 1940
- DIS - Weighted Distances to Boston Employment Centres
- RAD - Index of Accessibility to Radial Highways
- TAX - Property Tax Rate per $10,000
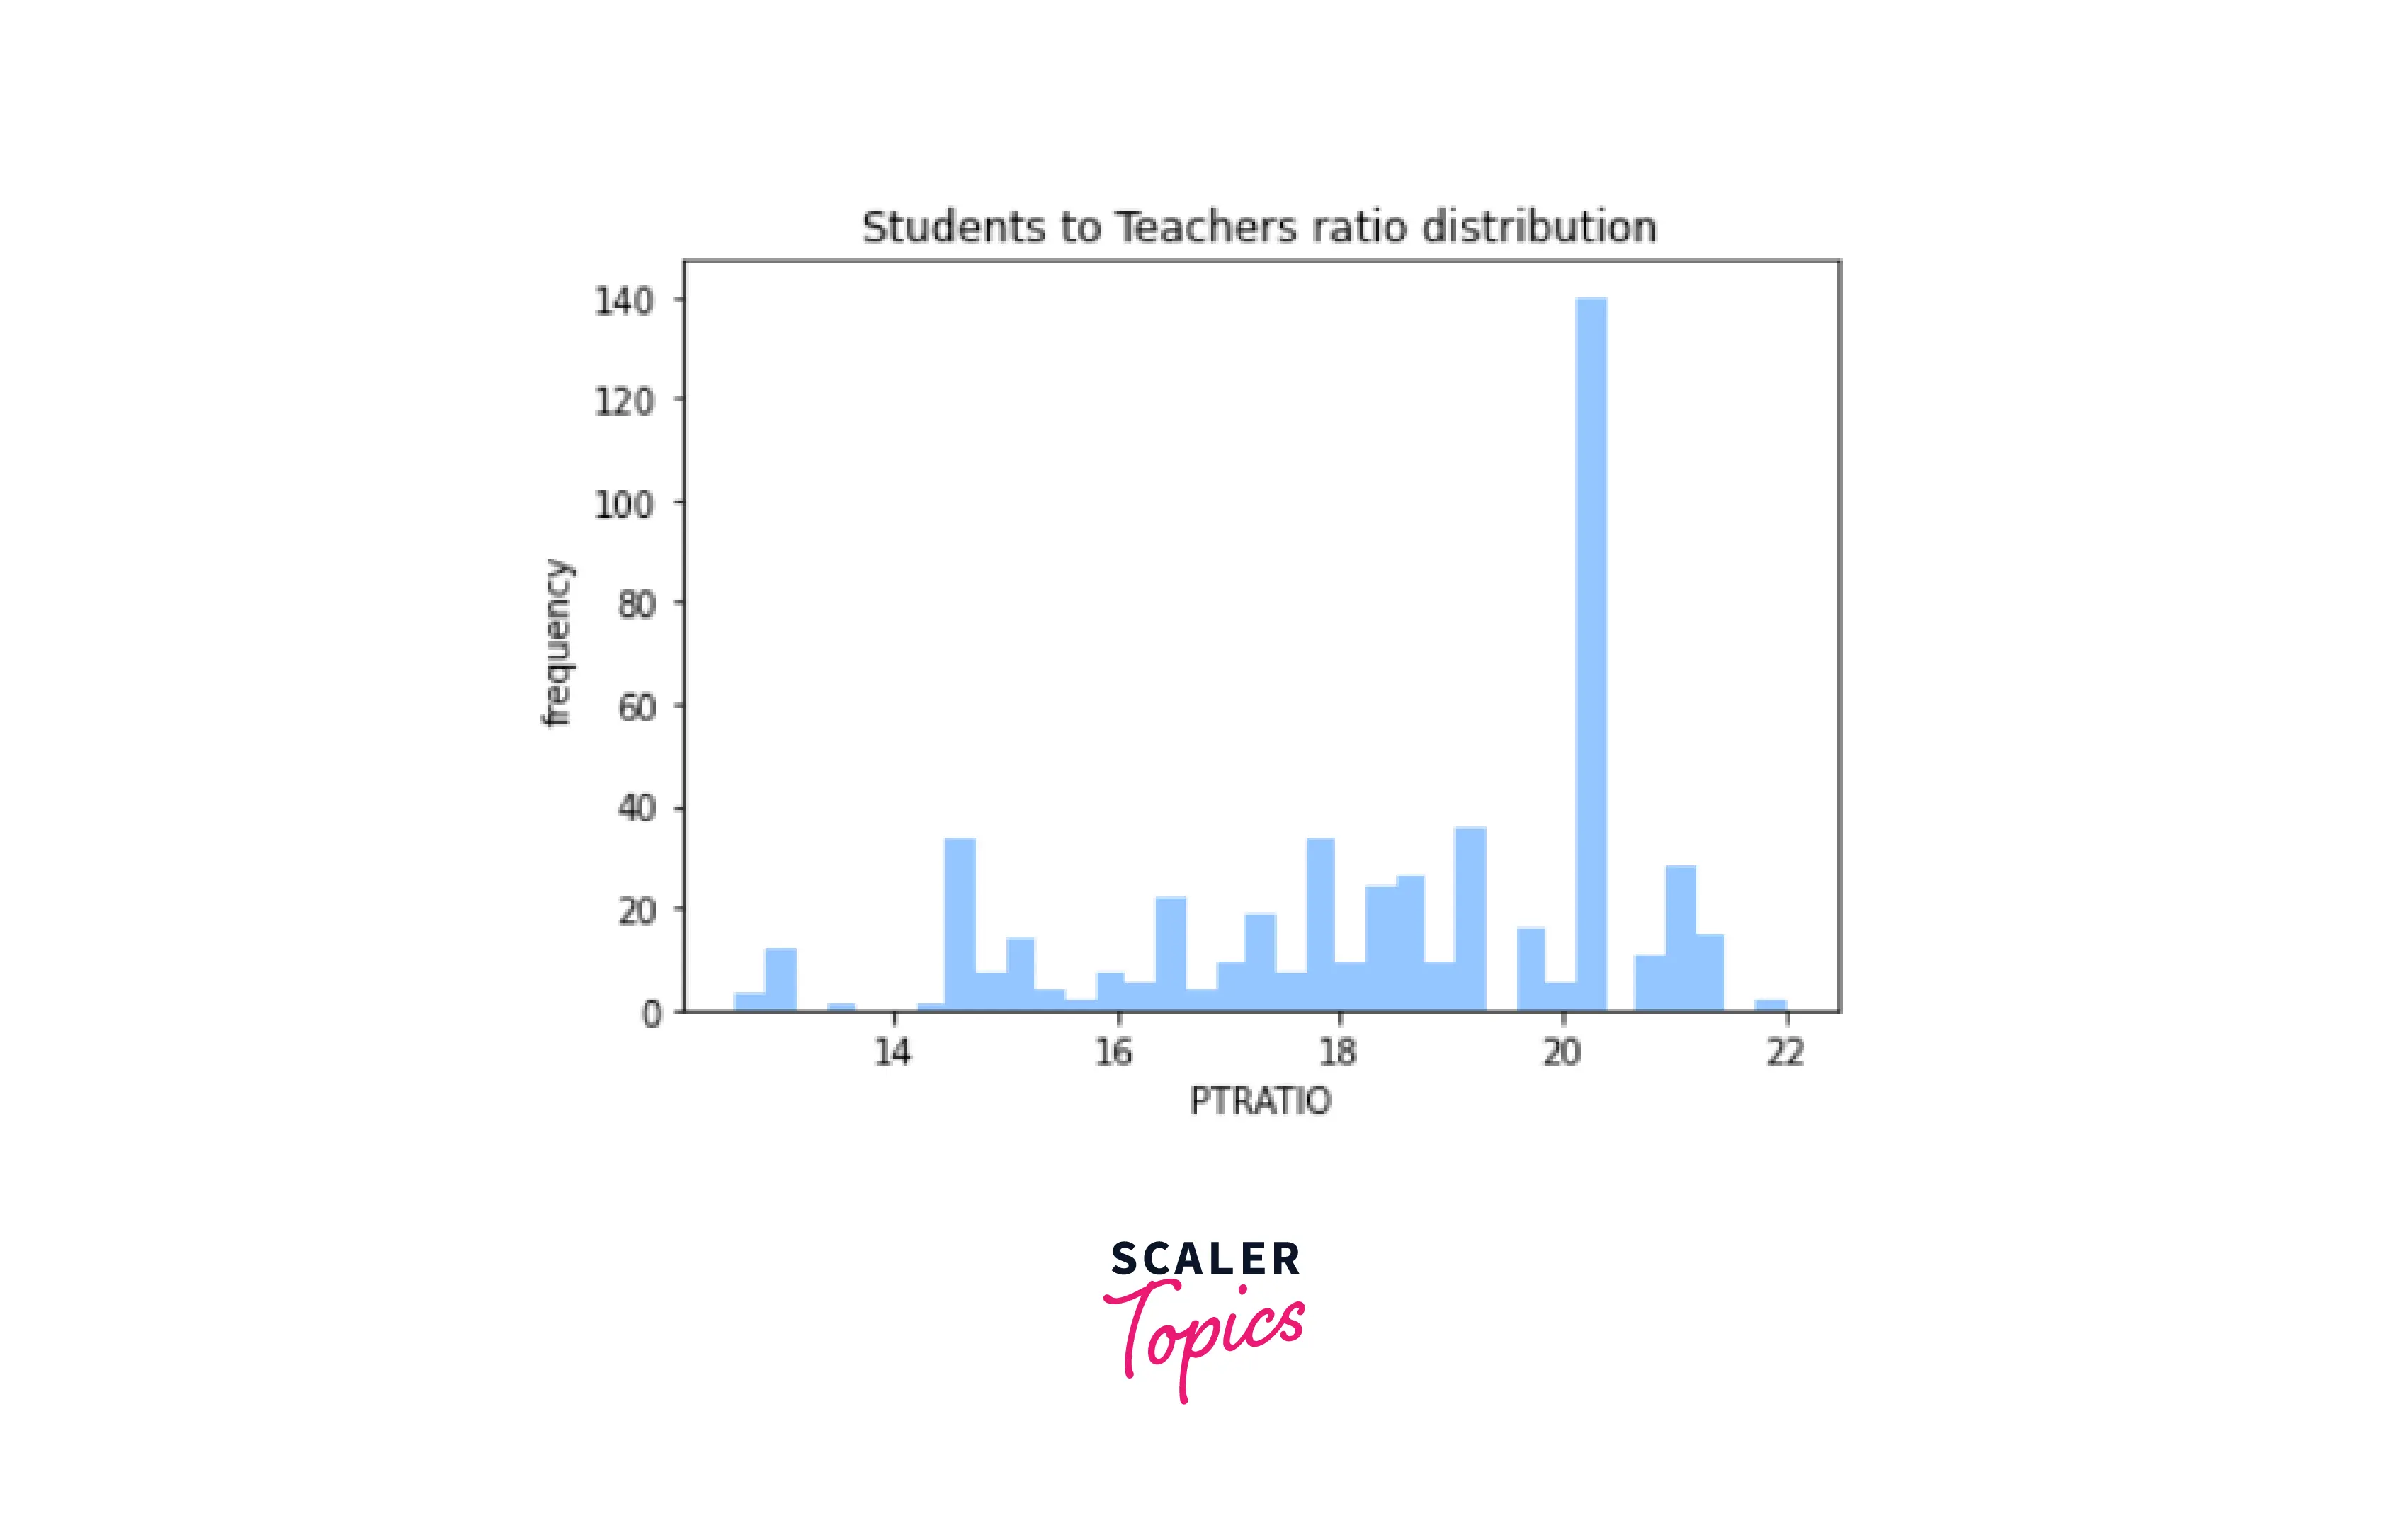
- PTRATIO - Student — Teacher Ration
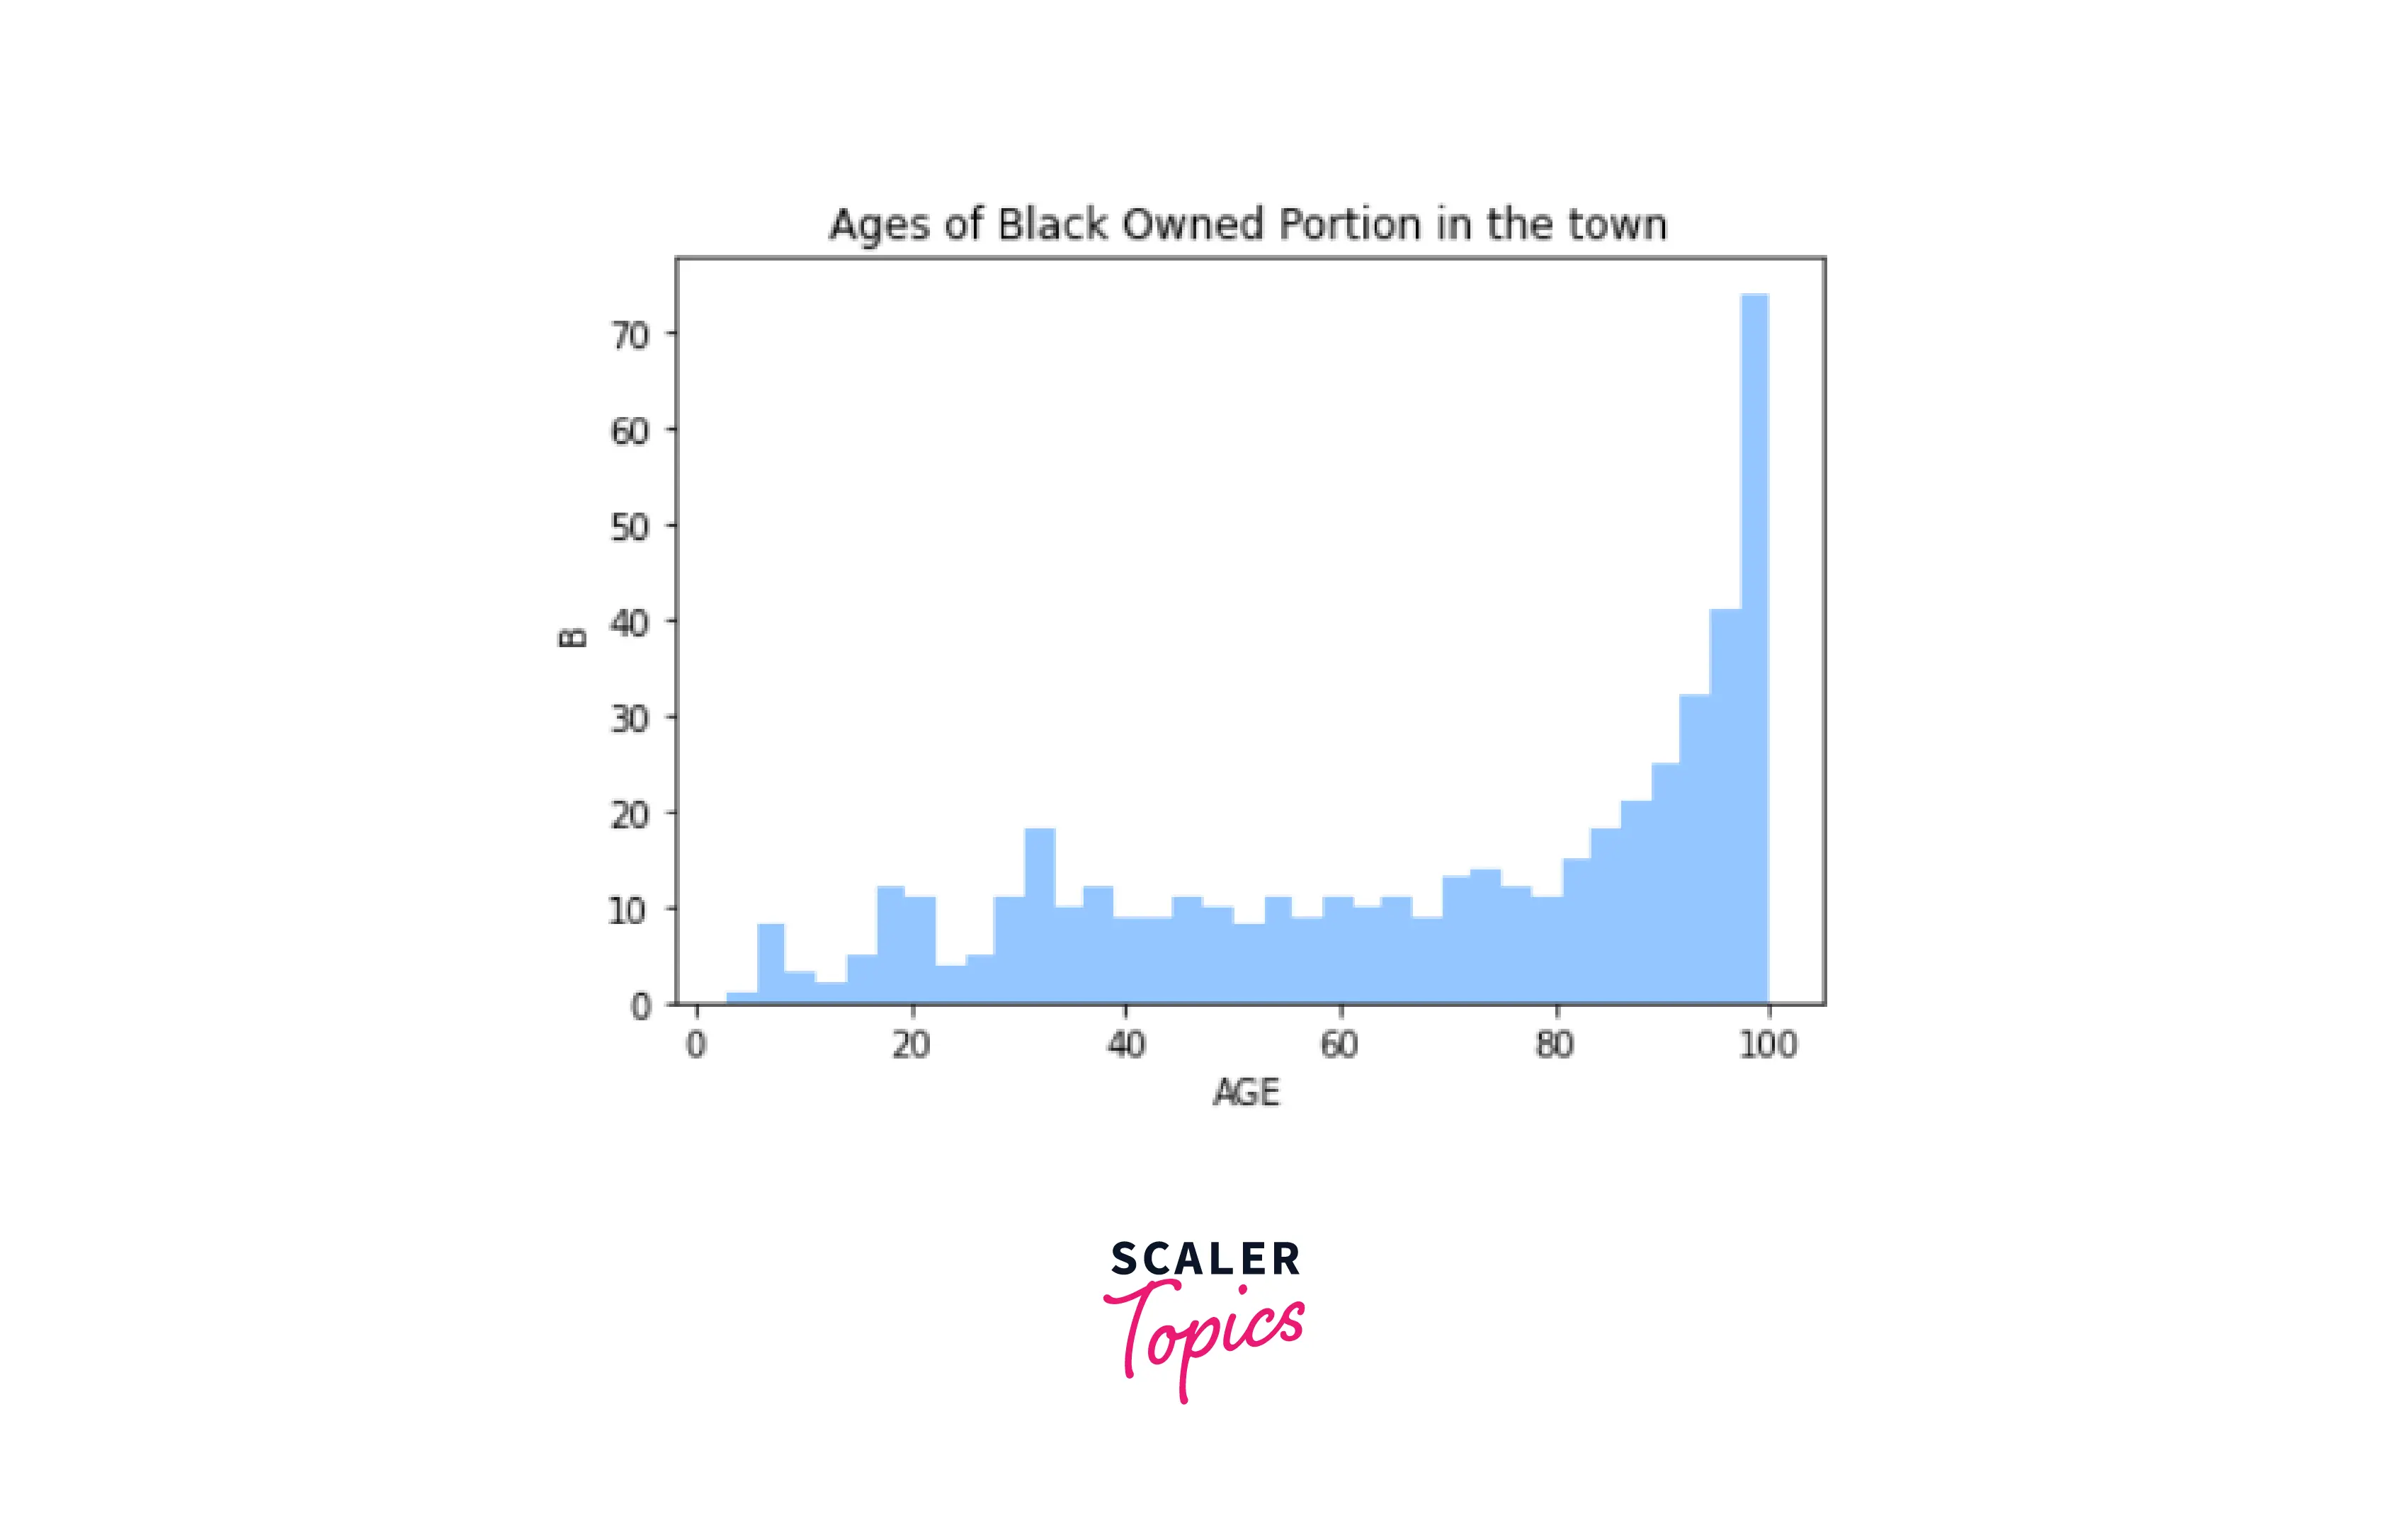
- B - Proportion of people of African American descent
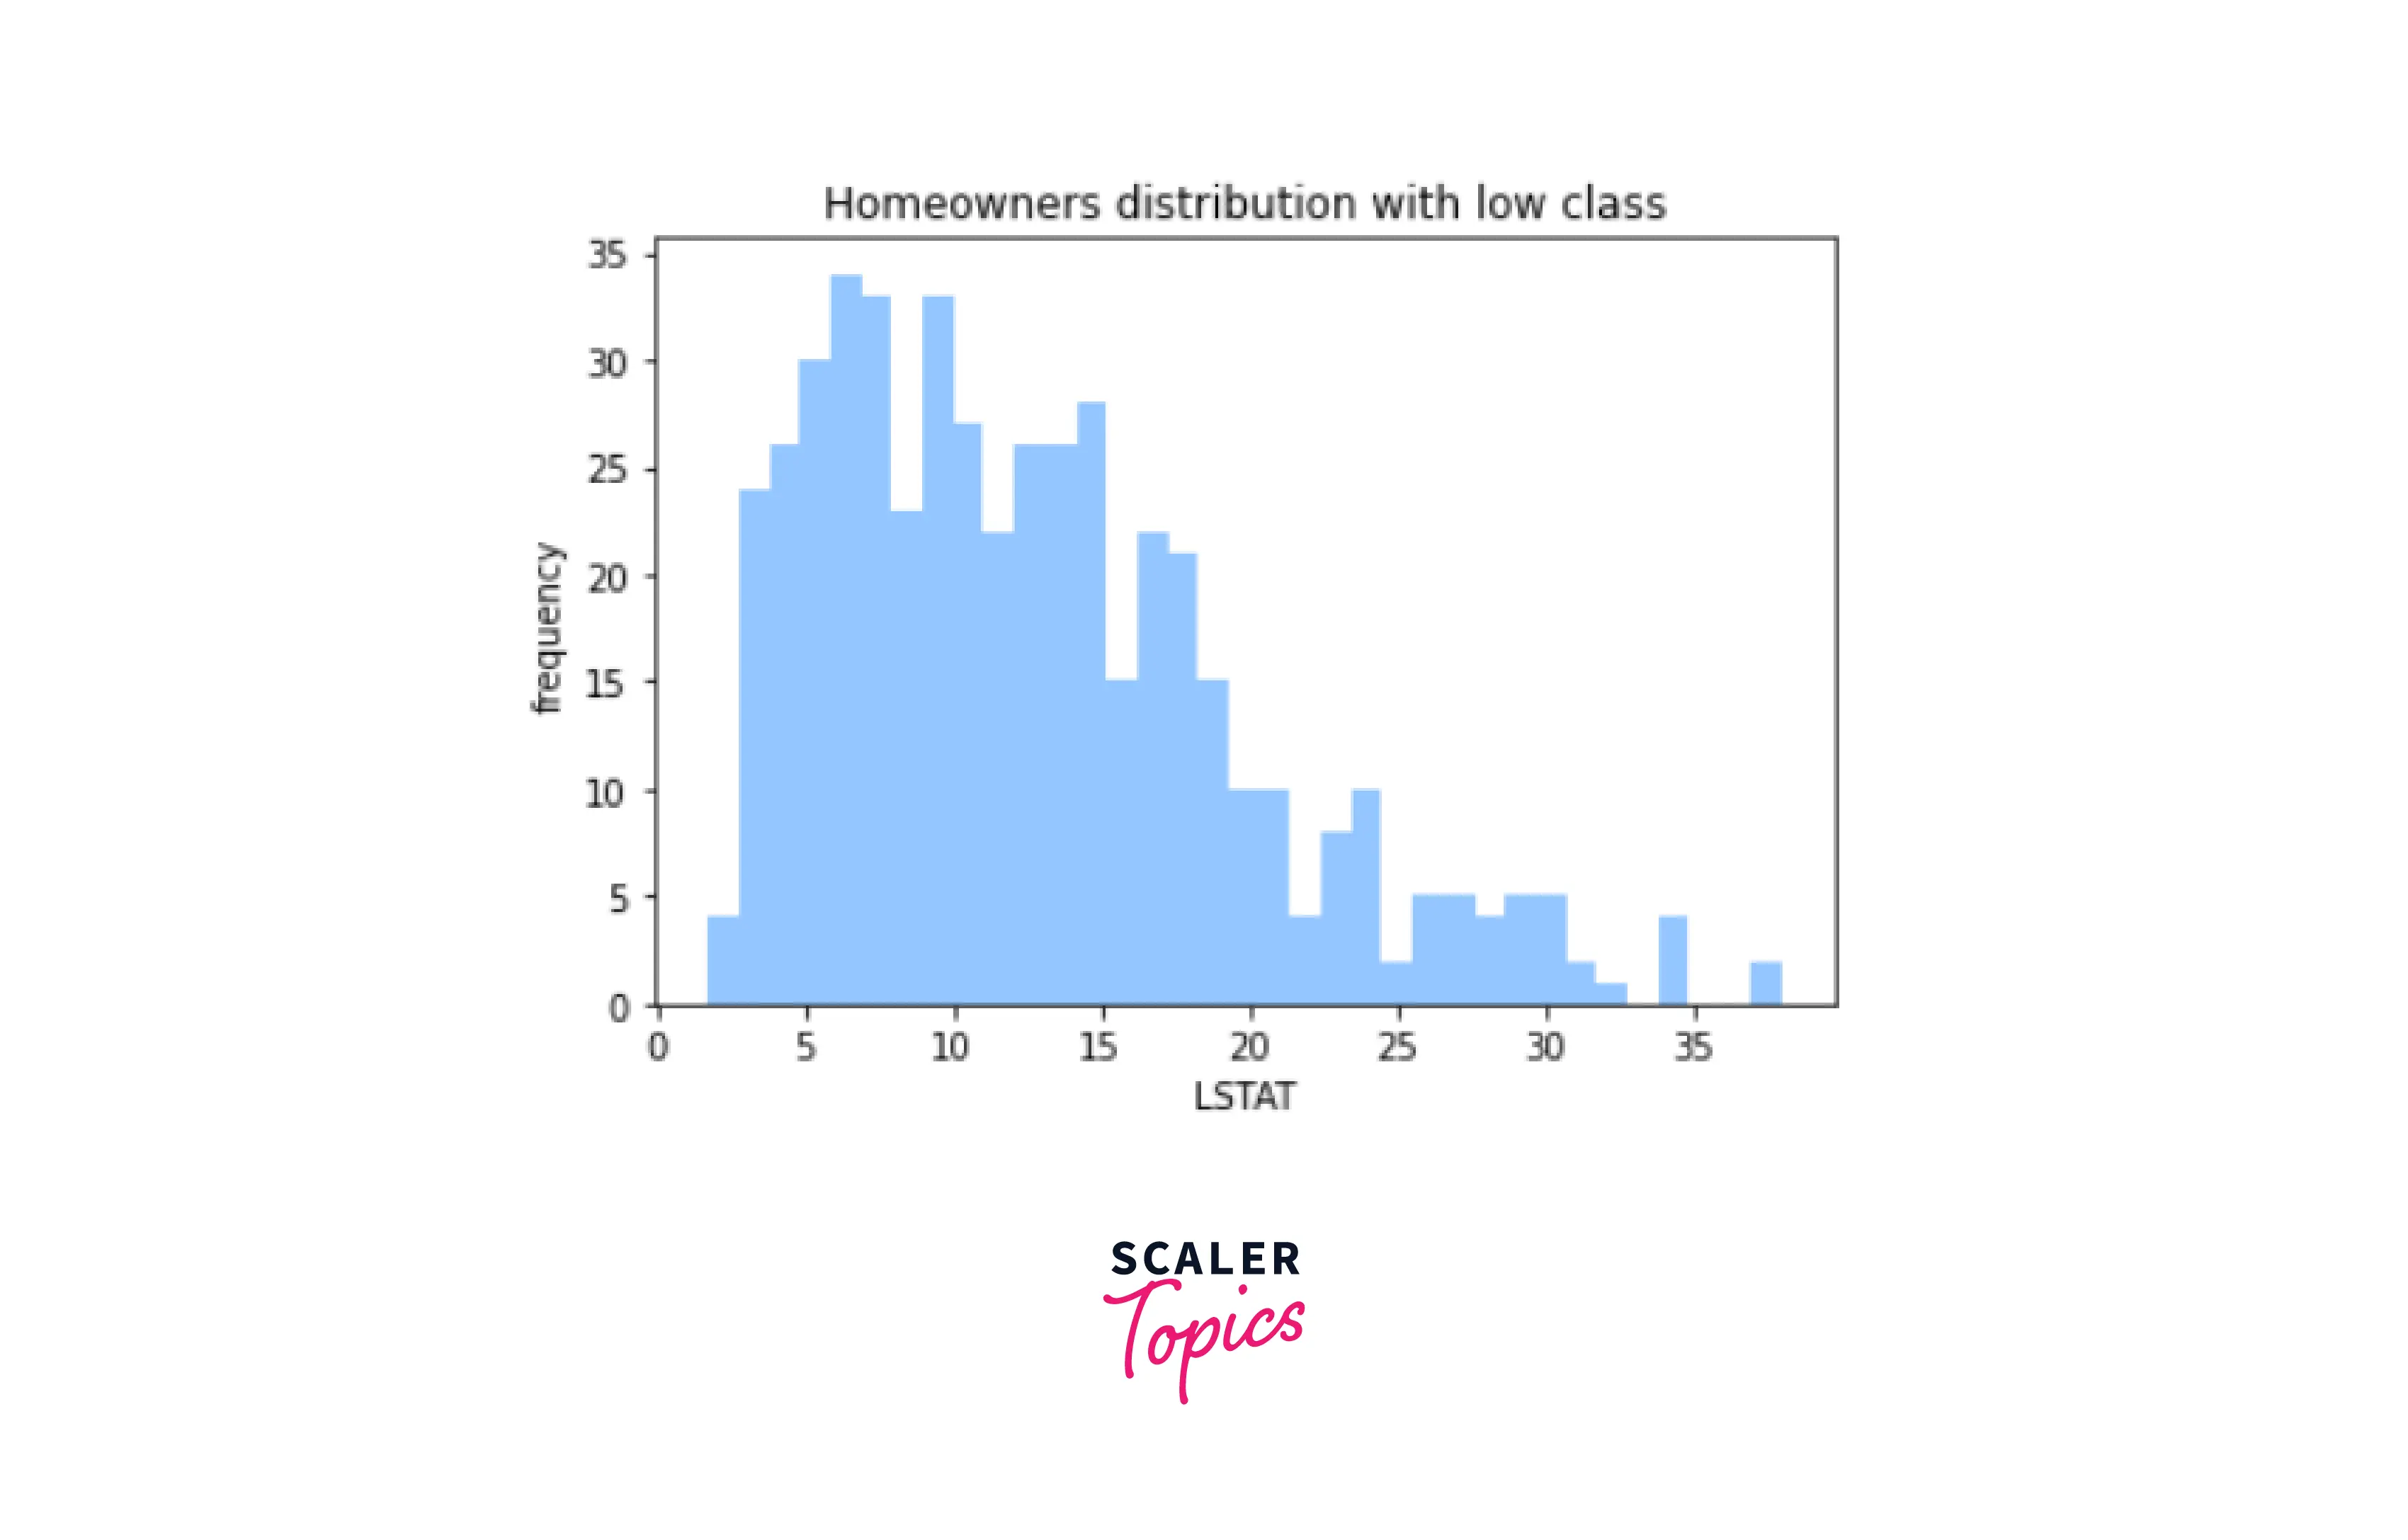
- LSTAT - Percentage of Lower Status of the Population
- MEDV - Median value of owner-occupied homes in $1000, i.e., Price of the property
Understanding the Problem Statement
Here, the goal is to build a model that can predict the price of a property based on parameters like crime rate, age of the property, air quality, etc.
Algorithms
We have used three algorithms -
-
Logistic Regression An algorithm for classifying the data is logistic regression. It is applied to predict a binary outcome based on several independent factors.
-
Decision Tree Classifier A supervised learning technique named a decision tree can be used to tackle classification and regression problems and is usually preferred. It is a tree-structured classifier, where internal nodes stand in for a dataset's features, branches for decision-making, and each leaf node for the classification result.
-
Random Forest A "forest" is created by growing and combining various decision trees using the supervised machine learning method Random Forest. The Random Forest model is based on the idea that several uncorrelated models (the various decision trees) work significantly better together than they do separately.
Building the Project
- Load the data
Output-
- Data Analysis
Output-
Output-
Output-
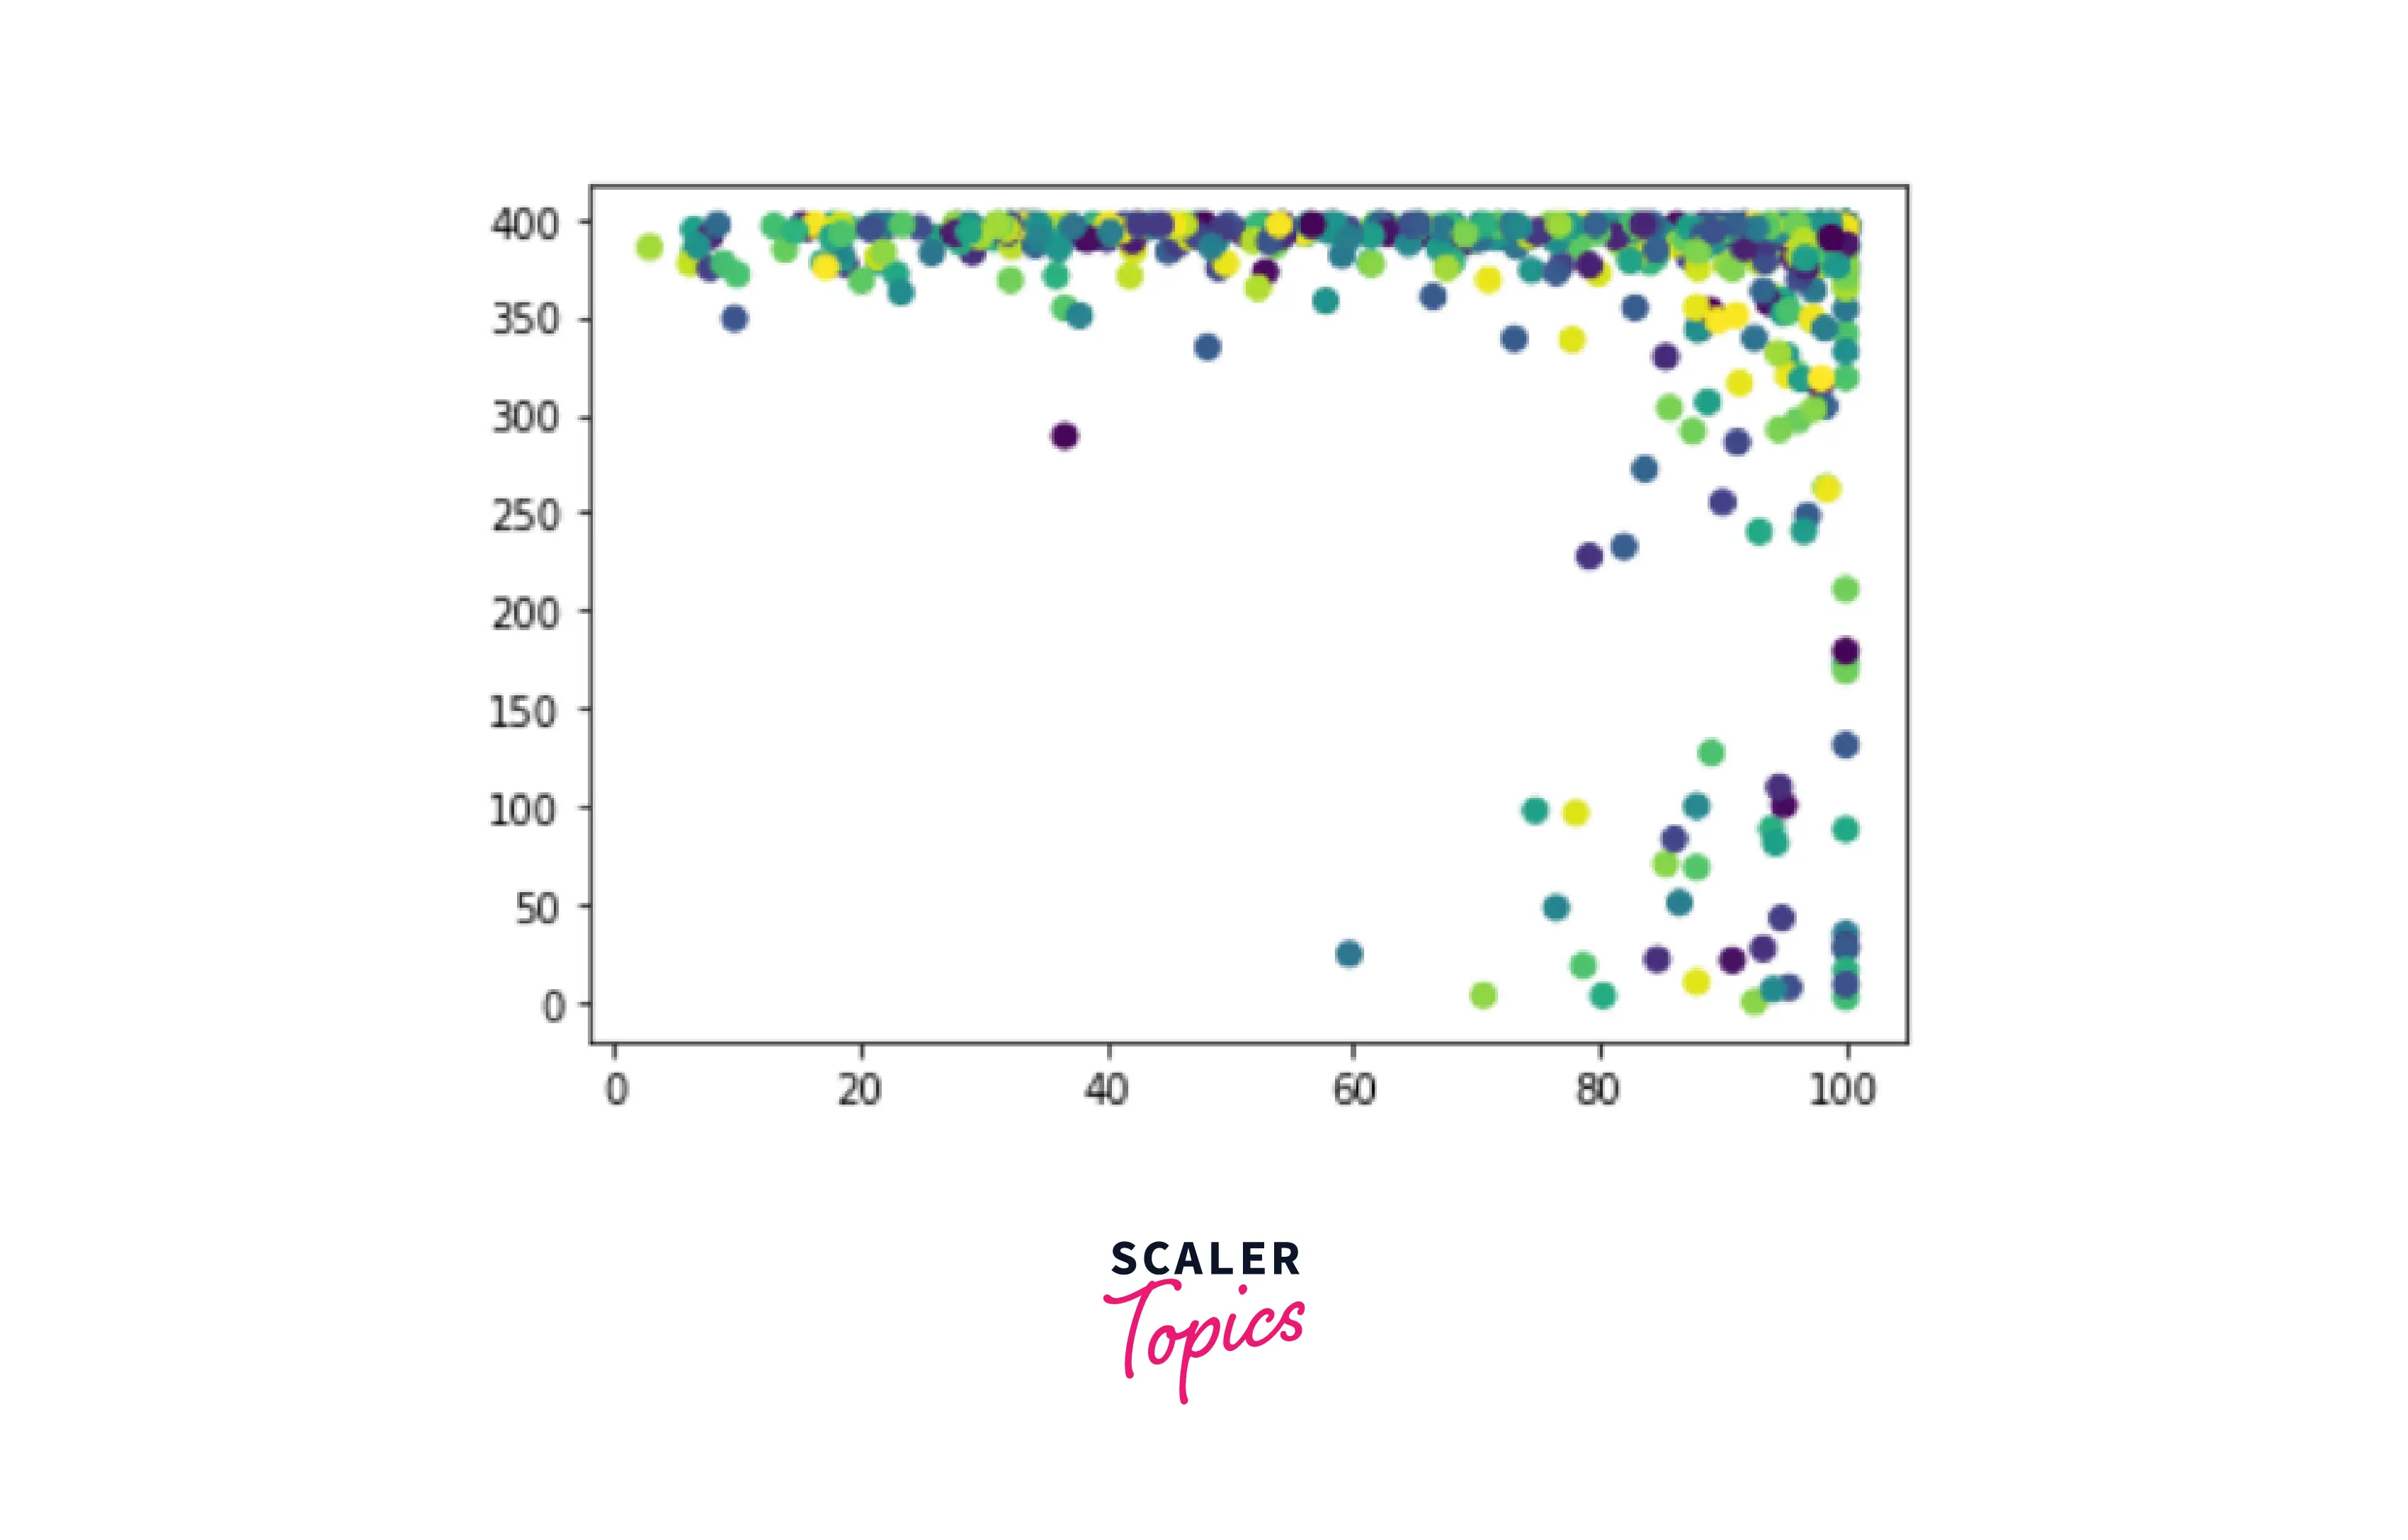
- Data Visualisation
Output-
Output-
Output-
Output-
Output-
Output-
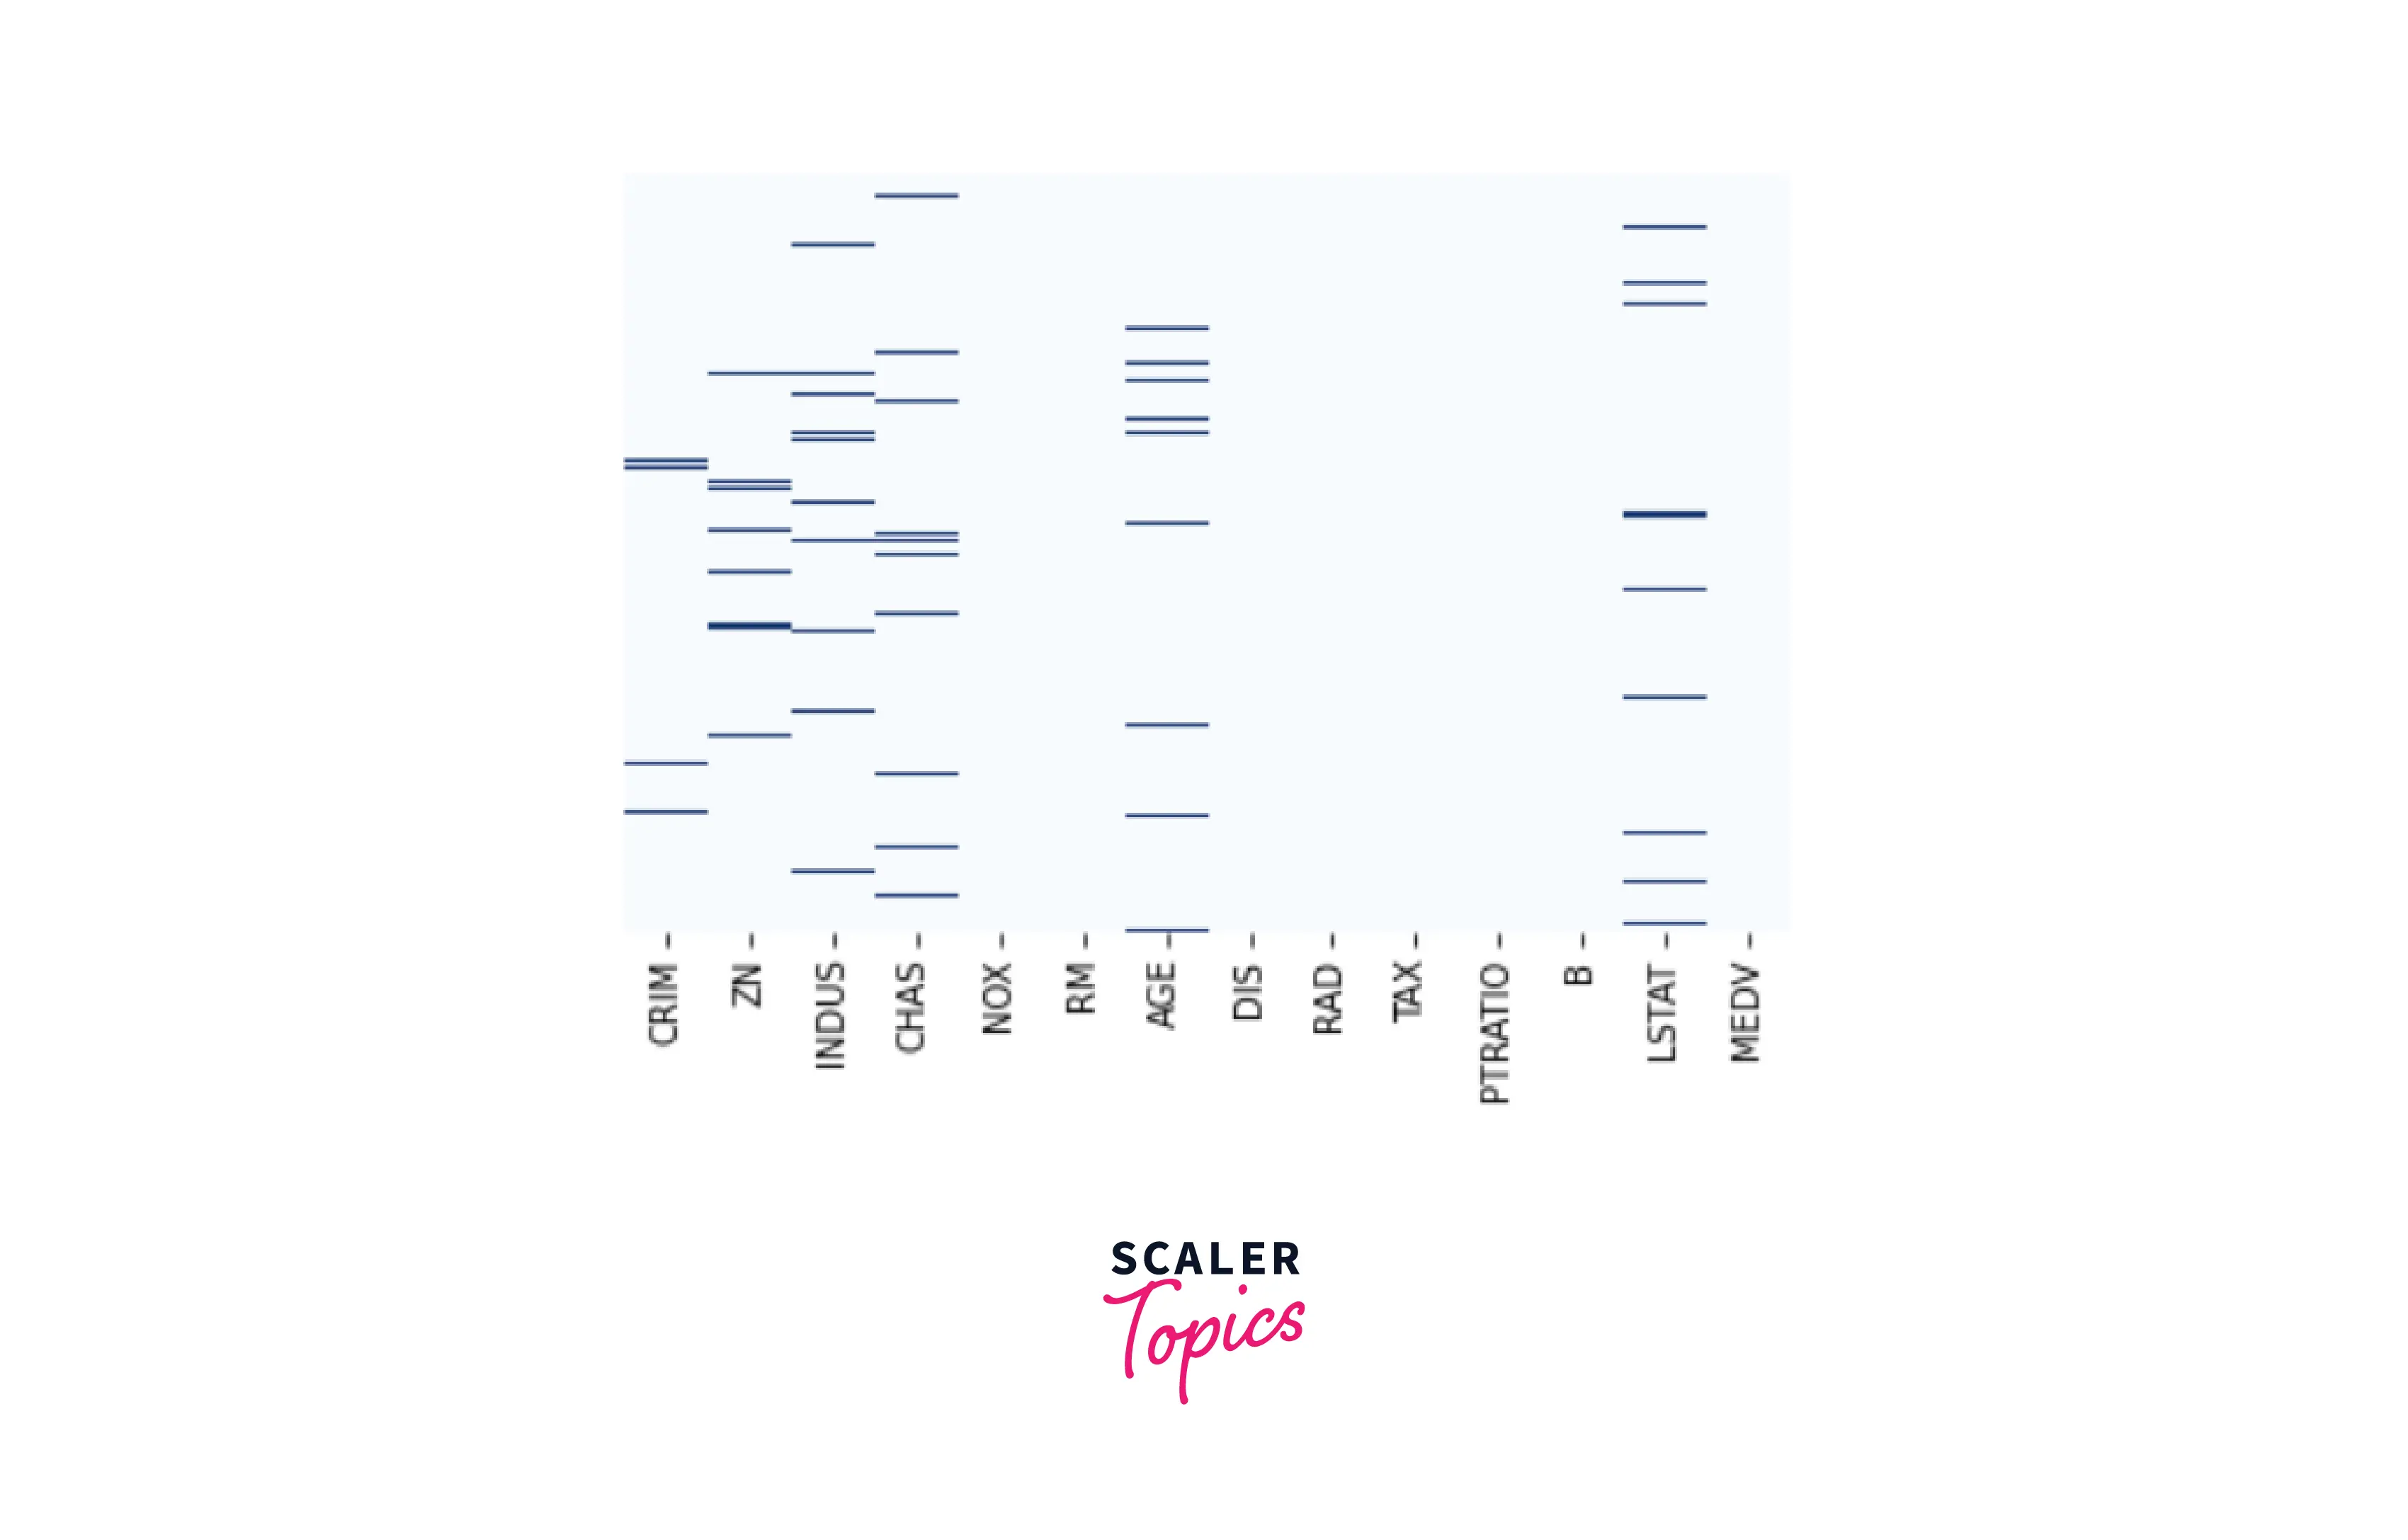
- Data Cleaning
Output-
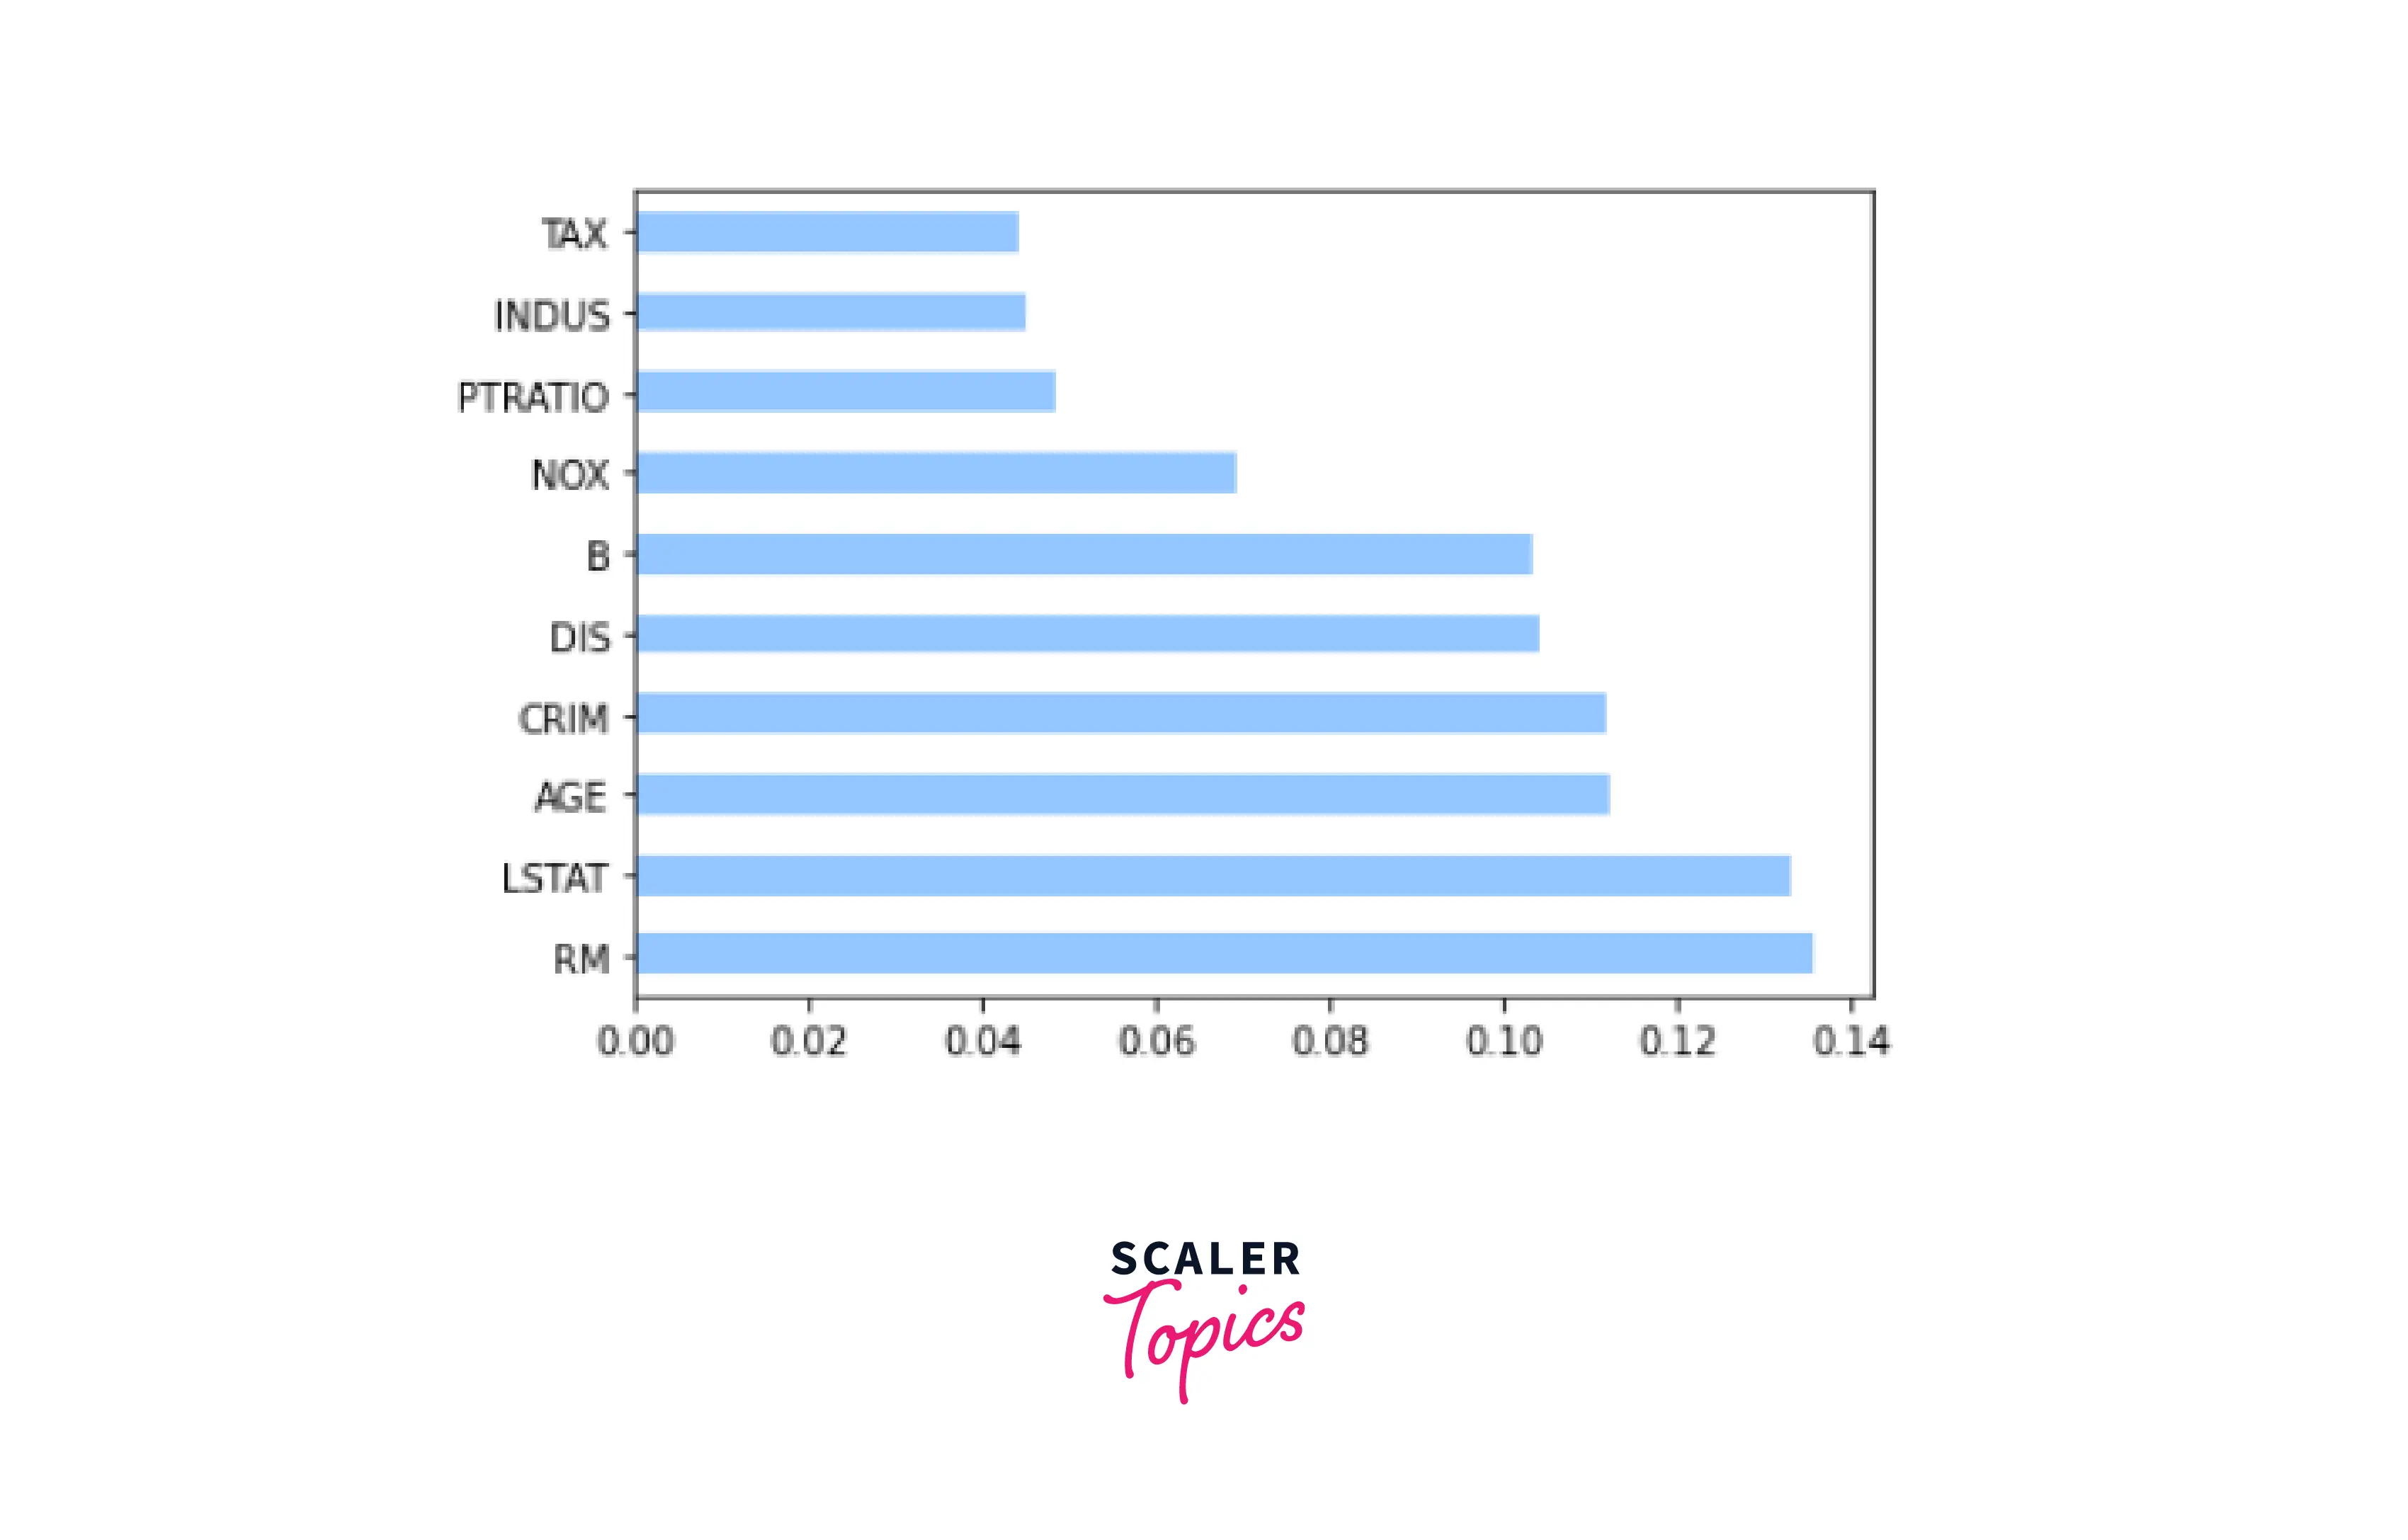
- Feature Engineering
Output-
Output-
Output-
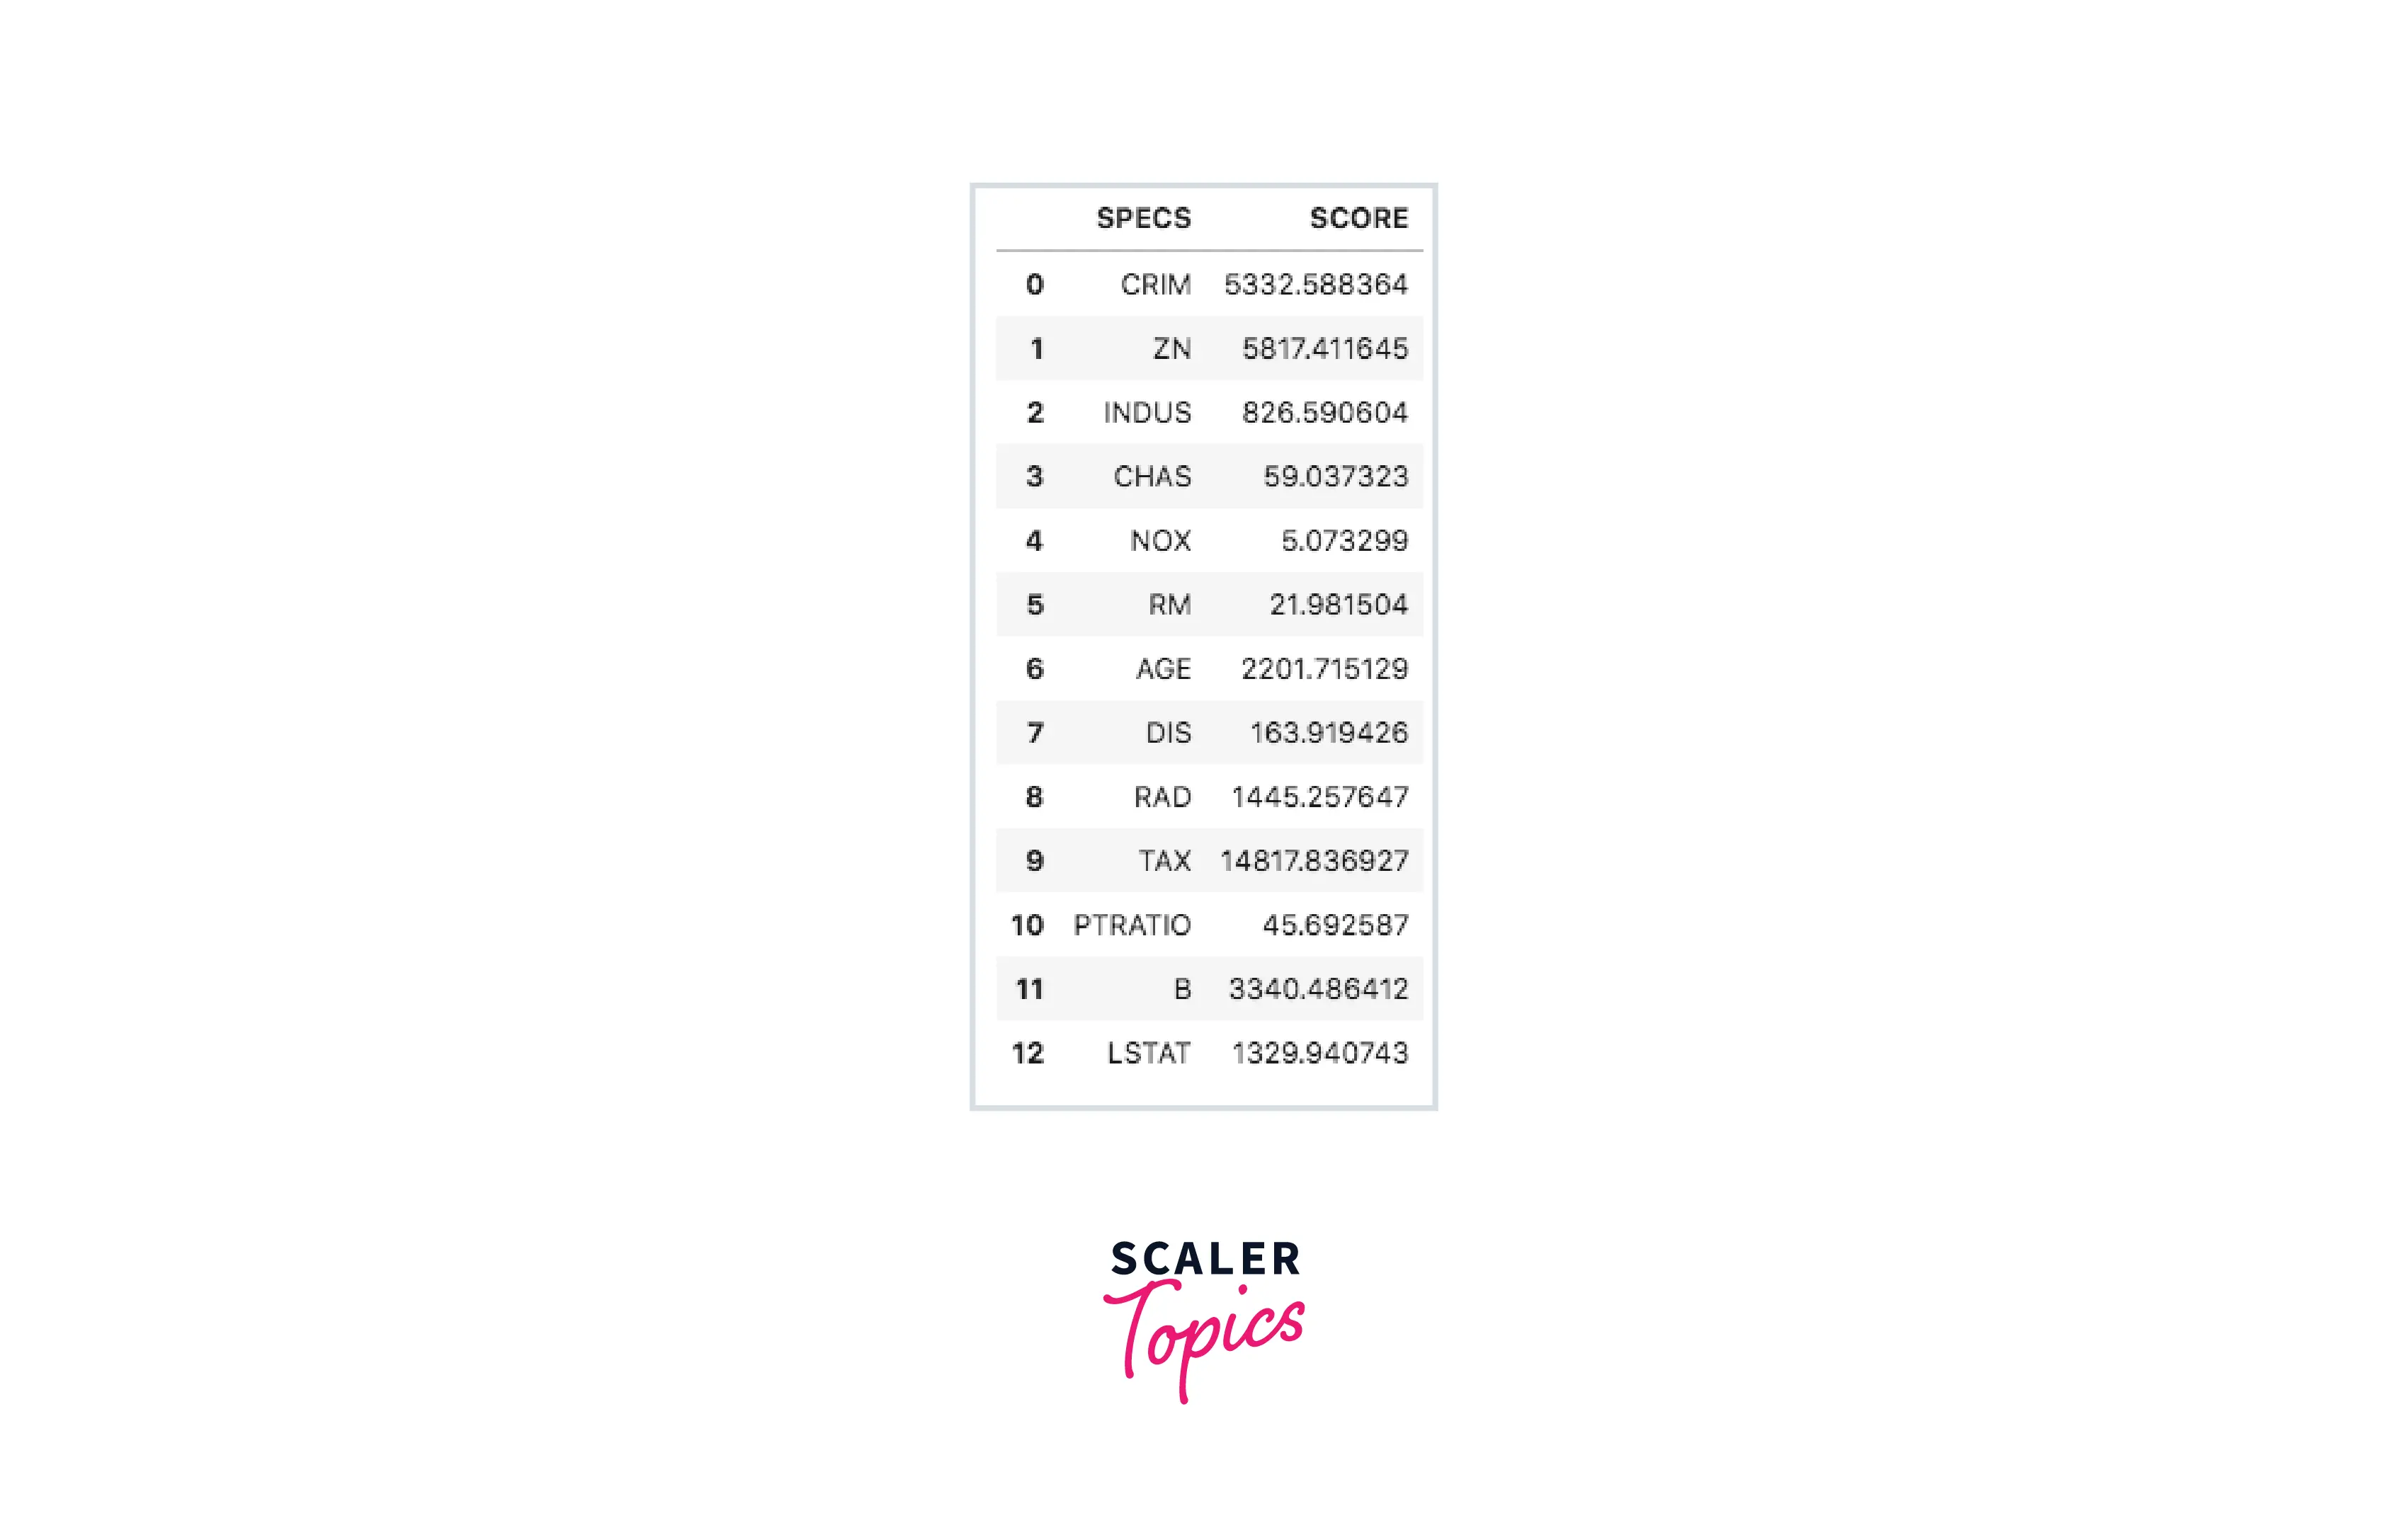
Output-
Output-
- Train the model
Output-
- Model evaluation
Output-
Output-
- Model Testing
Output-

Output-
Output-
Output-
Output-
Output-
Scaler Placement Report and Statistics
Scaler learners achieved 2.5x salary growth with average post-Scaler CTC reaching ₹23L.
What’s next
To enhance this project further -
- Web Implementation - Flask can be used to have an interface
- Models - Here, we have used three models, other models can be tried out to improve accuracy further
Conclusion
- Boston House Price prediction is the best regarding working on numeric data.
- In this project, the best accuracy was that of Random Forest at 93%.