Classification Models | F-Β Score
Transform Your Career
Choose from our industry-leading programs designed for career success
Modern Software and AI Engineering Program
Master full-stack development with AI integration

Modern Data Science and ML with specialisation in AI
Advanced data science techniques with AI specialization
Advanced AIML with Specialisation in Agentic AI
Deep dive into AIML with focus on Agentic systems
DevOps, Cloud & AI Platform Engineering
Build and manage AI-powered cloud infrastructure
AI Engineering Advanced Certification by IIT-Roorkee
Premier AI engineering certification from IIT-Roorkee
Overview
Machine Learning can be called the cornerstone of Artificial Intelligence. It is the technique using which we can make the computer work on its own without being specifically programmed. We feed data into the Machine Learning model, which performs various instances of computations, and with every instance, the precision and accuracy of the model are maximized.
According to various MAANG Data Scientists, "One crucial reason why data scientists need Machine Learning is that without much human involvement, its high-value and precise predictions can direct wiser decisions and quick actions in the present." Knowing this, let us deep dive into one of the most important metrics in classification models; the F-1 and F-beta scores in Machine Learning.
Pre-requisites
Before going further in this article, the reader must be familiar with the basics of classification metrics, such as:
- Precision: Percentage of positive predictions that belong to the positive class.
- Recall: Percentage of all the positive class samples in the dataset that are predicted correctly.


Introduction
As we discussed earlier in this article, error calculation metrics are very important when it comes to Classification Problems in Machine Learning because they improve the performance of our models by providing insight into how well they are able to classify the data. The main aim of Machine Learning models is to take note of the metrics and further improve themselves.
Python supplies many categorization metrics to assist us in determining the ideal setups for our machine-learning models to serve this function. In this article, we will unravel F-1 and F-beta scores, their importance, and how they are implemented to get the best out of any classification Machine Learning model.
Scaler Placement Report and Statistics
Scaler learners achieved 2.5x salary growth with average post-Scaler CTC reaching ₹23L.
The F-1 Score
The F-1 Score is a very popular choice amongst Machine Learning developers, as it uses the two most reliable sources of accuracy; precision and recall.
As discussed earlier, the F1 score is made up of two variables:
- Precision Percentage of positive predictions that belong to the positive class.
- Recall Percentage of all the positive class samples in the dataset that are predicted correctly.
Now that we have learned about the F-1 score, let us dive into the much-generalized version of the F-1 Score; F-beta score.
The F-β Score
The F-beta score is a step up to the F-1 score, as it enables us to choose how to balance precision and recall using the beta parameter. The beta (β) represents the harmonic mean between precision and recall.
As we can see, the beta variable is very influential. If the beta value is 1, then the F-β score will be equal to the F-1 score. If the beta is 0.5, then the F-β would be slightly more than the F-1 score.
Turn Learning into Career Growth
Imbalanced Classification and F-β Scores
When working with F-1 and F-β scores, we might expect an anomaly sometimes. As we know, F-β score is supposed to be an upgrade over F-1 score, but it is not the case in certain scenarios. Let us understand this in-depth using an example.
For illustration, let us take the Titanic Dataset. We will create our Machine Learning model using Logistic Regression. Since the problem statement asks us to predict one dependent variable, Logistic Regression would be a wise choice.
In the code above, we use NumPy to create linearly spaced elements, and with the help of these elements, we create various probability thresholds. These thresholds will help us to plot various probabilities regarding the different scores.
Output
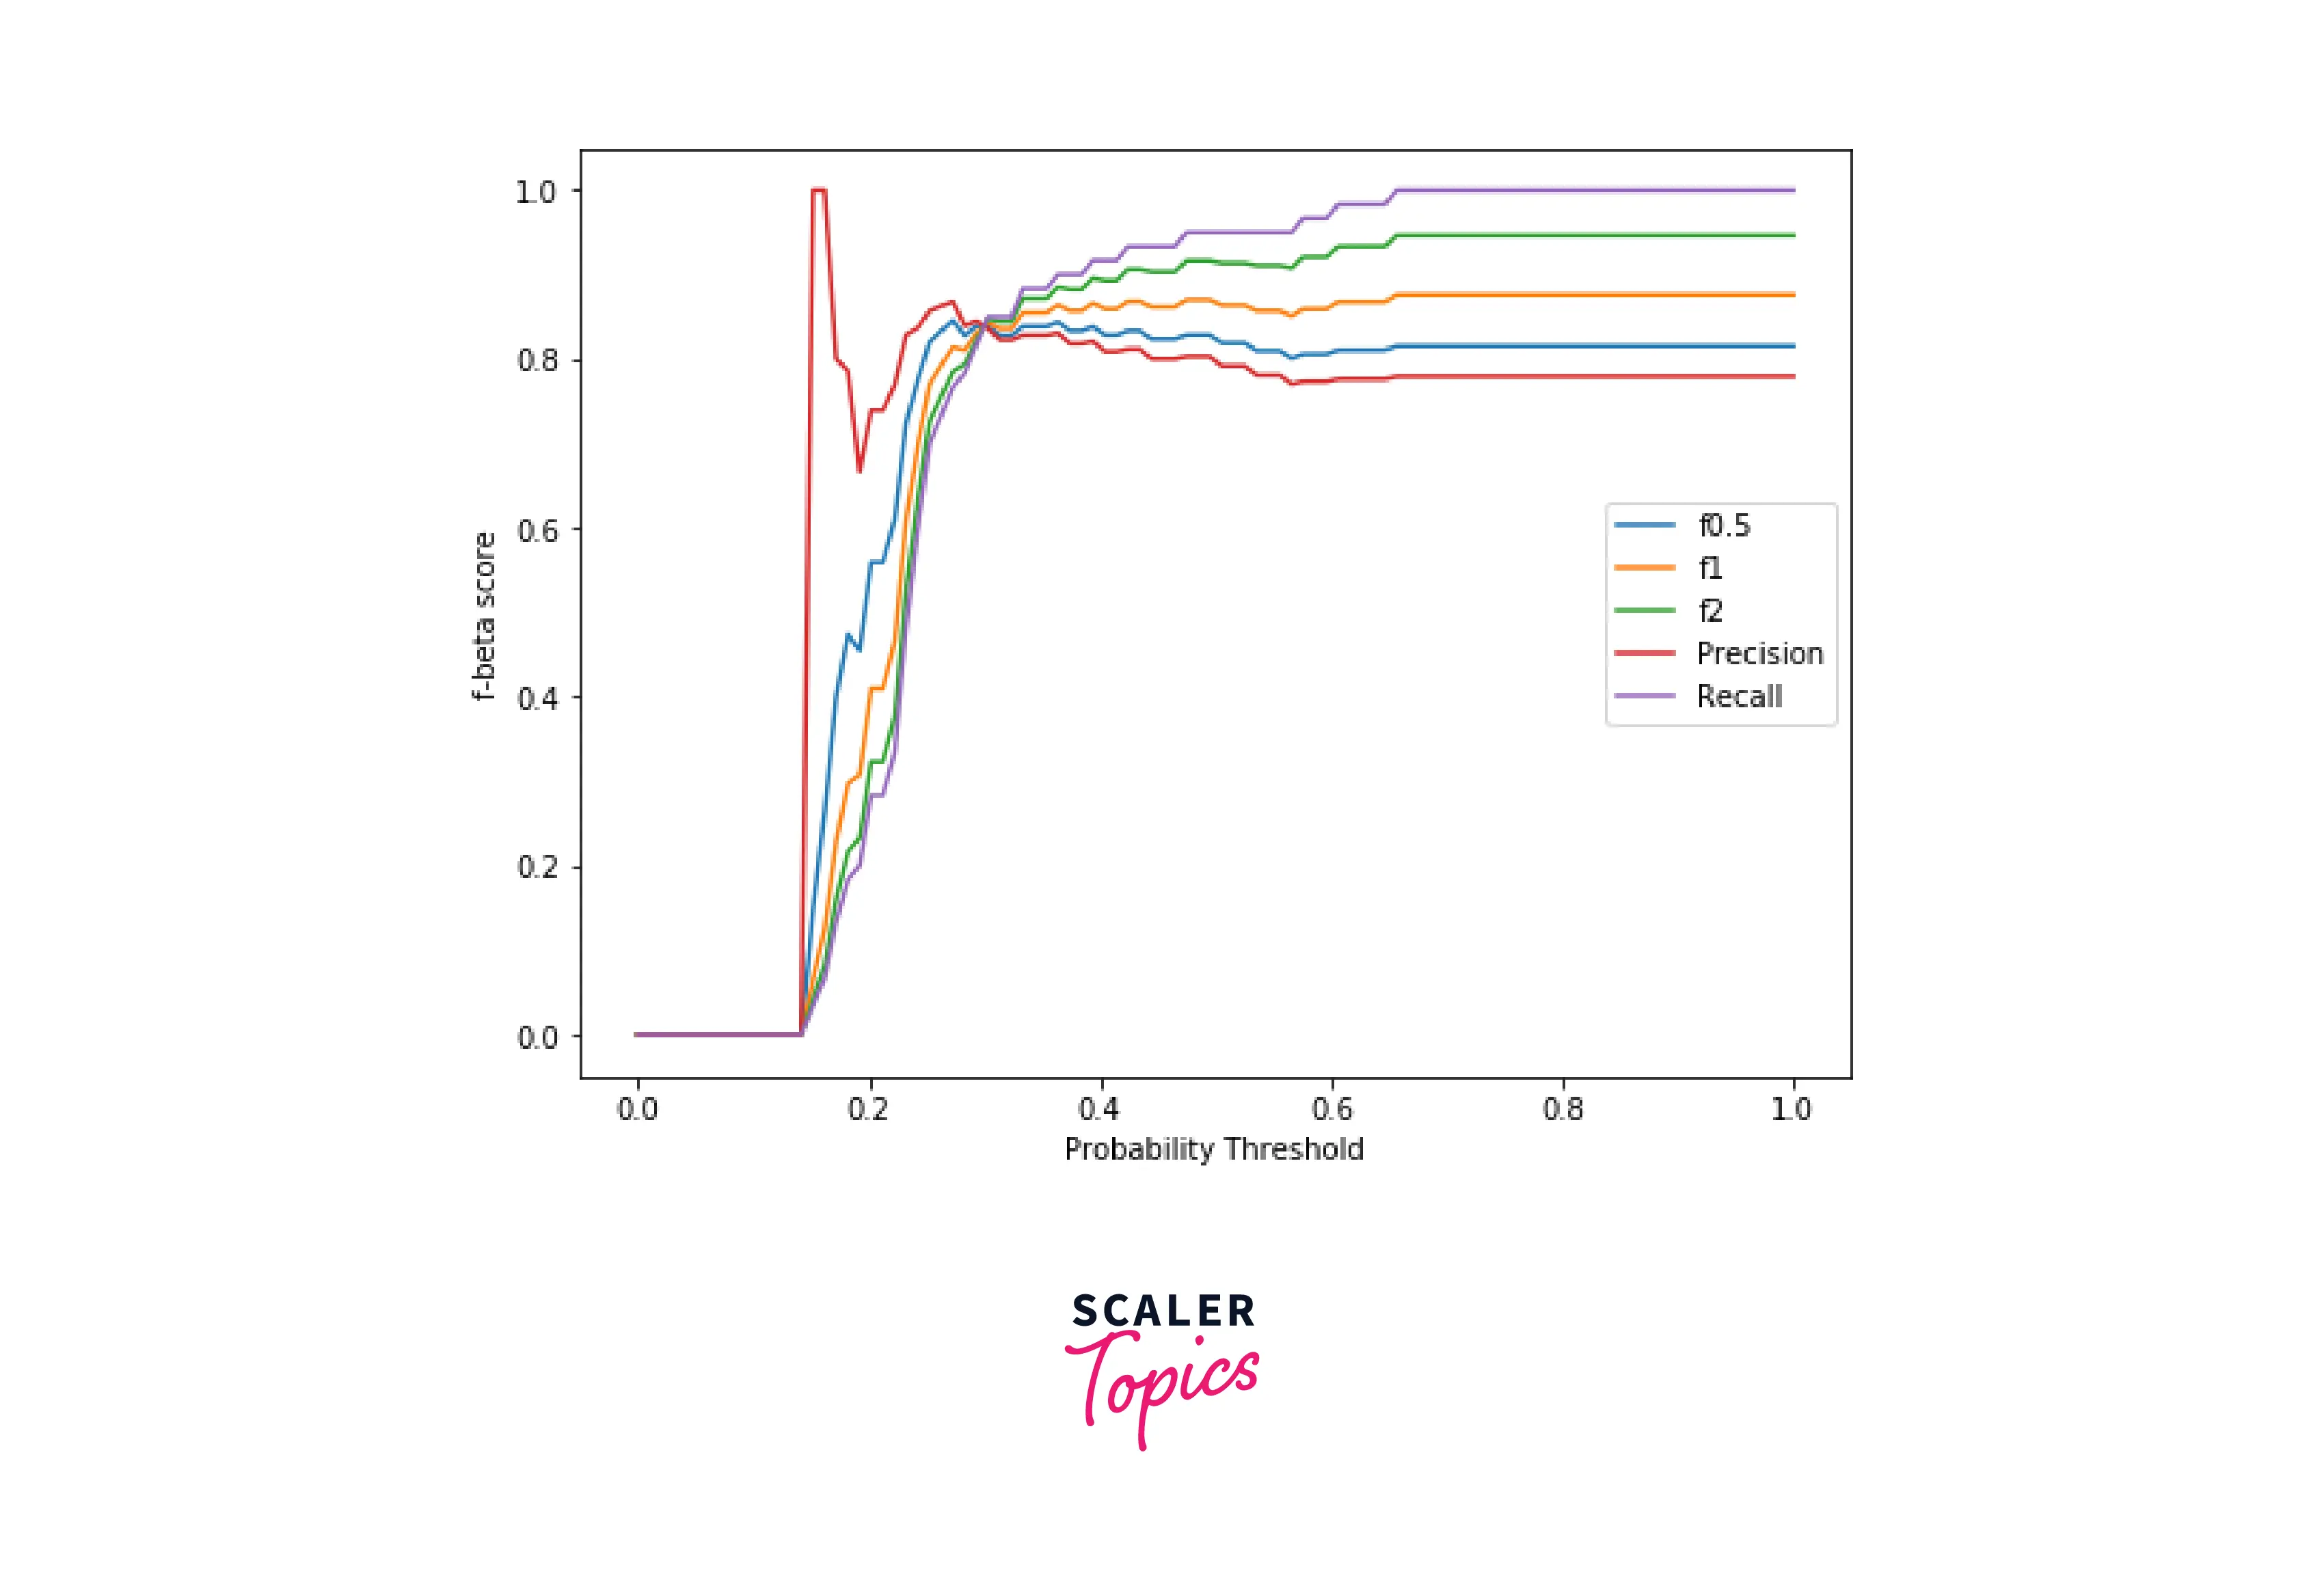
As we can see, recall is the metric with the highest f-beta score and precision is the metric with the lowest f-beta score. Although the F0.5, F1, and F2 curves are quite similar in shape, they have different values. Hence, the question arises; How can we choose the beta value to get better results?
If we want to prioritize minimizing false positives over reducing false negatives, we must select a beta value less than 1, since precision would have more influence over recall. When precision has more influence, the model will be more selective in making a positive prediction, minimizing false positives.
Conversely, to minimize false negatives rather than minimizing false positives, we must select the beta value to be more than 1. In this case, recall would be given more importance than precision. Hence the model tries to get as many positive samples as it can and, in doing so, minimizes false negatives.
Applying the concepts we learned above, we can safely say that amongst the F scores, F2 would be a great choice for the Titanic Dataset.
Code Implementation
In this section, we will calculate the F-beta score using Python. The Machine Learning algorithm that we will use is the DecisionTree classifier. The Decision Tree classifier is an optimal choice when working with smaller datasets. Learn more about Decision Tree classifiers here (insert link).
Output
Conclusion
- In this article, we learned about F-1 and F-β score; their definitions, importance, and why they are used in classification problems regarding Machine Learning.
- We have also discussed the Imbalance Classification problem that programmers sometimes face.