Machine Learning Algorithms Cheat Sheet
Overview
Machine Learning can be considered one of the most promising and anticipated fields in Computer Science. With the help of previous data, Machine Learning tries to enable a computer to learn new things independently. The Machine Learning model receives data, executes a variety of computations, and maximizes the precision and accuracy of the model. The primary tasks in Machine Learning include image segmentation, speech recognition, and recommender systems.
This Machine Learning Cheatsheet will look at various algorithms and their definitions.
Transform Your Career
Choose from our industry-leading programs designed for career success
Modern Software and AI Engineering Program
Master full-stack development with AI integration

Modern Data Science and ML with specialisation in AI
Advanced data science techniques with AI specialization
Advanced AIML with Specialisation in Agentic AI
Deep dive into AIML with focus on Agentic systems
DevOps, Cloud & AI Platform Engineering
Build and manage AI-powered cloud infrastructure
AI Engineering Advanced Certification by IIT-Roorkee
Premier AI engineering certification from IIT-Roorkee
Machine Learning Cheat Sheet
Unsupervised Learning: Dimension Reduction
-
PCA (Principal Component Analysis)
Principal component analysis, or PCA, is a technique for reducing the number of dimensions in large data sets by condensing an extensive collection of variables into a smaller set that retains most of the extensive set's information.
Here are the five steps to conduct a successful PCA in Python:
- Standardize the range of continuous initial variables.
- Compute the covariance matrix to identify correlations.
- Compute the eigenvectors and eigenvalues of the covariance matrix to identify the principal components.
- Create a feature vector to decide which principal components to keep.
- Finally, Recast the data along the axes of the principal component.
To summarize, reducing the number of variables in a data set while retaining as much information as possible is the straightforward goal of PCA.
-
SVD (Singular Value Decomposition)
A matrix is divided into three different matrices by the SVD algorithm. In image processing, for instance, fewer vectors are employed to recreate images similar to the original. PCA and SVD can reduce the data dimension of a dataset. However, the SVD transforms the unusual data into three separate matrices that are simpler to manage and analyze, whereas PCA ignores the less critical components.
-
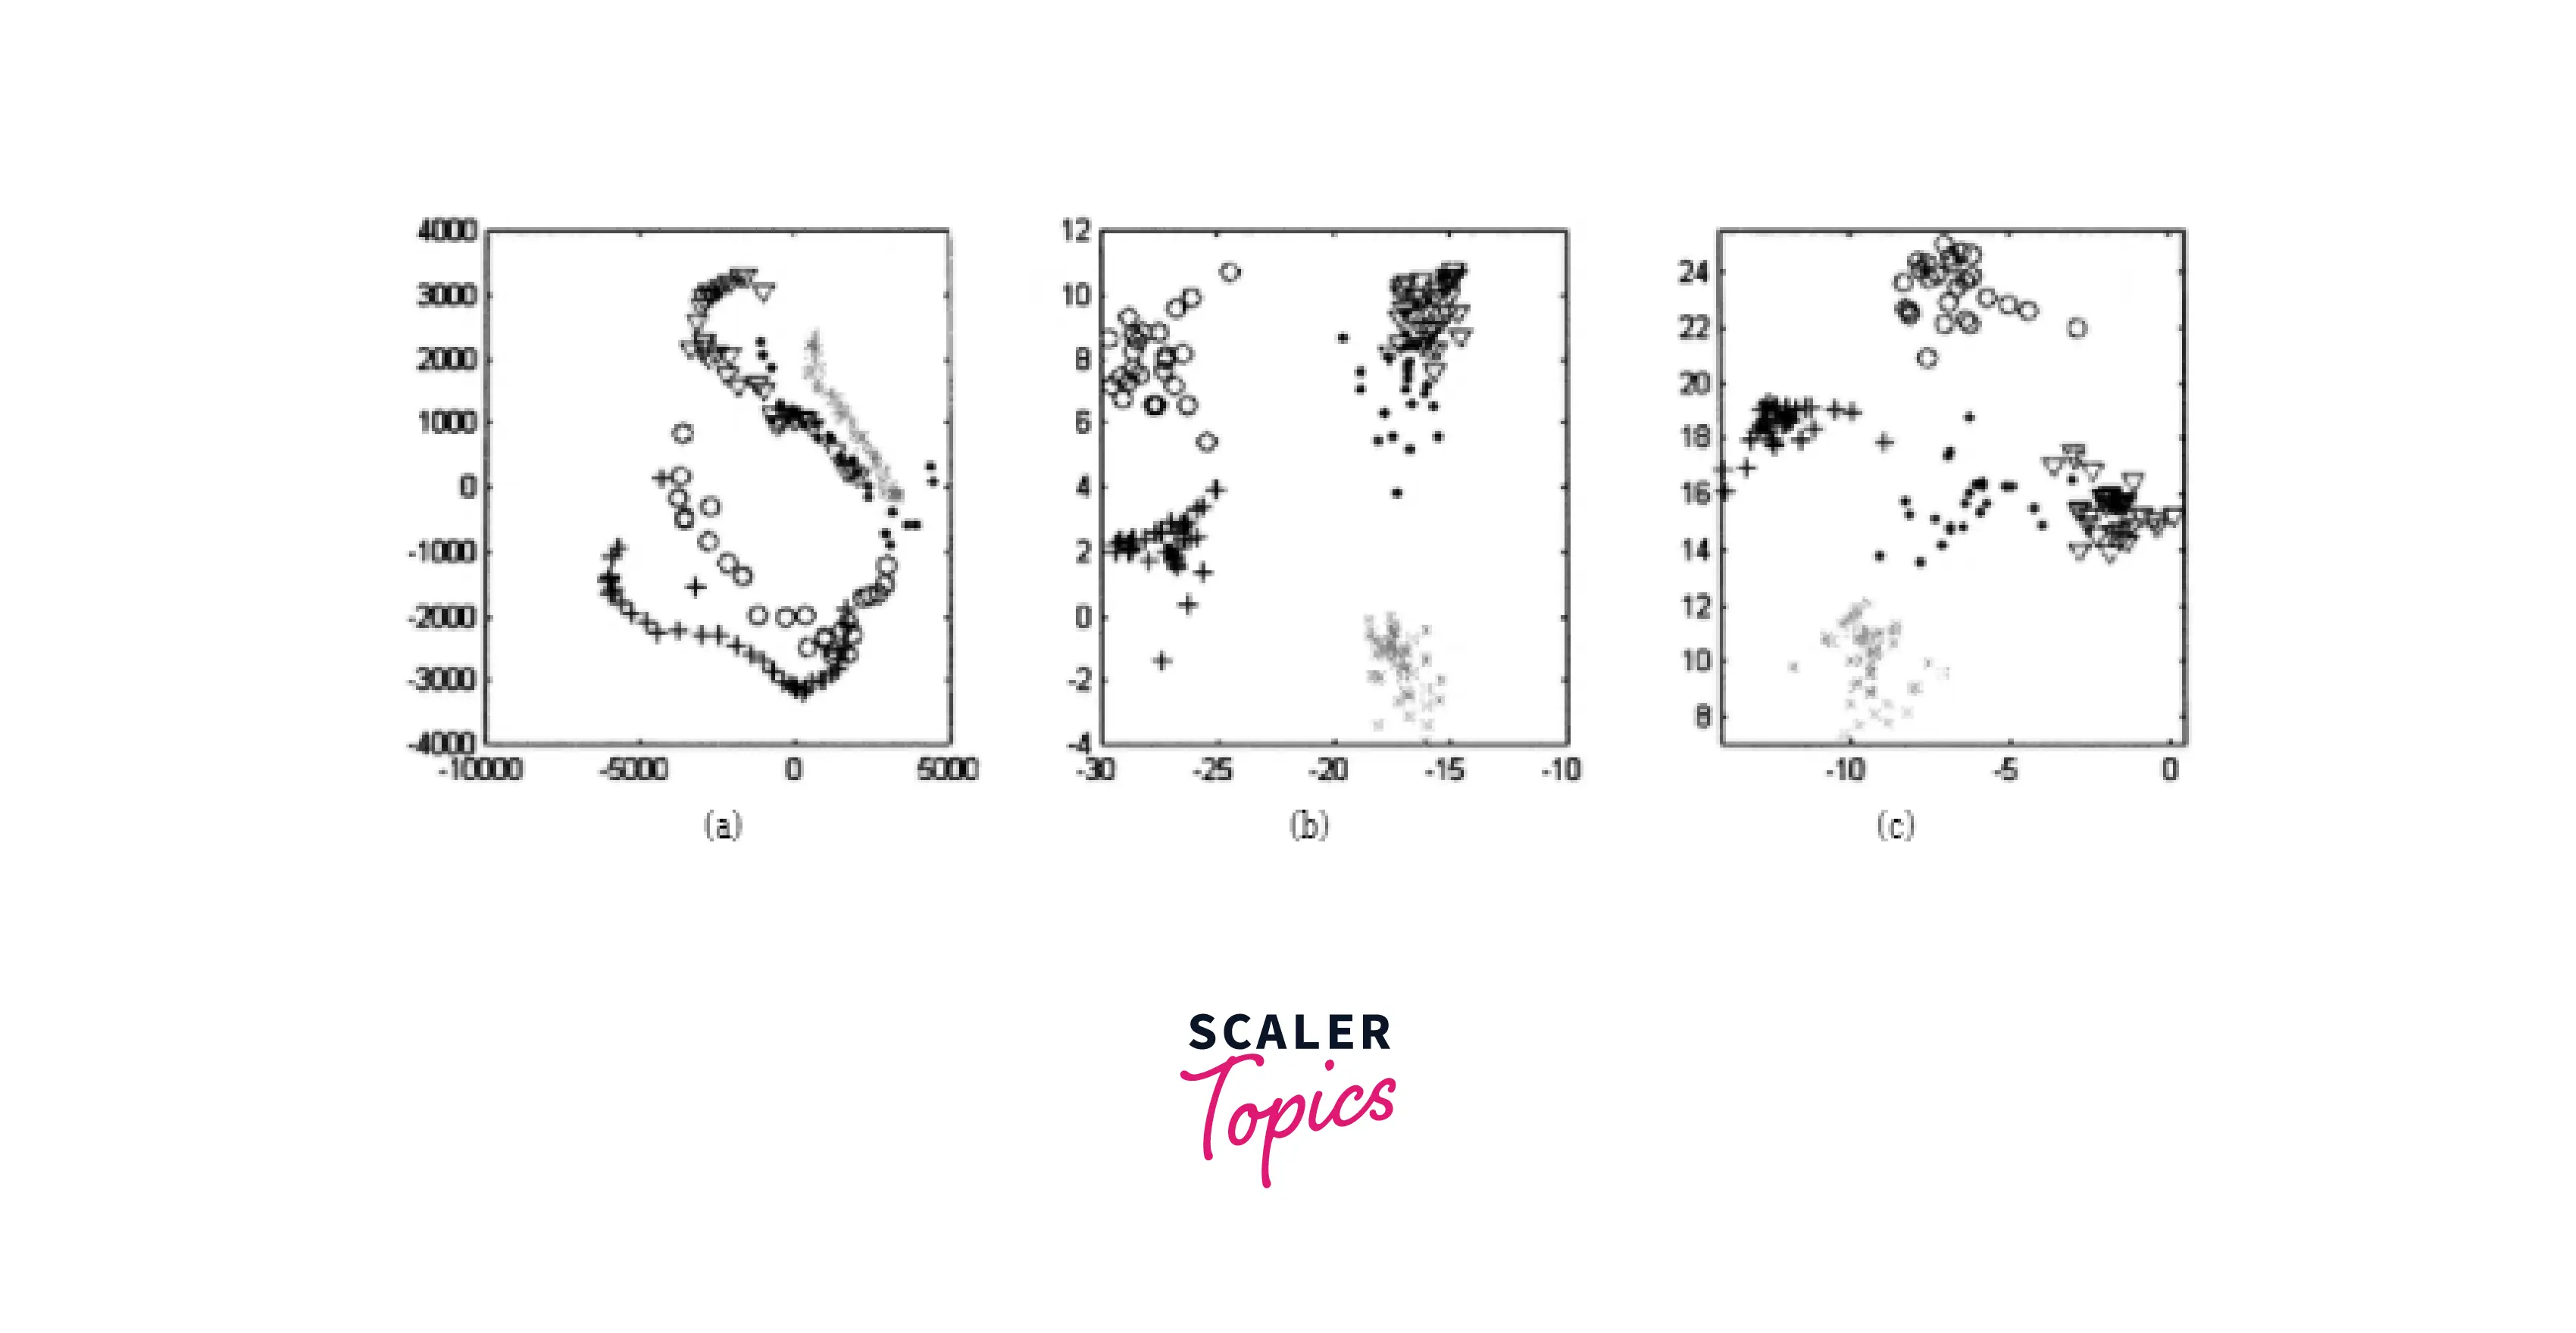
LDA (Linear Discriminant Analysis)
When we work with probabilistic approaches, using PCA and SVD is redundant. A classification method called linear discriminant analysis (LDA) places new data into one of two or more groups based on their characteristics after one or more categories have already been determined. In contrast to PCA, which ignores the class label and concentrates on capturing the dataset's most considerable variance direction, LDA finds a feature subspace that improves group separability.
This technique uses Bayes' Theorem, a probabilistic theorem that assesses the probability of an event occurring depending on how it relates to prior events. It is frequently used in facial recognition, customer identification, and medicine to determine the patient's disease condition.
Unsupervised Learning: Clustering
-
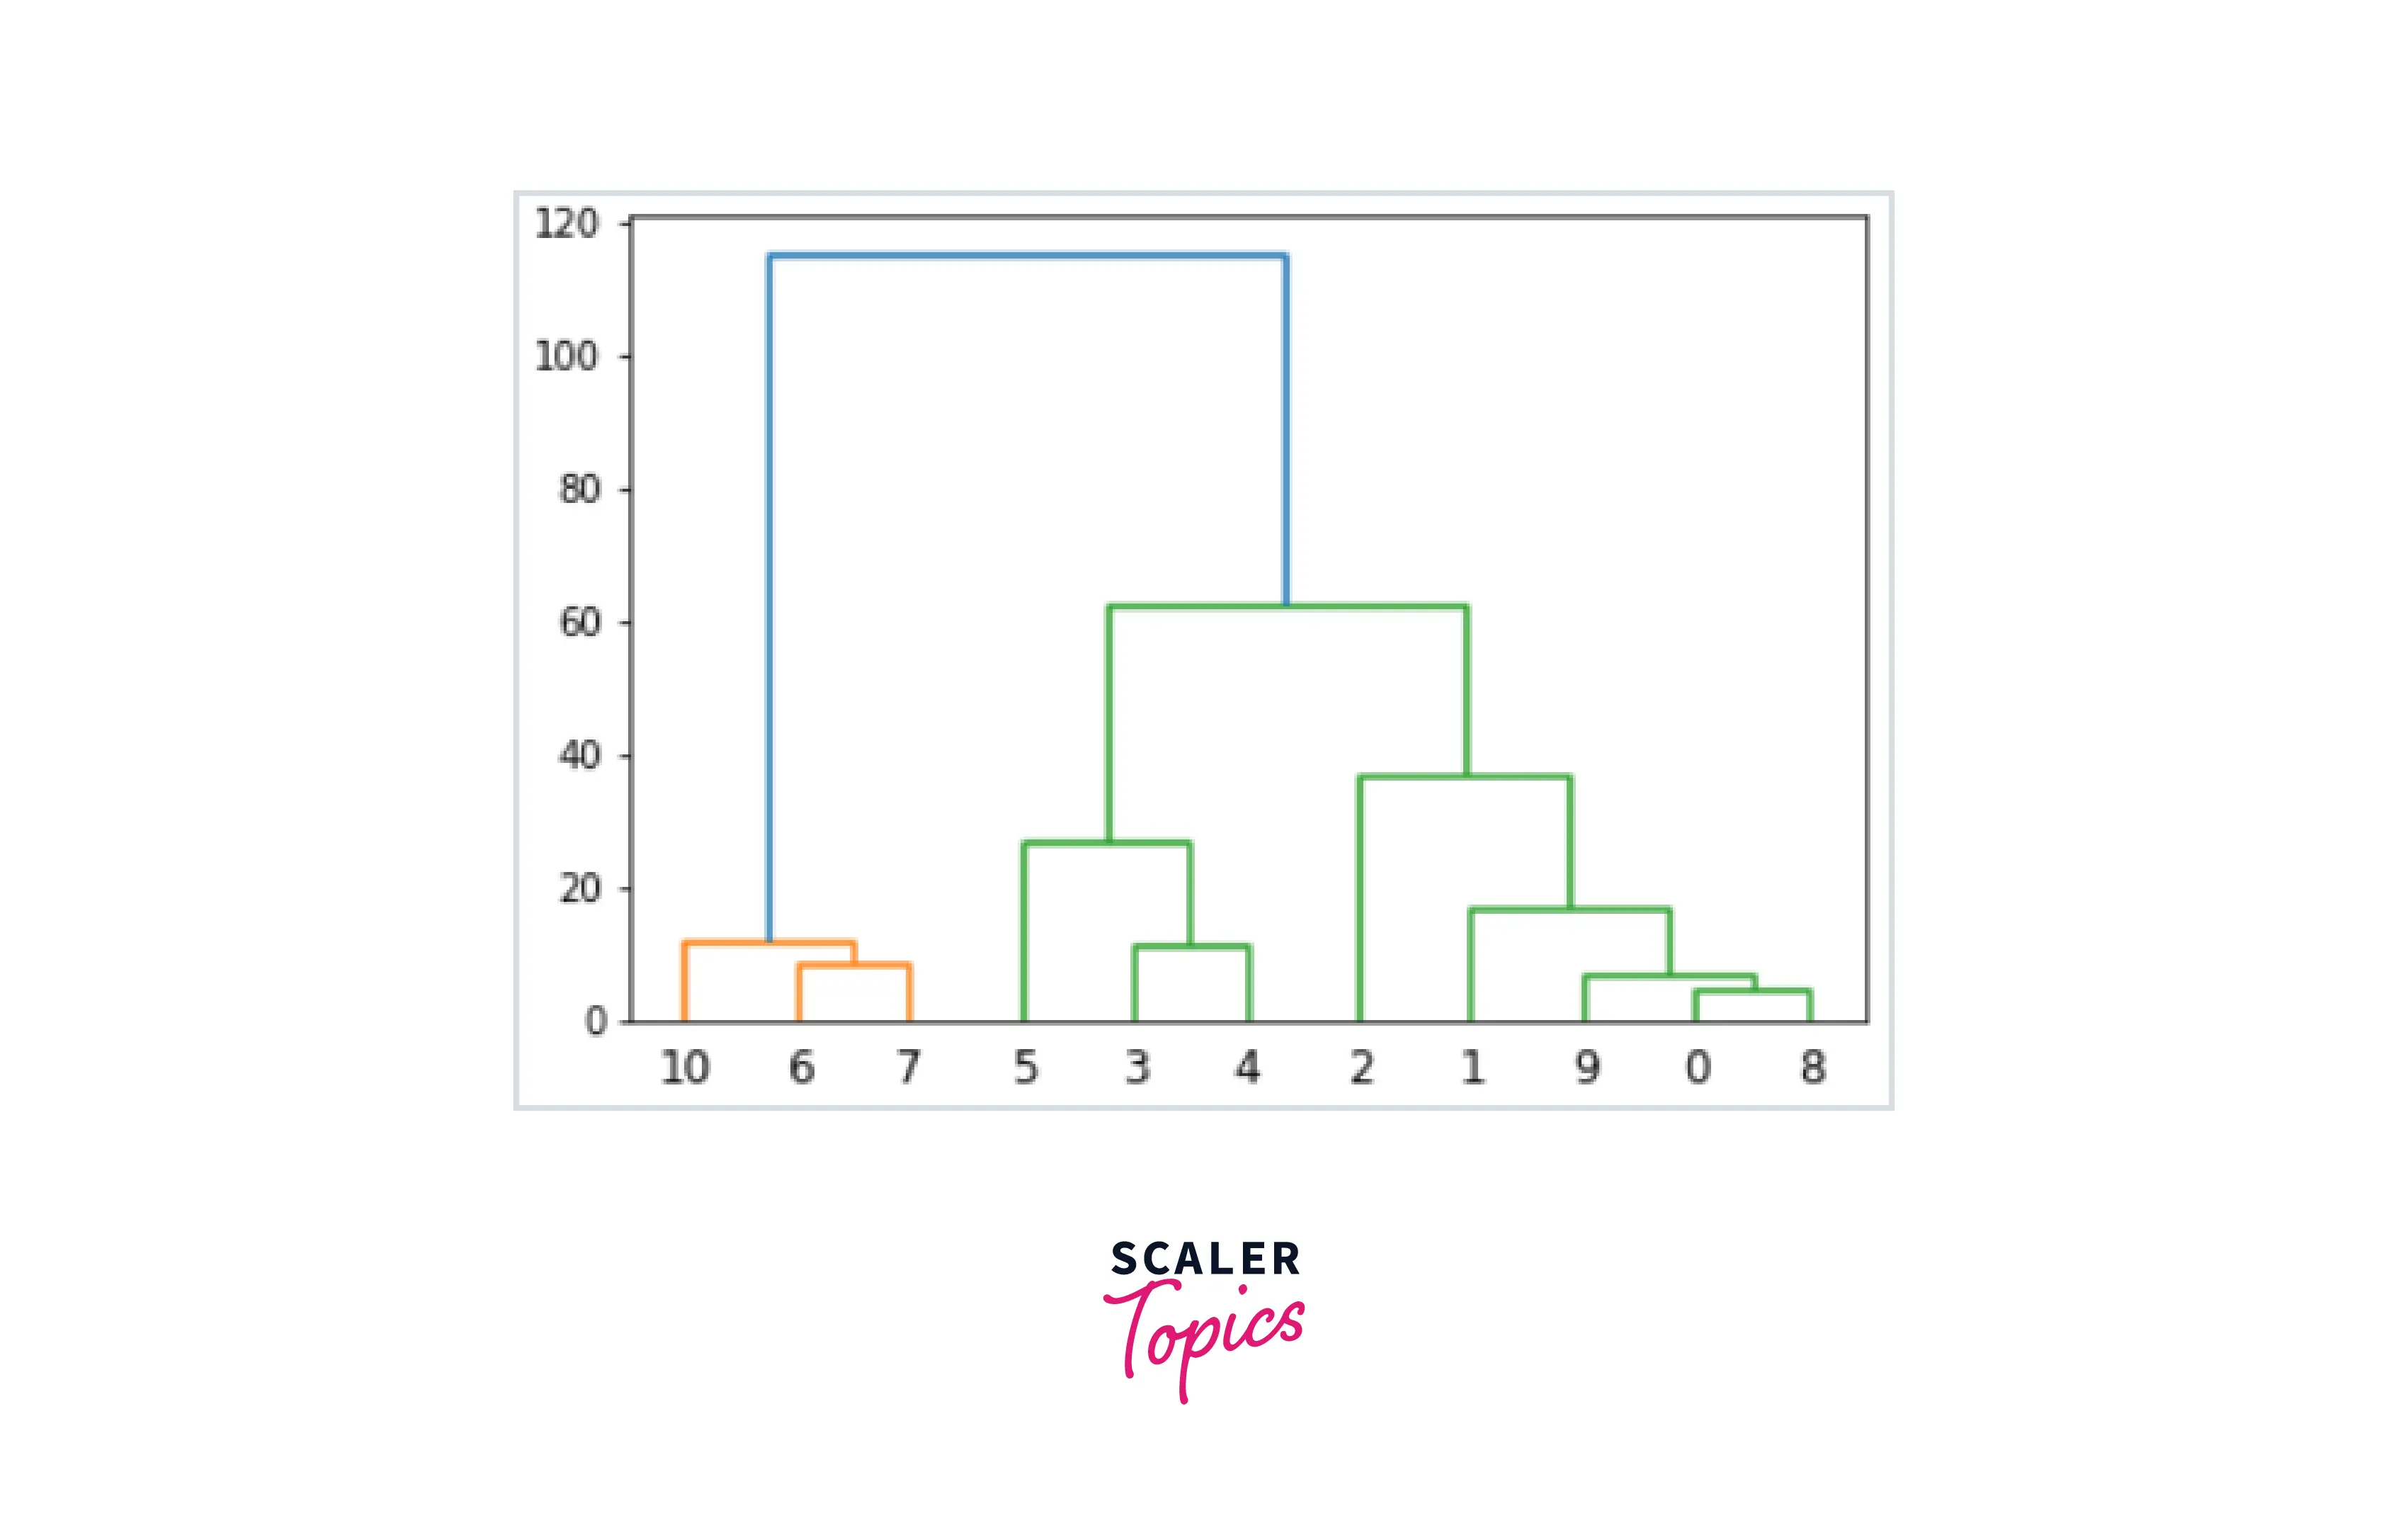
Hierarchical Clustering
A corporation can target its pricing, products, operations, marketing, and other commercial factors by using hierarchical clustering to organize data and find commonalities, various groupings, and features. Its hierarchy should display the information as a Dendrogram, a tree-like data structure. Here is an example of a dendrogram:
-
DBSCAN (Density-based Spatial Clustering of Application with Noise)
Density-Based Clustering is preferable when spotting outliers or irregular-shaped clusters. DBSCAN groups nearby points based on two parameters, eps, and minPoints, to identify arbitrary-shaped clusters and those with noise.
The eps explains how far apart two points must be to be categorized as a cluster. While the minPoints represent the bare minimum of points required to form a cluster.
-
K-Modes
To organize categorical variables, utilize K-Modes. We count all of the discrepancies between these kinds of data items. The more similar our data points are, the fewer discrepancies there are between them. This approach is used for fraud detection systems, marketing, document clustering, topic modeling, and text mining applications. Each cluster group represents a specific subject.
-
K-Means
Data is grouped into k groups so that data points in the same group are connected while data points in other groups are separated. The Euclidean distance is widely used to measure this distance. To put it another way, the K-Means method aims to increase distances across clusters while minimizing distances inside each cluster.
K-means clustering is used in many industries, including wireless communications, academic performance, spam/ham detection systems, consumer segmentation, search engines, and more.
-
GMM (Gaussian Mixture Model)
For a specific batch of data, the GMM (Gaussian Mixture Model) algorithm will calculate the likelihood that each data point belongs to each distribution.
Since with GMM, we do not know if a data point belongs to a specific cluster, we utilize probability to quantify this uncertainty, which makes GMM different from K-means. On the other hand, the K-means approach is specific in the position of a data point and begins iterating over the entire data set. The Gaussian Mixture Model is frequently applied to music genre classification, language recognition, anomaly detection, and signal processing.
Turn Learning into Career Growth
Supervised Learning: Regression
-
Decision Tree
A decision tree is a data structure that resembles a tree flowchart. In this case, the data is continually divided by the specified parameter. Each parameter may be used in a tree node, and the leaves contain the results of the entire tree. The two types of decision trees are:
- Classification Trees: The decision feature is categorical.
- Regression Trees: The decision feature is continuous in this tree
This method increases the precision of advertising campaigns, fraud detection, and patient detection of acute and treatable diseases.
-
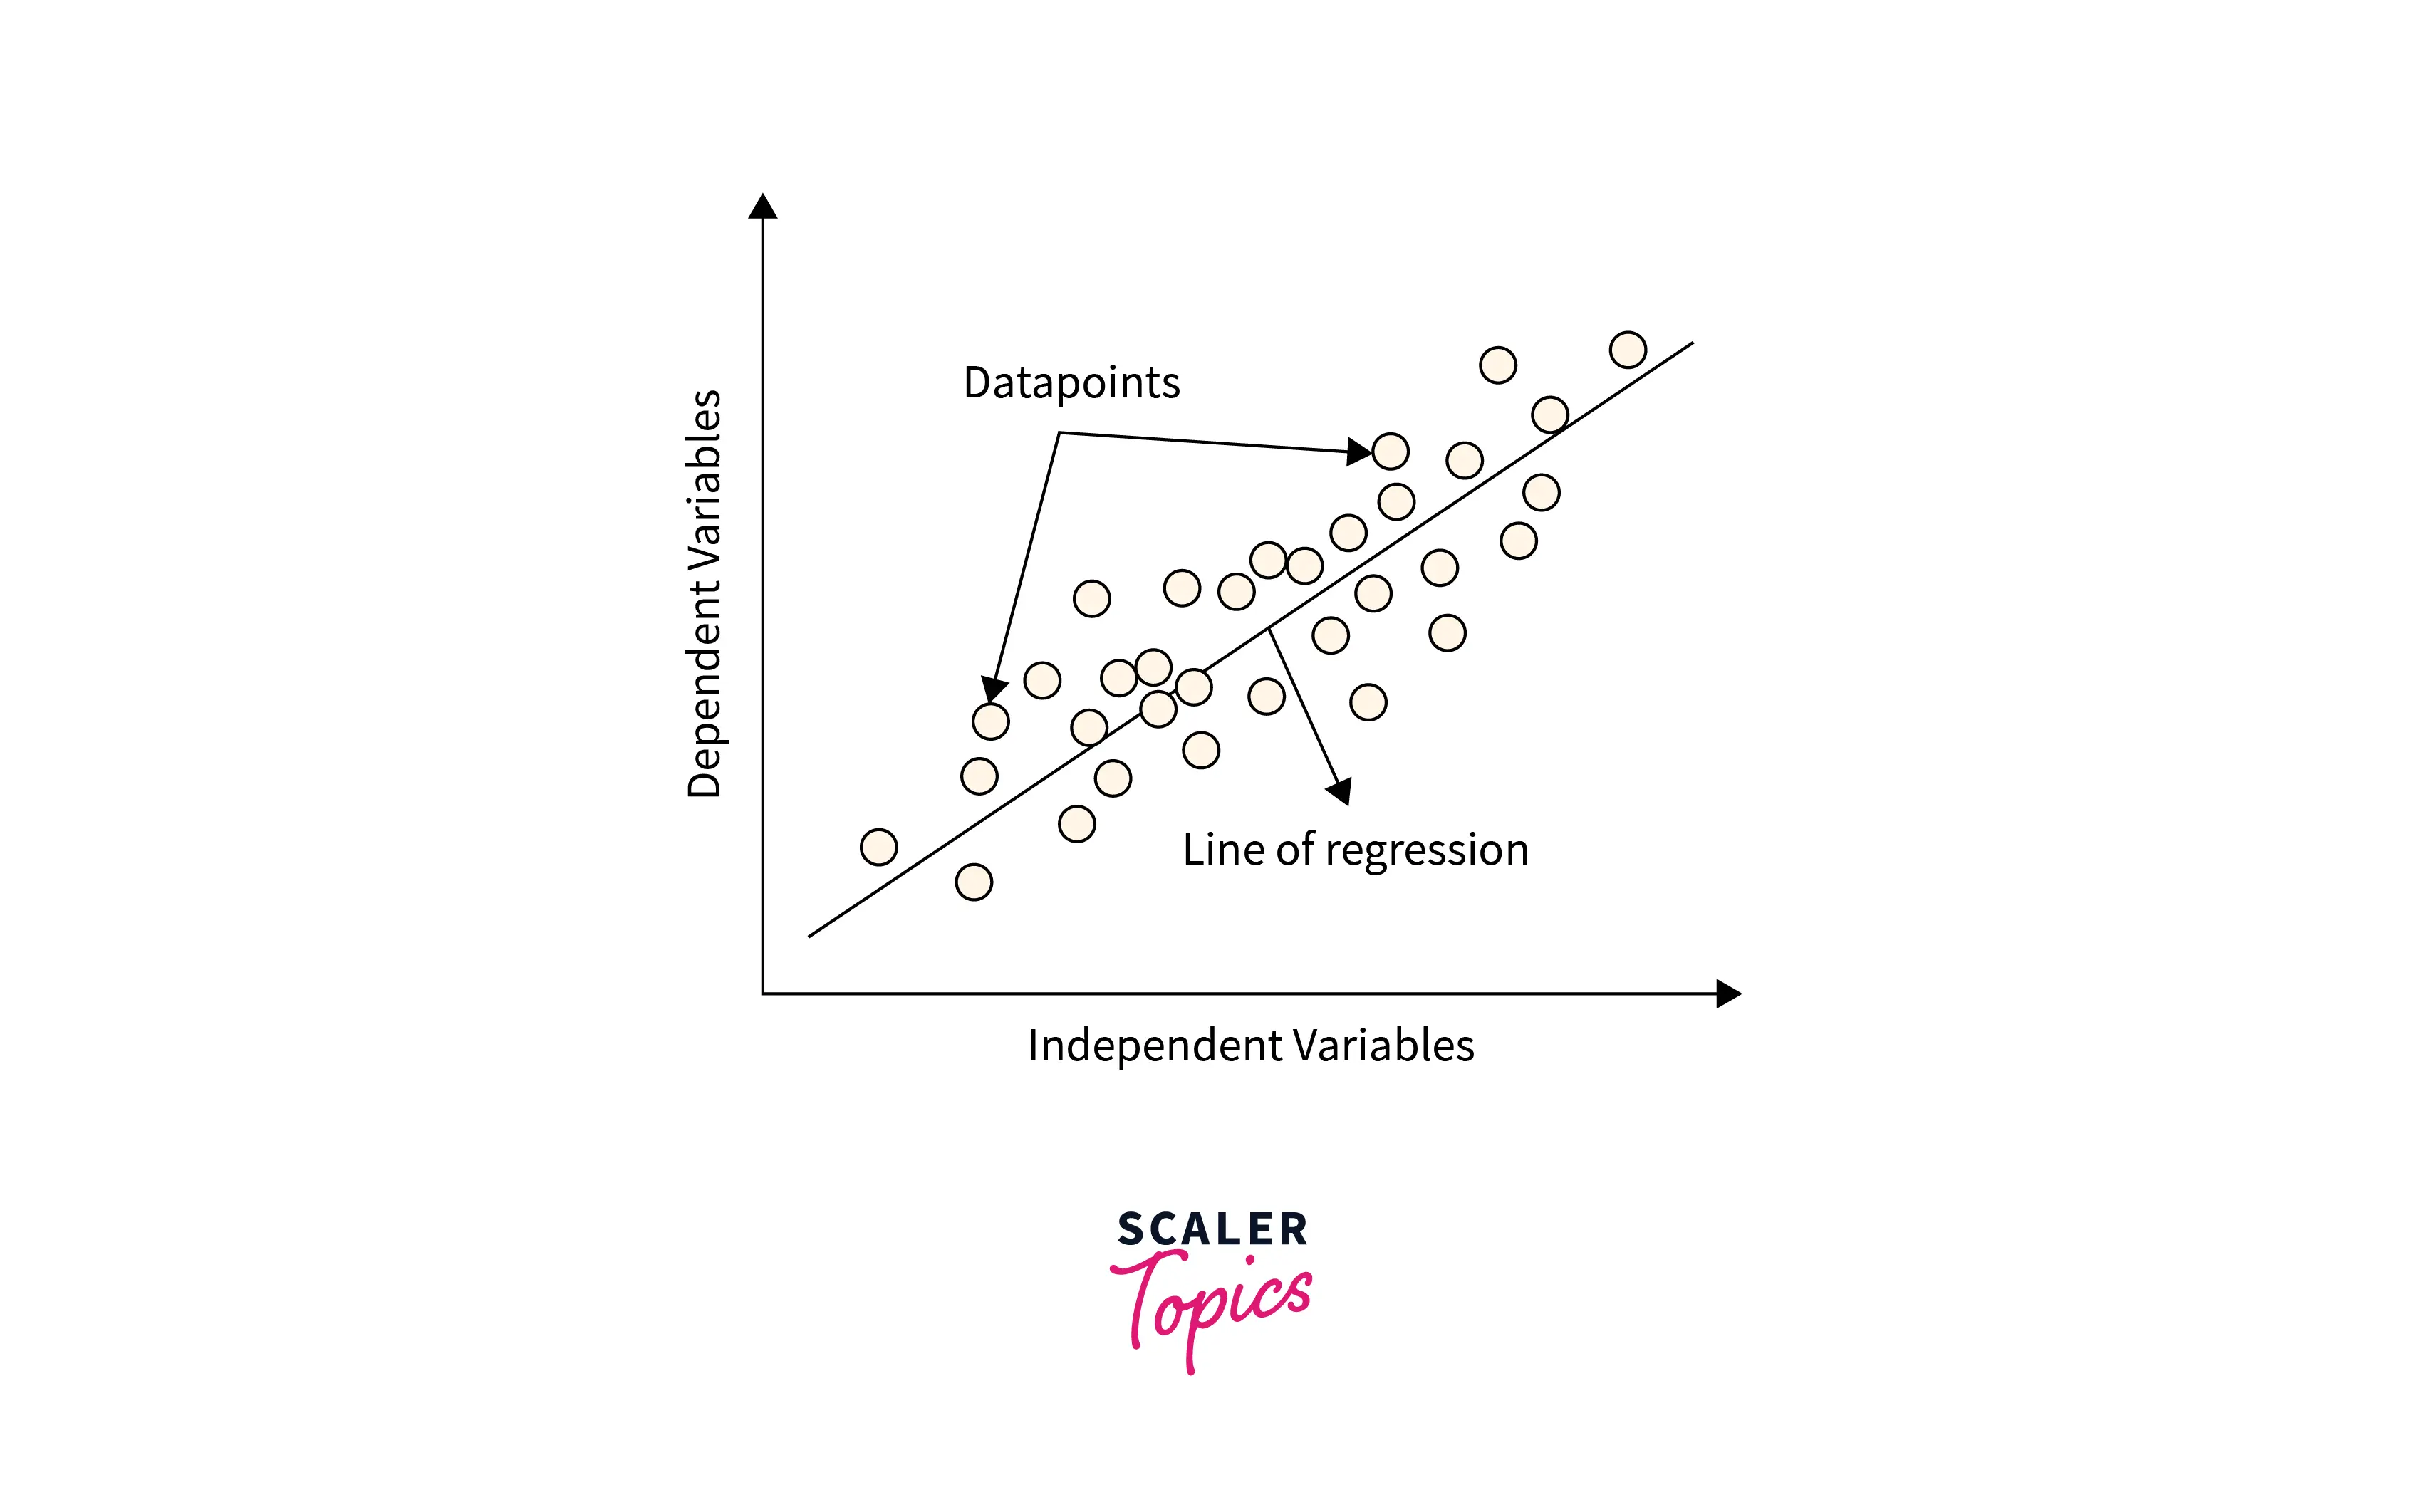
Linear Regression
The most beginner-friendly Machine Learning algorithm, Linear Regression, predicts the value of a dependent feature based on one or more independent features. Linear Regression tries to determine linear relationships between a dataset's independent and dependent variables. Linear Regression is quite helpful for problem statements concerning series forecasting and understanding relationships.
-
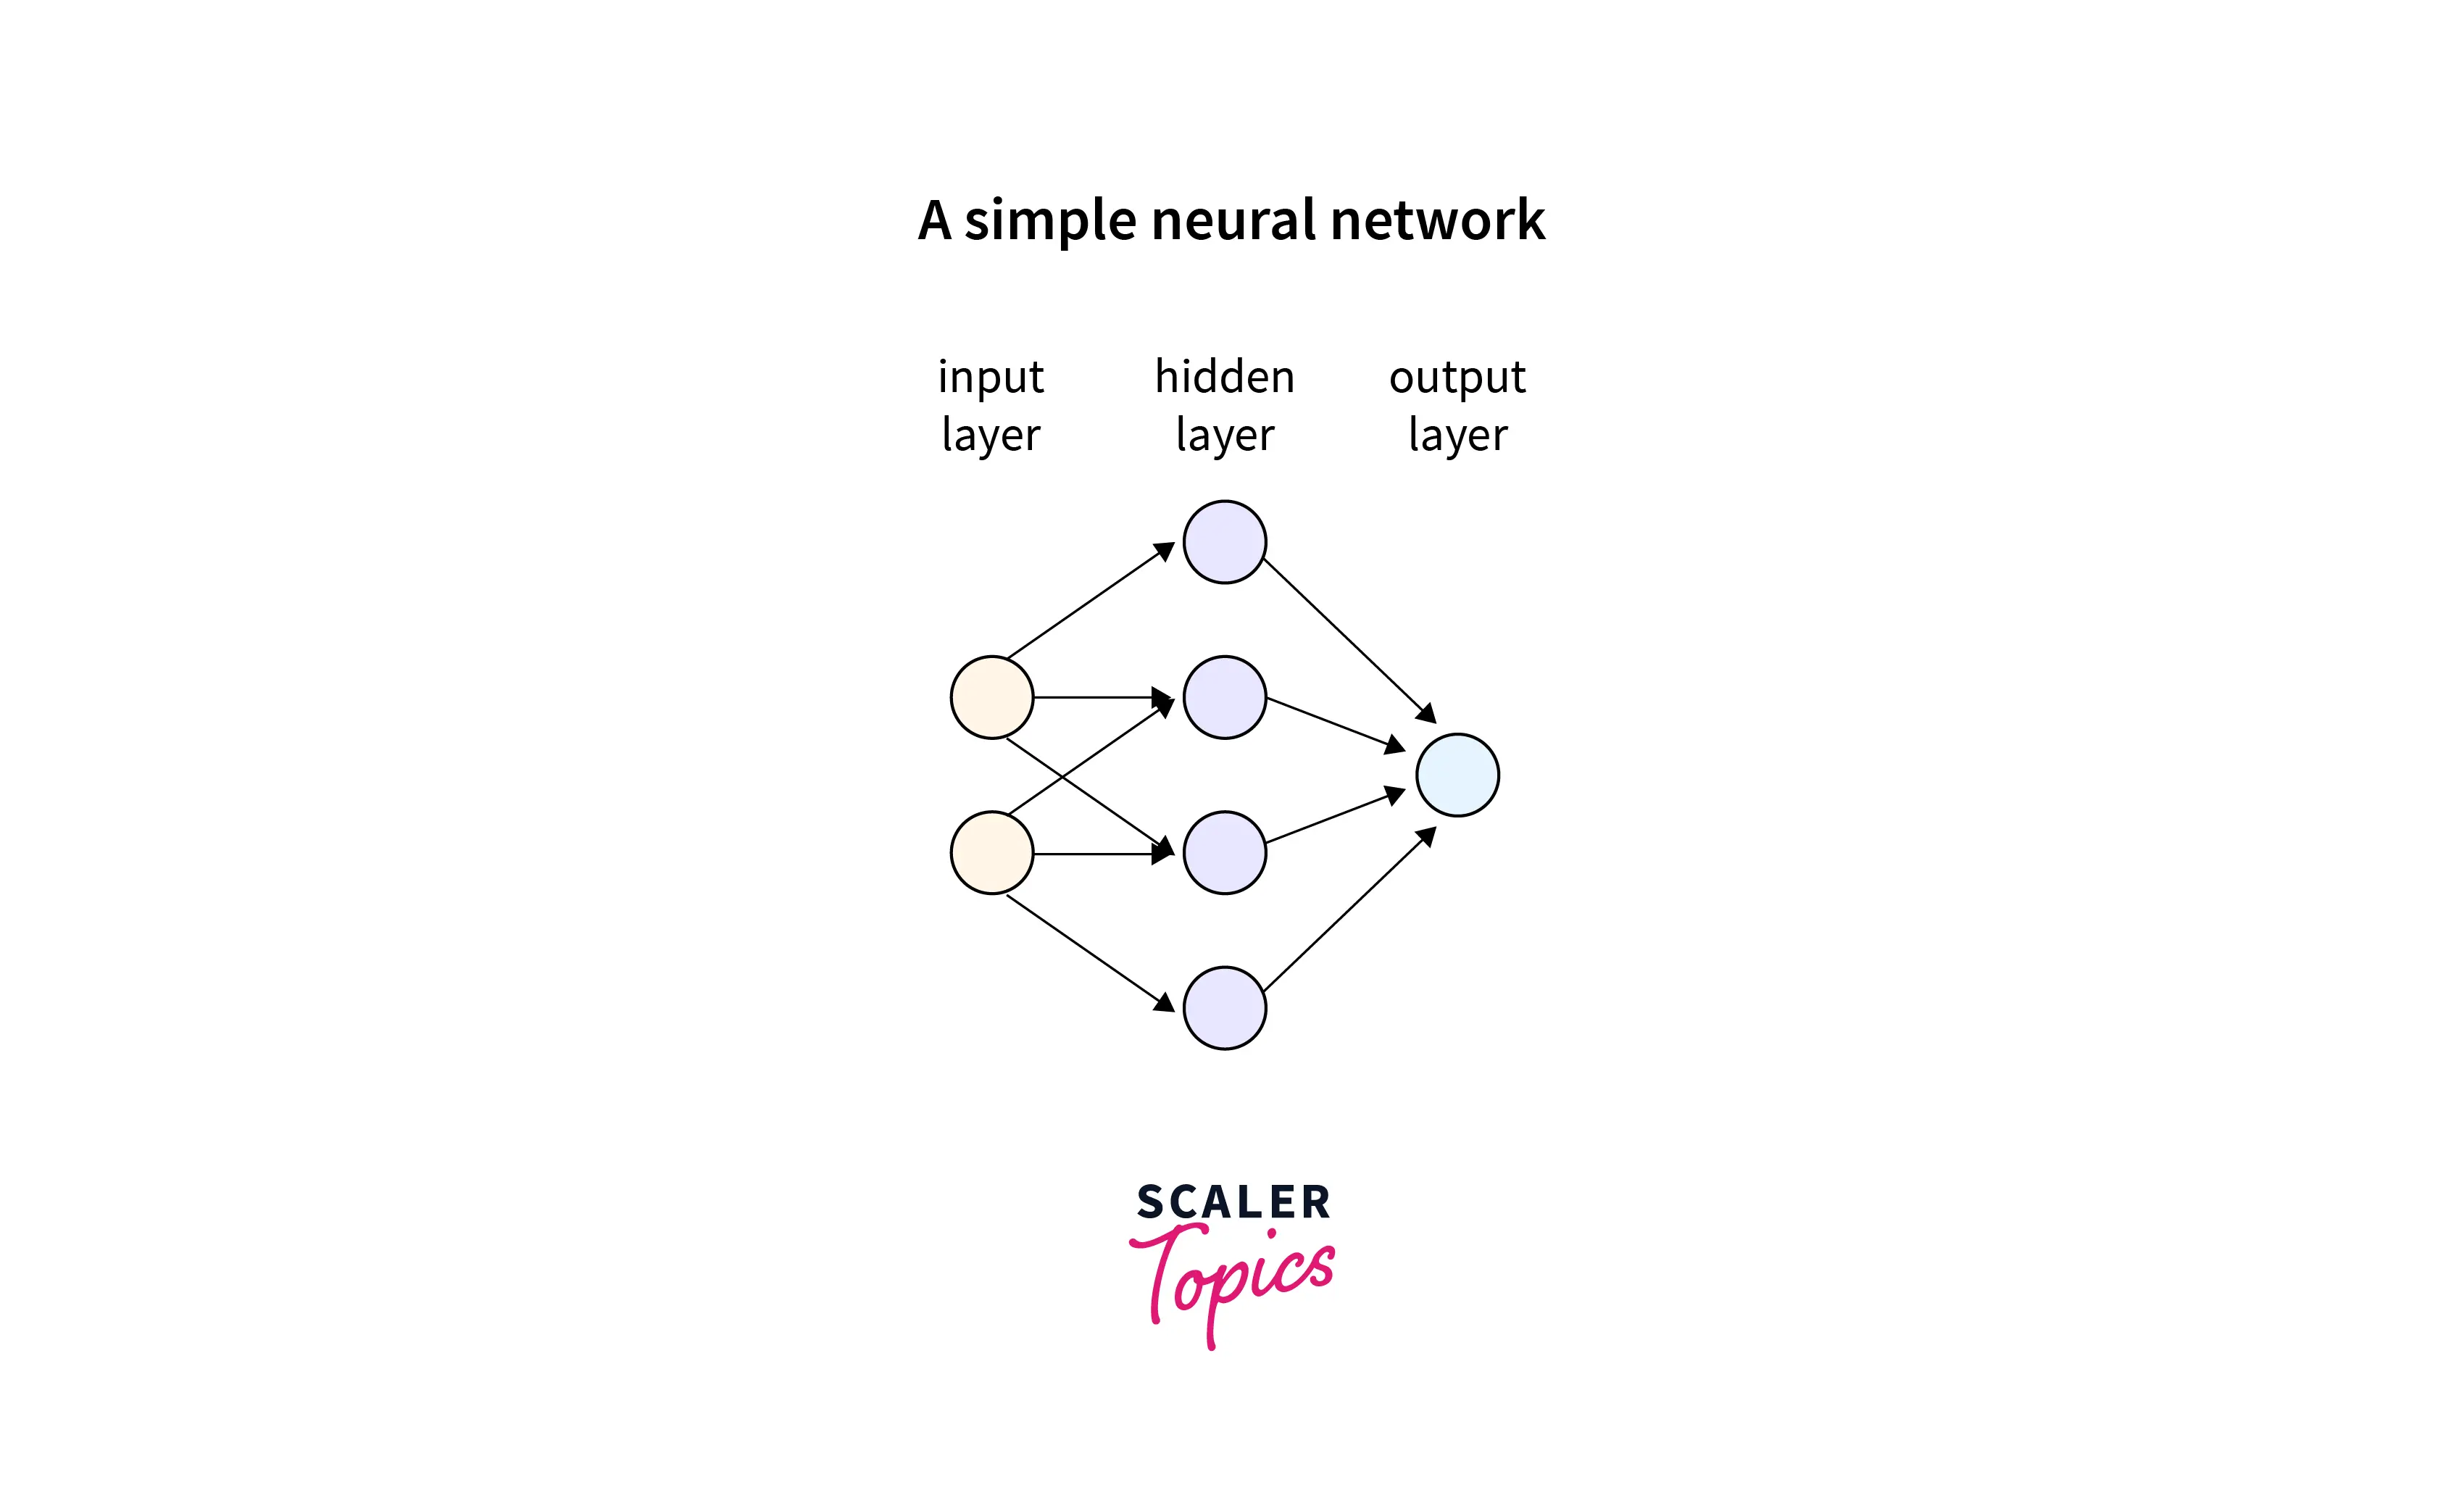
Neural Network
The complex non-linear relationship between the features and the target must be learned by a neural network. It is an algorithm that mimics how neurons in the human brain function. With a variety of Neural Networks at our disposal, it is one of the best solutions for complex problem statements.
The applications of Neural Networks include social media features ('People you may know feature), marketing and advertisement-generation, healthcare, etc.
-
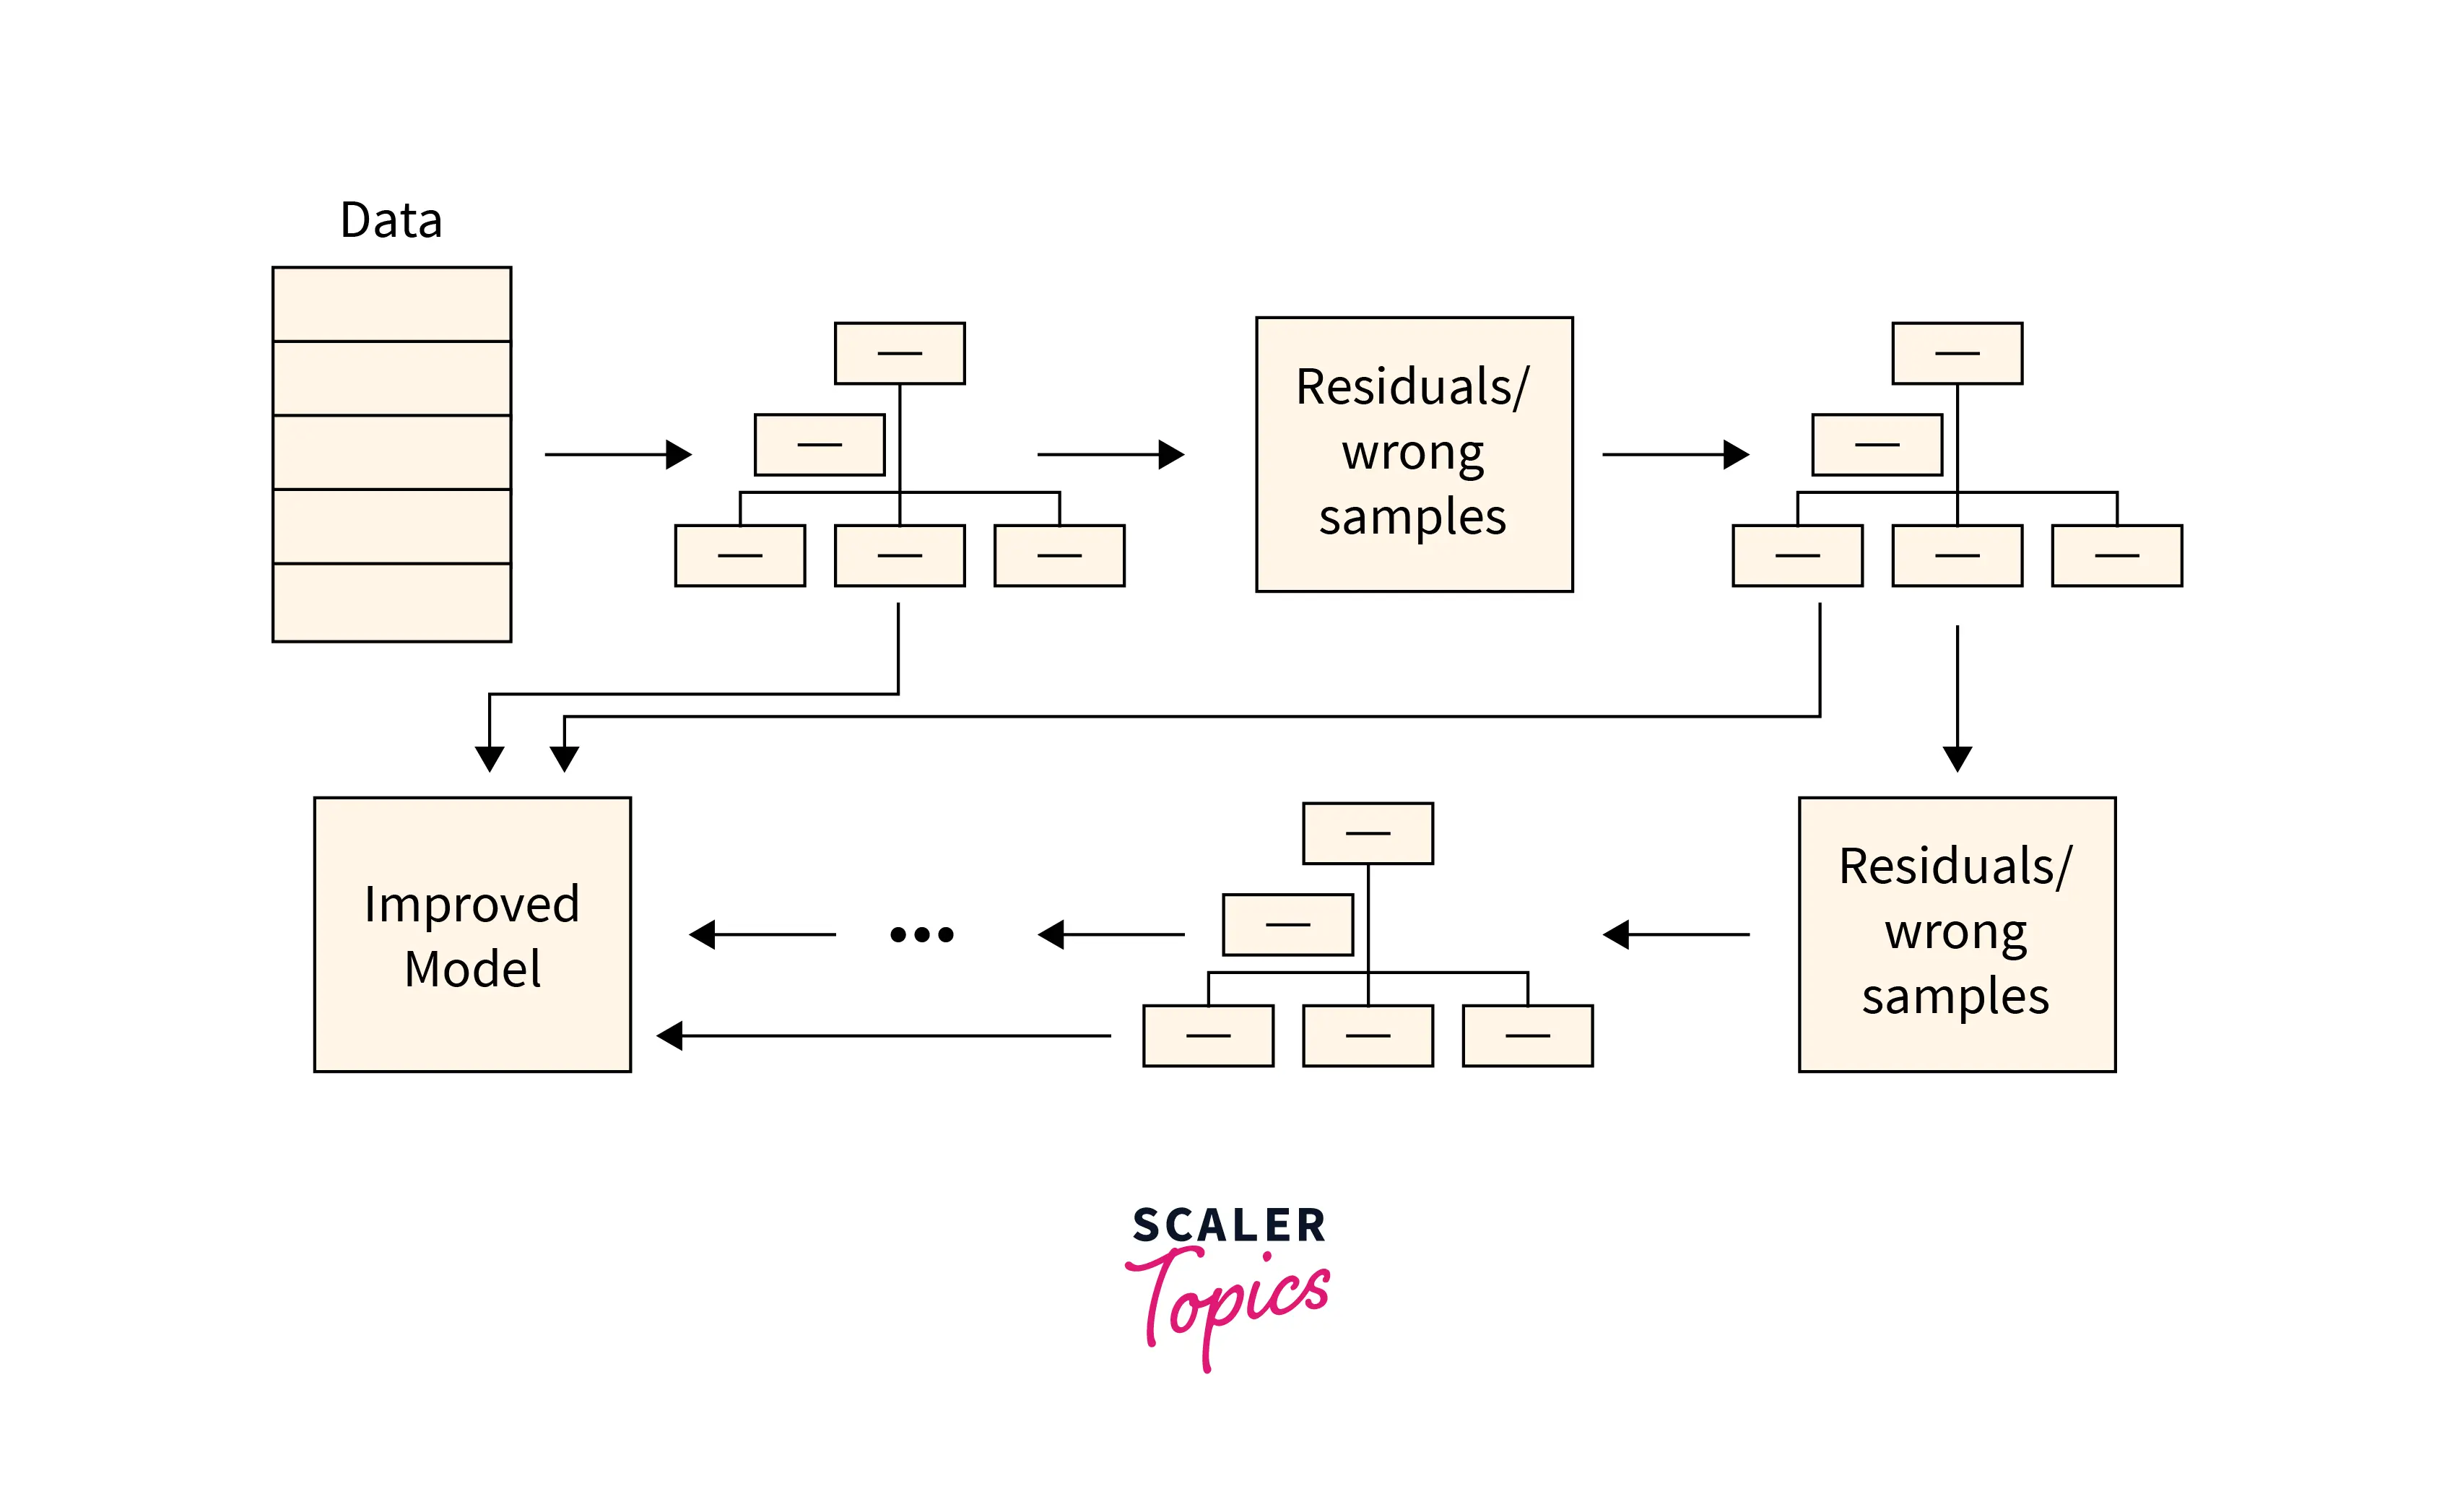
Gradient Boosting Trees
An algorithm based on the concept of boosting, this algorithm builds models sequentially, and these subsequent models try to reduce the errors of the previous model. However, how does it do that?
To do regression or classification, it combines the results of various trees. To limit the risk of overfitting (a statistical modeling error that occurs when a function is too closely matched to a small number of data points, making it possible to reduce the predictive capacity of the model), both supervised learning uses a large number of decision trees.
-
Random Forest
One of the best algorithms for classification and regression, Random Forest incorporates ensemble learning, which combines multiple classifiers to solve complex problems and is a method used by Random Forest. It consists of numerous decision trees, and the results of each one will determine the outcome using the mean or average decisions. The accuracy of the results increases with tree density.
Going for Random Forest is an absolute no-brainer when working with large datasets. This method is employed in stock market analysis, medical diagnosis, loan applicant creditworthiness prediction, and fraud detection.
Supervised Learning: Classification
-
Kernel Support-Vector Machine
One of the most well-liked supervised learning algorithms, Support Vector Machine, or SVM is used to solve Classification and Regression problems. However, it is employed mainly in Machine Learning Classification issues.
The SVM algorithm's objective is to establish the best line or decision boundary that can divide n-dimensional space into classes, allowing us to classify fresh data points in the future quickly. A hyperplane is a name given to this optimal decision boundary.
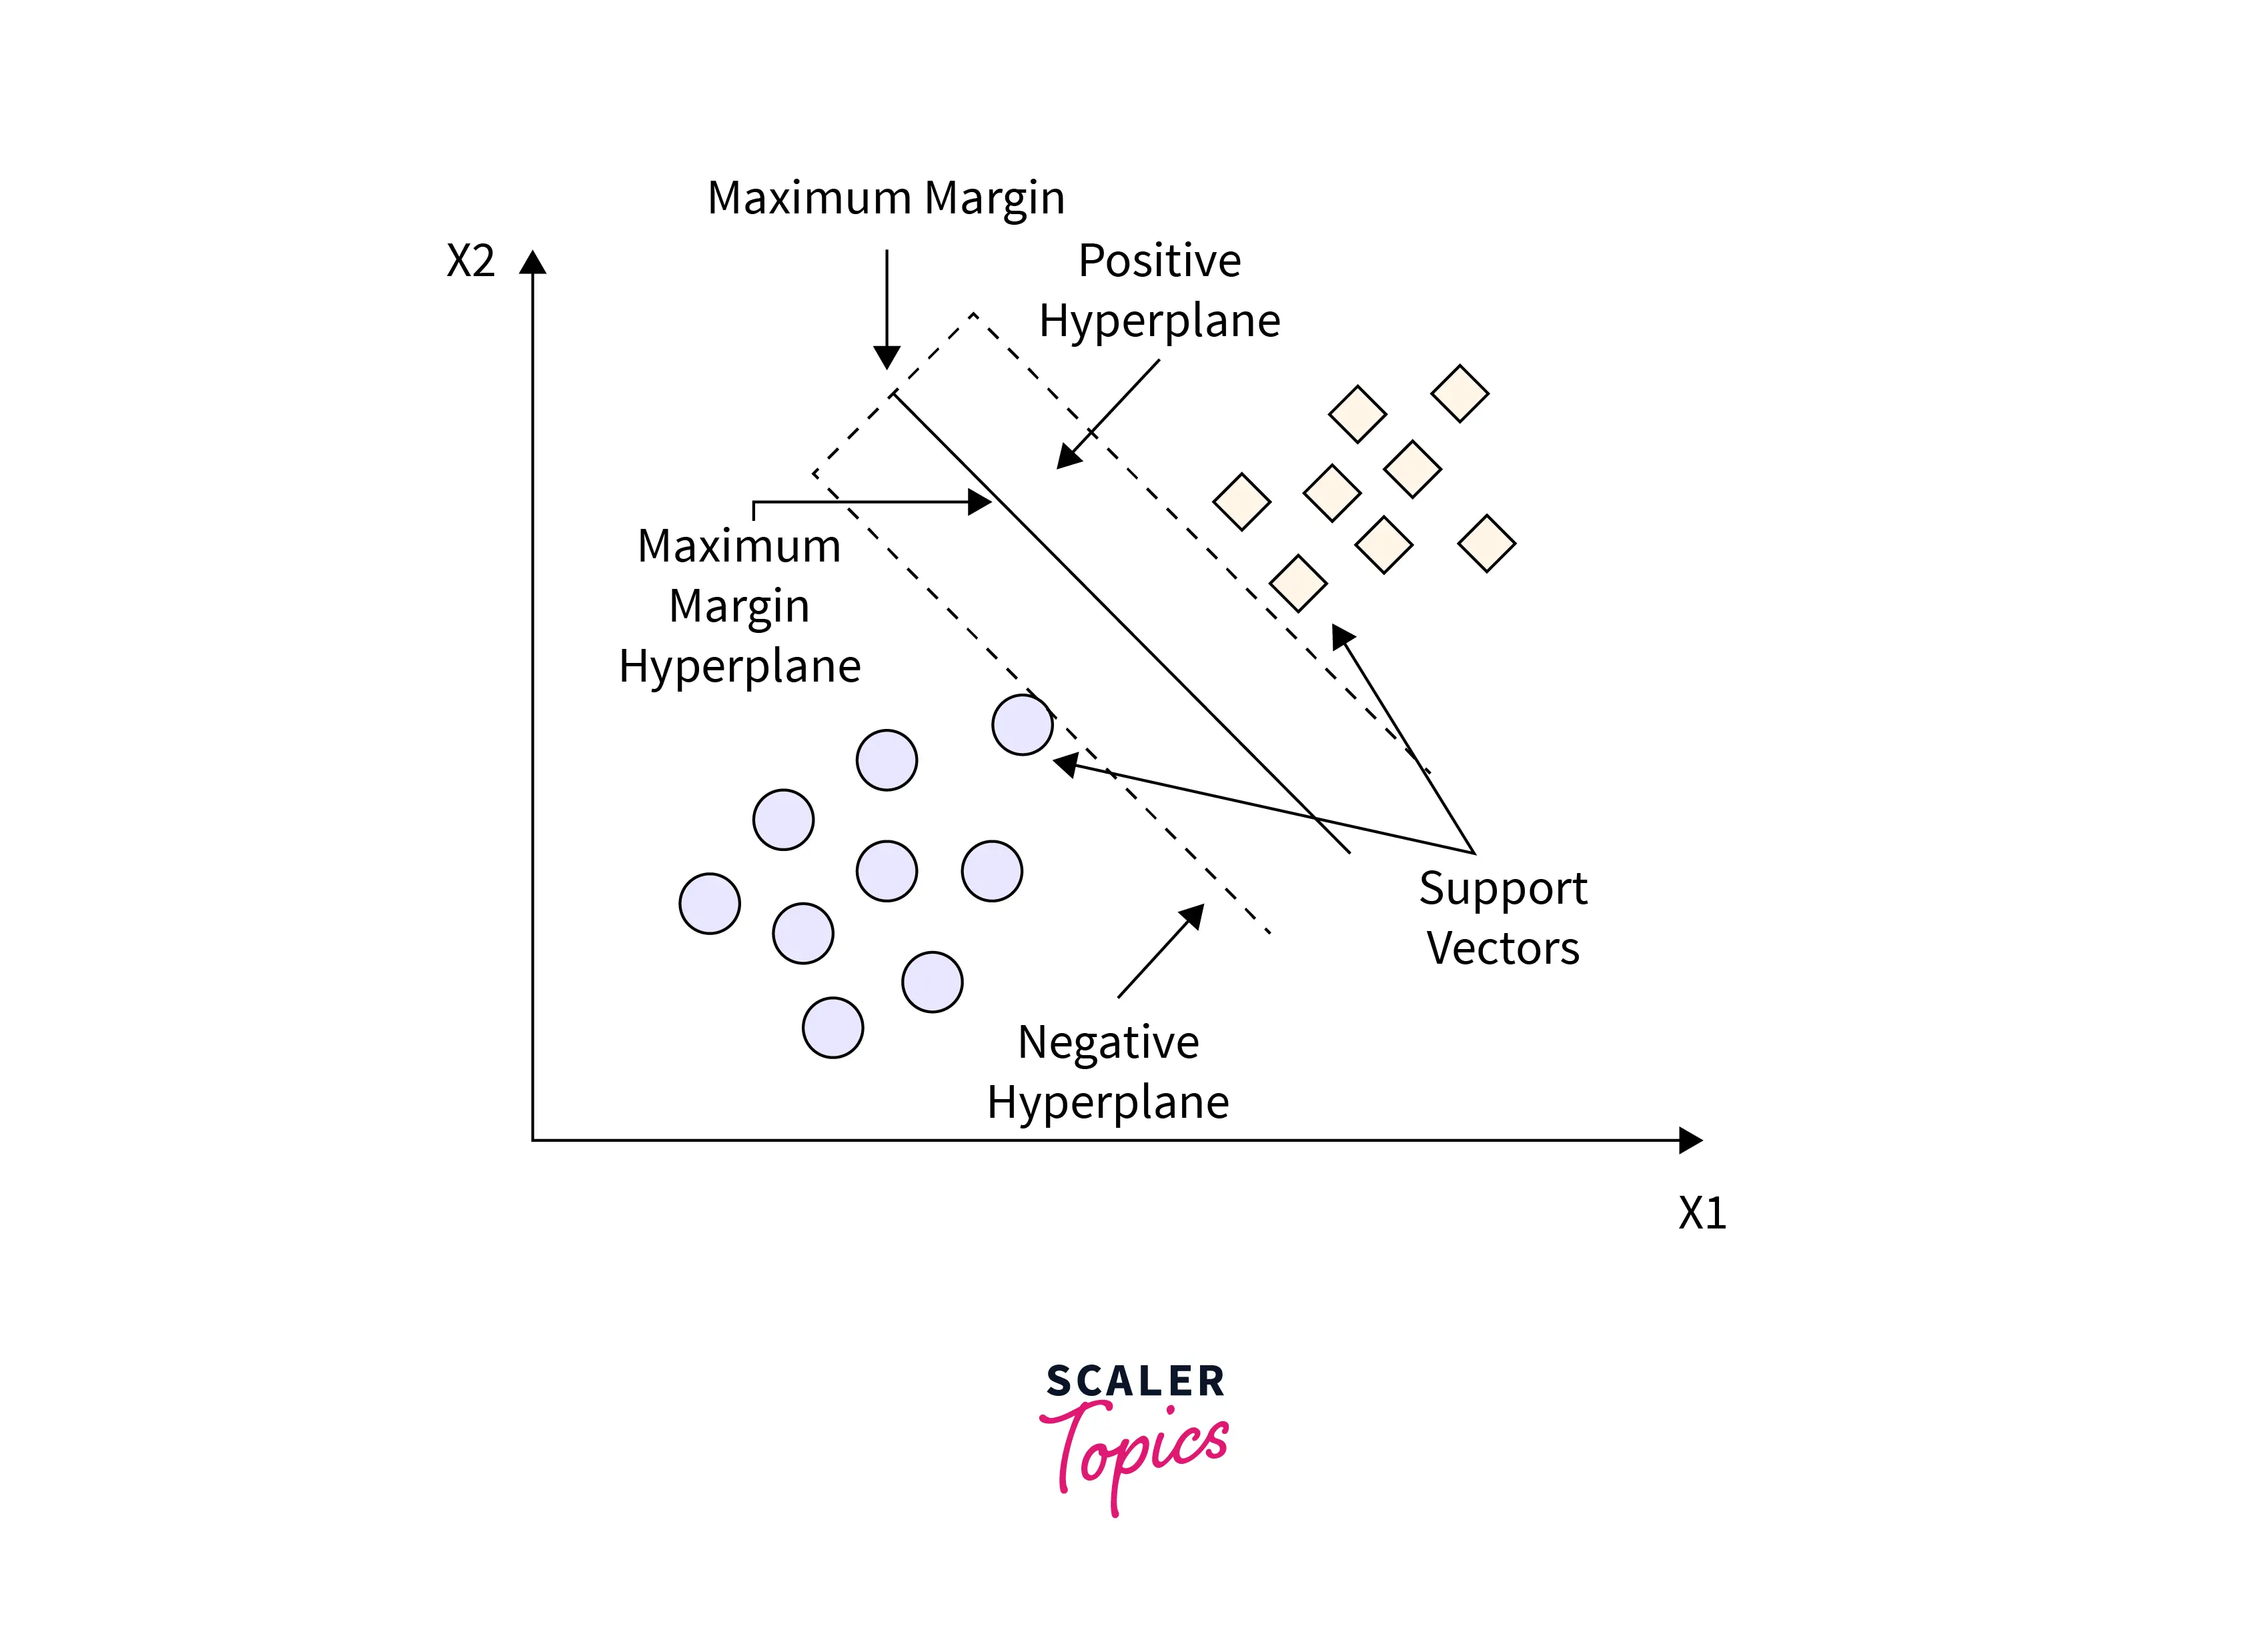
Now the question arises, how can we generate a hyperplane for 2D and 3D transforms? We solve this issue by using the kernel trick. The trick is that the kernel method does not explicitly apply the transformations (x) and represents the data by these transformed coordinates, but rather only through a set of pairwise similarity comparisons between the original data observations x (with the original coordinates in the lower dimensional space).
-
Logistic Regression
Similar to Linear Regression, when the dependent feature is categorical, logistic regression is utilized. It helps to understand the relationship between dependent variables and one or more independent variables through probability estimation. Logistic Regression uses the sigmoid activation function to map the predicted values to their respective probabilities.
-
Linear Support-Vector Machine
As we discussed, kernel SVM, Linear SVM works for linearly separable data. It works with data that can be linearly split into different variables using only a straight line (linear SVM classifier). The user behavior or result, as seen via a stated problem, is represented by this straight line.
-
Naive Bayes
The most accessible Machine Learning algorithm, Naive Bayes, is based on the fundamental properties of probability.
This algorithm is viral because it can outperform even the most complex categorization techniques. It may also be quickly constructed and is simple to create. Real-time judgments are made with it since it is effective and straightforward to use. Additionally, Gmail employs this algorithm to determine whether a message is a spam or not.
Natural Language Processing (NLP) is an area of Computer Science where Naive Bayes is used continually.
Conclusion
- In this machine learning cheat sheet, we learned about most of the essential concepts in Machine Learning along with their respective examples.
- We looked at various unsupervised learning techniques like PCA (Principal Component Analysis), SVD (Singular Value Decomposition), and LDA (Linear Discriminant Analysis).
- To wrap things up, we learned about the various supervised machine learning algorithms that help us to predict and classify, such as Linear Regression, Logistic Regression, Linear Support-Vector Machine, etc.