Regression in Machine Learning
Overview
Machine learning fundamentally has two segments: supervised and unsupervised learning. While supervised learning deals with labeled data, unsupervised learning deals with unlabelled ones. Supervised learning can be further segmented into classification and regression. The key difference between them is that classification deals with discrete values while regression deals with continuous values. This article revolves around Regression in Machine Learning and its related models.
Introduction
What is Regression Analysis?
Regression analysis is a statistical method that helps us to model the relationship between dependent variables and one or more independent variables. This analysis helps us to understand the change in the value of our target variable corresponding to an independent variable when other independent variables are held fixed. It predicts continuous/real values such as salary, prices, temperature, etc.
The different types of regression in machine learning analysis techniques are involved when the target variable with continuous values and independent variables show a linear or non-linear relationship with each other.
In other words, regression analysis involves determining the best-fit line, which is a line that passes through all the data points in such a way that the distance of the line from each data point is minimal.
What are Regression Models in Machine Learning?
Regression in Machine Learning is a supervised learning technique and is used for prediction, forecasting, time series modeling, and exploratory data analysis (determining the causal-effect relationship between variables). There are several regression analysis techniques depending on the number of factors involved.
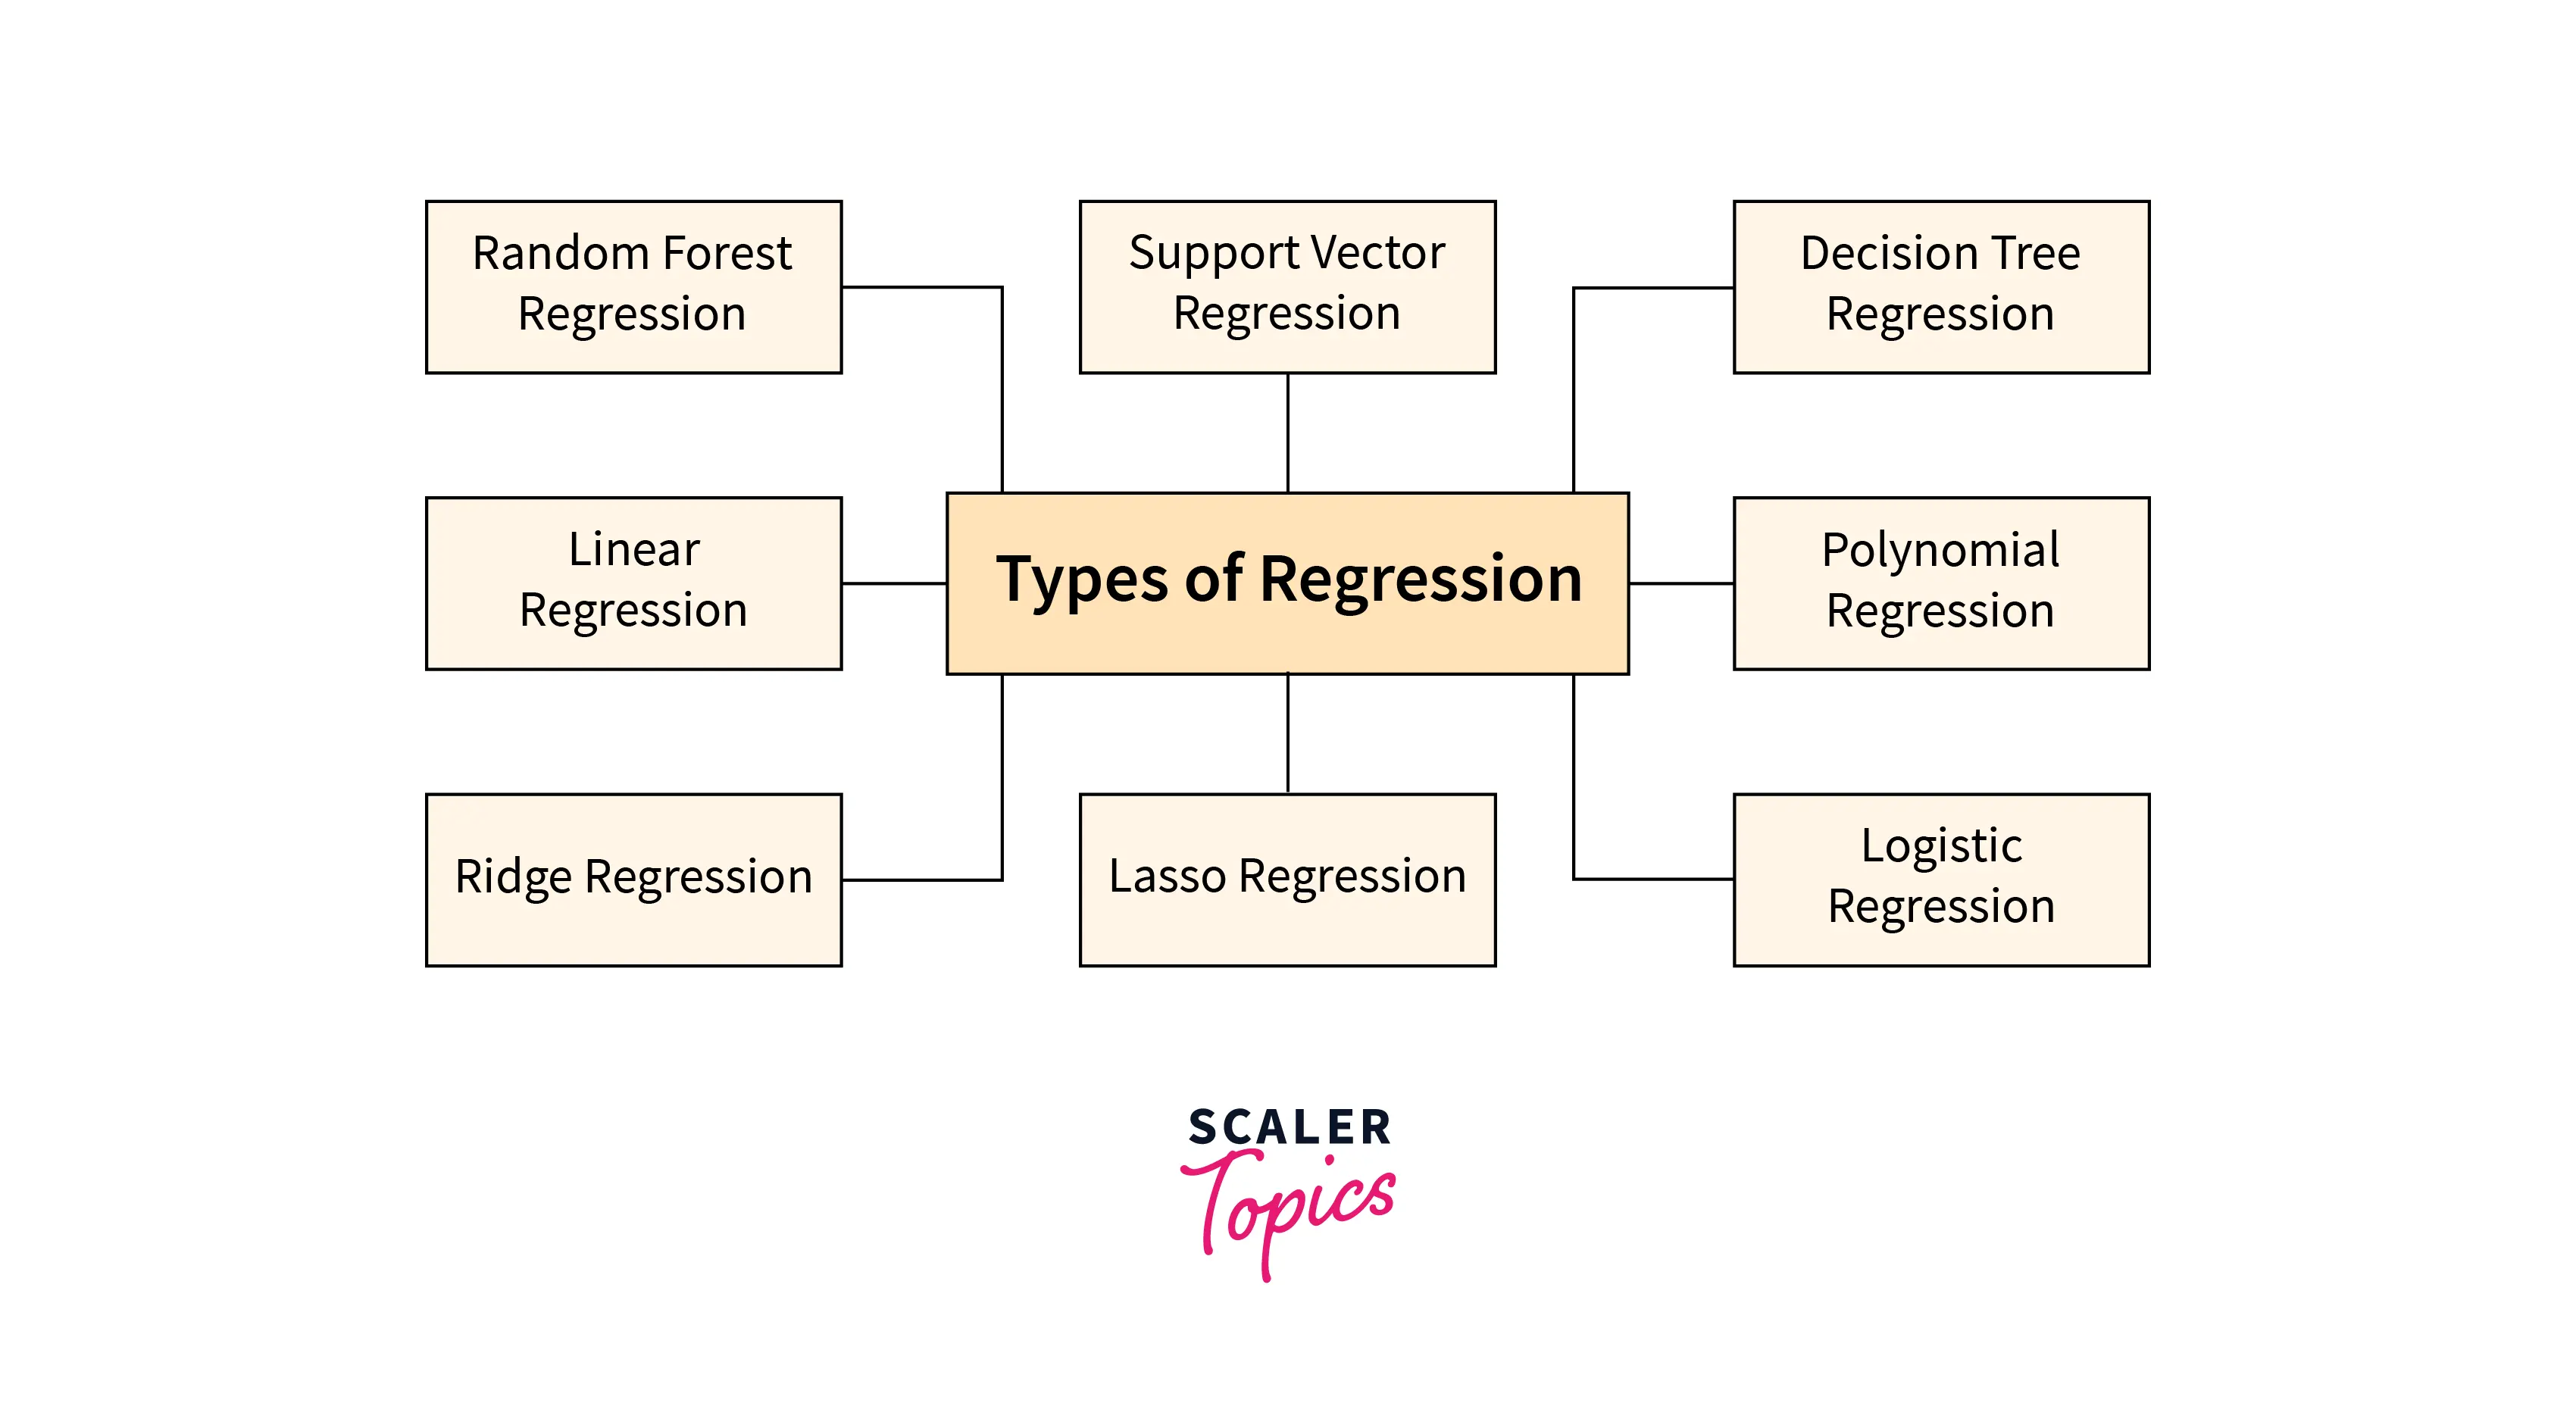
- Linear regression
- Logistic regression
- Ridge Regression
- Lasso Regression
- Polynomial regression
- Support Vector Regression
- Decision Tree Regression
- Random Forest Regression
All of the above models have their requisites, features, advantages, and disadvantages. It all depends upon the nature of the data available so that we can get the best-fit line generated by our model.
Transform Your Career
Choose from our industry-leading programs designed for career success
Modern Software and AI Engineering Program
Master full-stack development with AI integration

Modern Data Science and ML with specialisation in AI
Advanced data science techniques with AI specialization
Advanced AIML with Specialisation in Agentic AI
Deep dive into AIML with focus on Agentic systems
DevOps, Cloud & AI Platform Engineering
Build and manage AI-powered cloud infrastructure
AI Engineering Advanced Certification by IIT-Roorkee
Premier AI engineering certification from IIT-Roorkee
Goodness of Fit
What is the R² Measure?
Definition: R-Squared (R² or the coefficient of determination) is a statistical measure in a regression model that determines the proportion of variance in the dependent variable that can be explained by the independent variable.
In other words, R² helps us to analyze how well our regression model in Machine Learning has fit the data.
R-squared can take any value between 0 to 1.
For example, if the R² of a regression model is 0.6, this means 60% of the variations observed in the target variable are explained by the regression model. Generally, the higher the value of R², the better your regression model fits the data.
Calculating R²
R² is based on the formula:-
Unexplained Variation: Once you get the model with the best-fit line, you would calculate predicted values, subtract actual values and square the results. This results in a list of errors squared, which is then totalized and equals the unexplained variance.
Total Variation: To calculate this, you would subtract the average actual value from each of the actual values, square the results and sum them.
Drawbacks of Using R²
- However, using R² doesn't tell you whether your chosen model is good or bad.
- It will also not indicate whether the data and predictions are biased.
- A high or low R-square isn't necessarily good or bad, as it doesn't convey the reliability of the model, nor whether you've chosen the right regression
What is Adjusted R²?
We know that the higher the value of R², the better the model. However, adding more independent variables or predictors to a regression in the Machine Learning model tends to increase the R-squared value, which tempts us to add even more variables. This may result in overfitting of the model and can return an unwarranted high R-squared value.
Adjusted R² is a modified version of the R² where adjustments are made according to the number of predictors involved. The adjusted R-squared value increases when the new term(predictor) improves the model more than would be expected by chance. It decreases when a predictor improves the model by less than expected.
Turn Learning into Career Growth
Residual Analysis
What are Residuals?
Residuals, also known as errors, in a statistical or machine learning model are the differences between observed and predicted values of data. They help us in assessing the quality of a model.
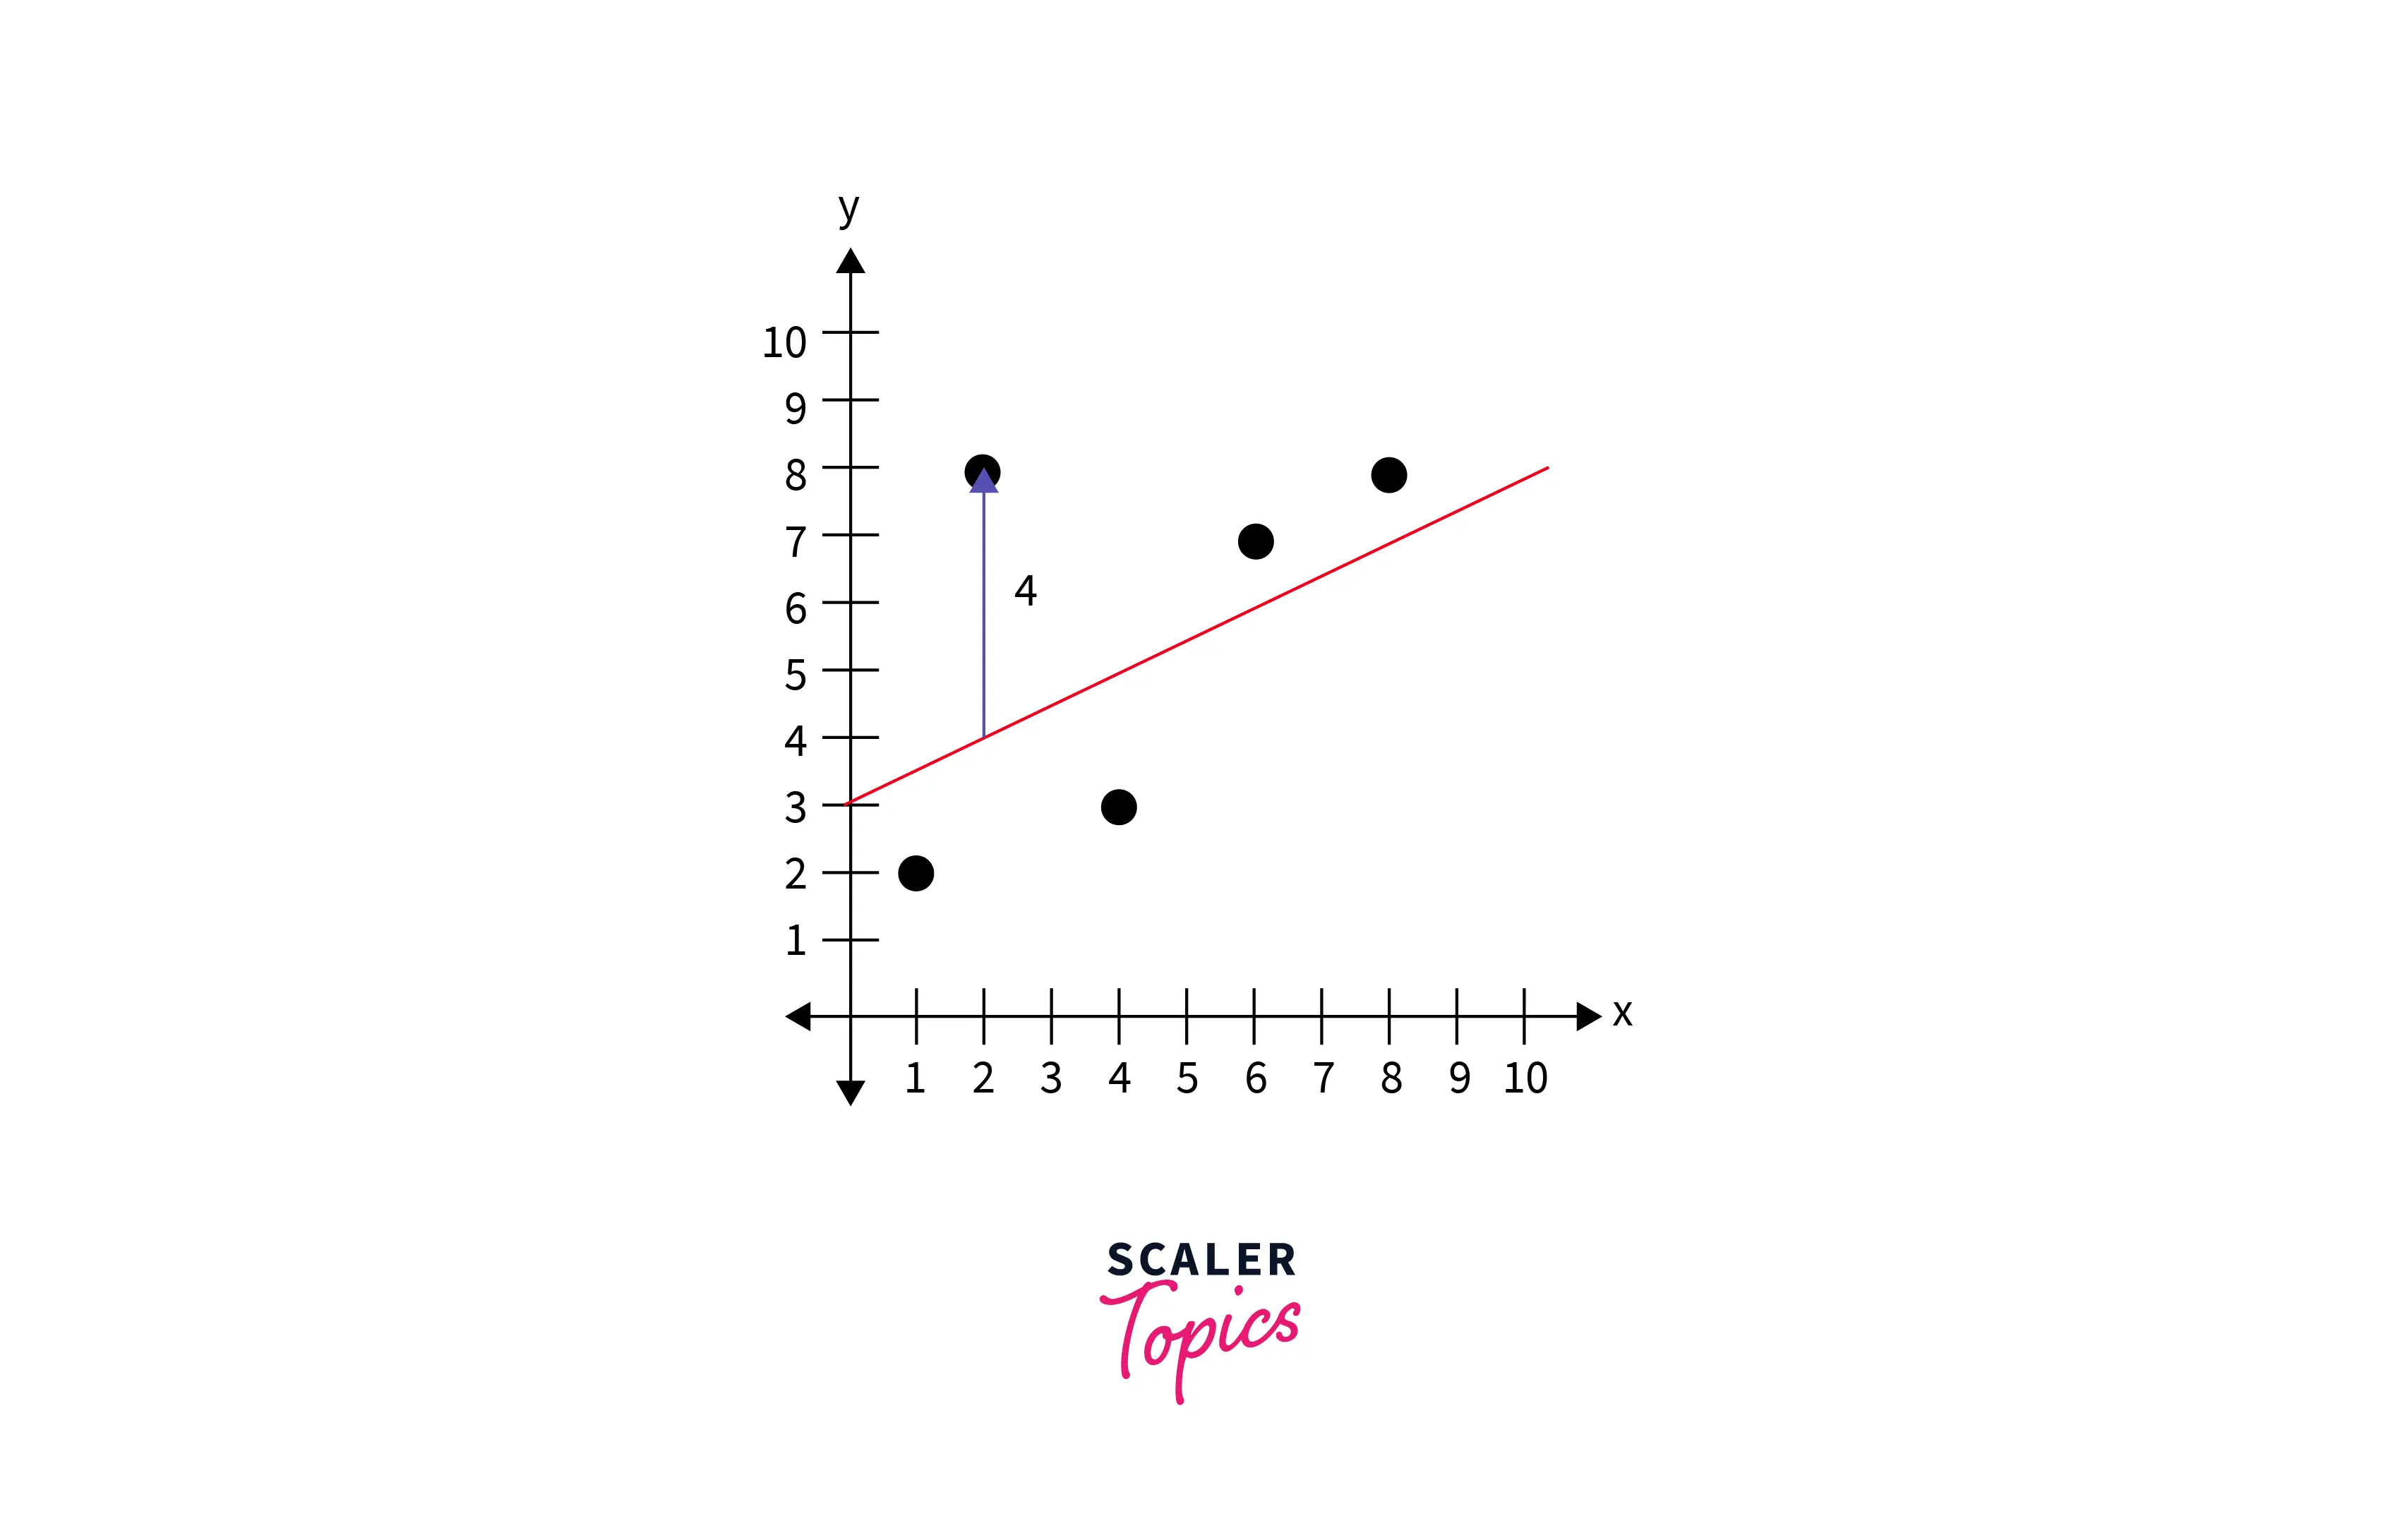 The blue line is our fit line generated by the model. The green line is the residual. The residual is positive for data points above the line, and the residual is negative for data points below the line.
The closer a data point's residual is to 0, the better the fit.
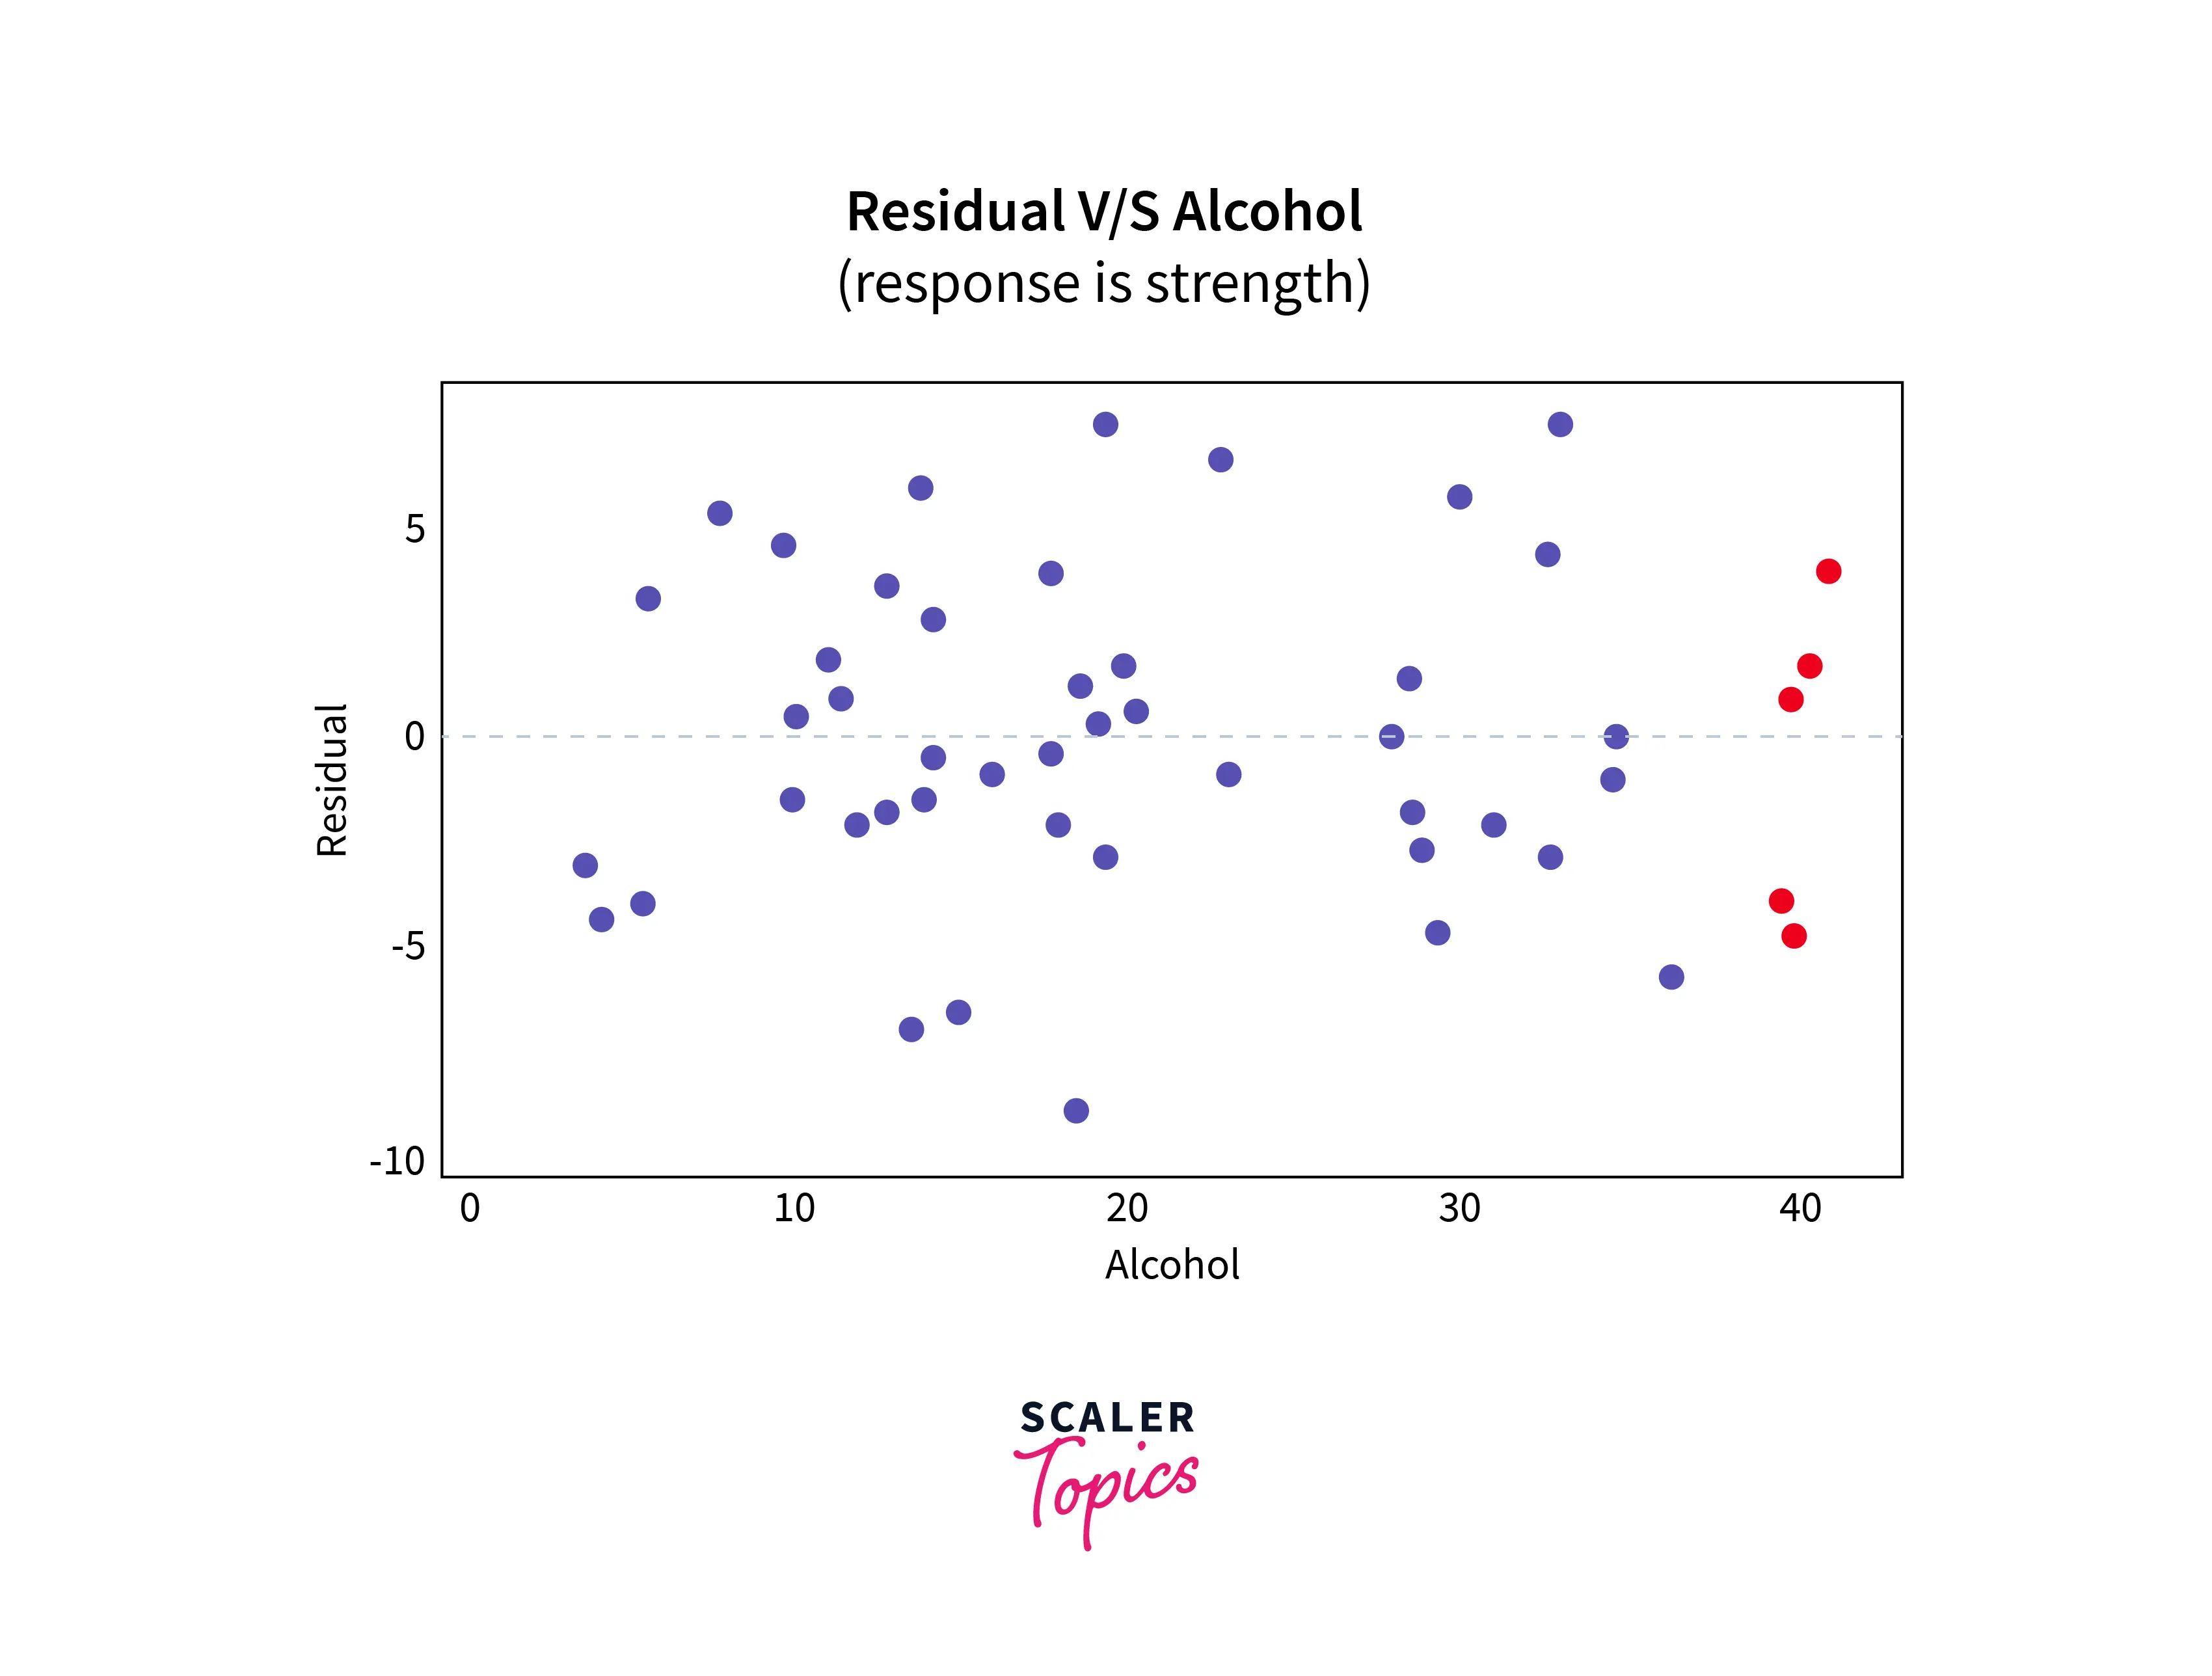
Residual vs Predictor Plots
It is a scatter plot of residuals on the y-axis and the predictor (x) values on the x-axis.
Here are the residuals vs. predictor plot for the data set's simple linear regression model with arm strength as the response and level of alcohol consumption as the predictor:
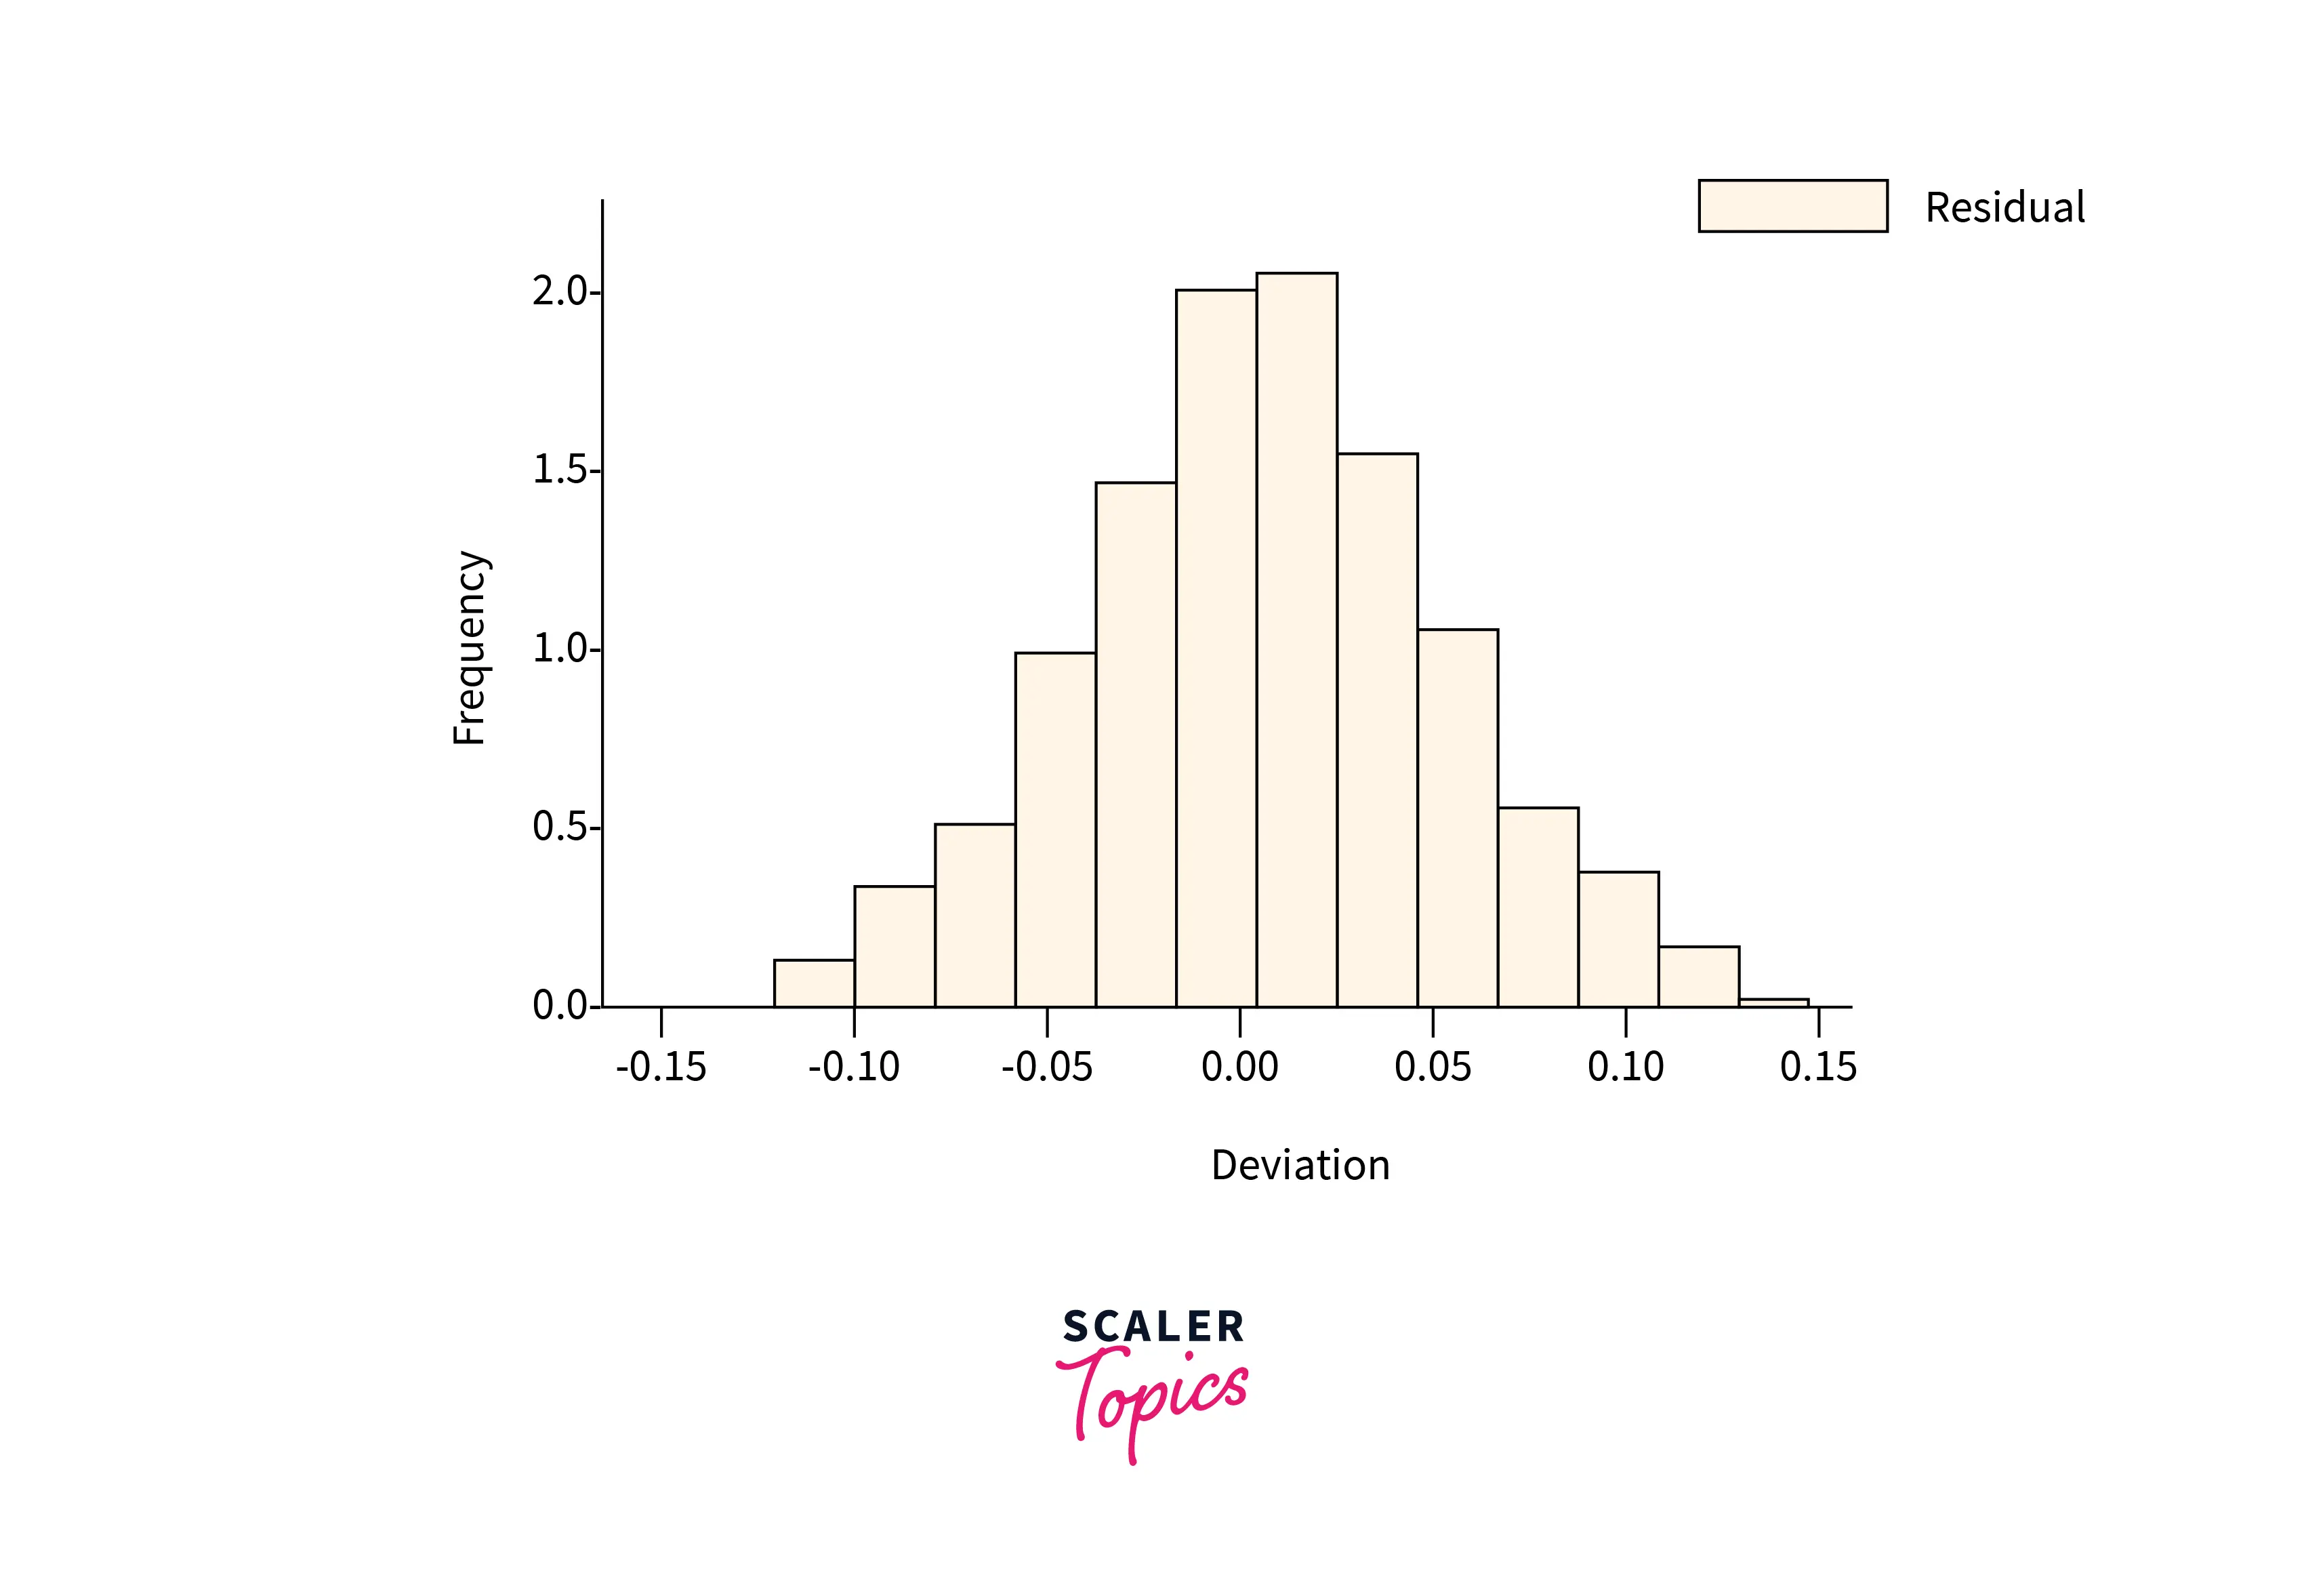
Residual Histograms
The Histogram of the Residual can be used to check whether the variance of the predicted data is normally distributed.
An asymmetric bell-shaped histogram evenly distributed around zero indicates that the normality assumption is likely to be true. Conversely, if the histogram indicates that random error is not normally distributed, it suggests that the model's underlying assumptions may have been violated.
Scaler Placement Report and Statistics
Scaler learners achieved 2.5x salary growth with average post-Scaler CTC reaching ₹23L.
What is Heteroskedasticity, and How to Measure It?
Heteroskedasticity refers to a situation where the variance of the residuals is unequal over a range of measured values.
One informal way of detecting heteroskedasticity is by creating a residual plot where you plot the least squares residuals against the explanatory variable or y^ if it’s multiple regression in Machine Learning. If there is an evident pattern in the plot, then heteroskedasticity is present.
Formal Method: Breusch-Pagan test. It involves using a variance function and using a χ2-test to test the null hypothesis that heteroskedasticity is not present (i.e. homoskedastic) against the alternative hypothesis that heteroskedasticity is present.
Out-of-sample Error
It is a measure of how accurately an algorithm can predict outcome values for previously unseen data. It is also termed a generalization error for regression in Machine Learning.
In Sample Error
It is a measure of how accurately an algorithm` can predict outcome values for the data the model was trained on.
Conclusion
The key takeaways from this article are:-
- Regression in Machine Learning is a supervised learning technique that helps in finding the correlation between variables and enables us to predict the continuous output variable based on one or more predictor variables.
- R-Squared determines the proportion of variance in the dependent variable that can be explained by the independent variable. Adjusted R-squared is an upgradation over R-squared.
- Residuals are the differences between observed and predicted values of data in Regression in Machine Learning.