Dealing with Unclean Data - Removing Outliers
Overview
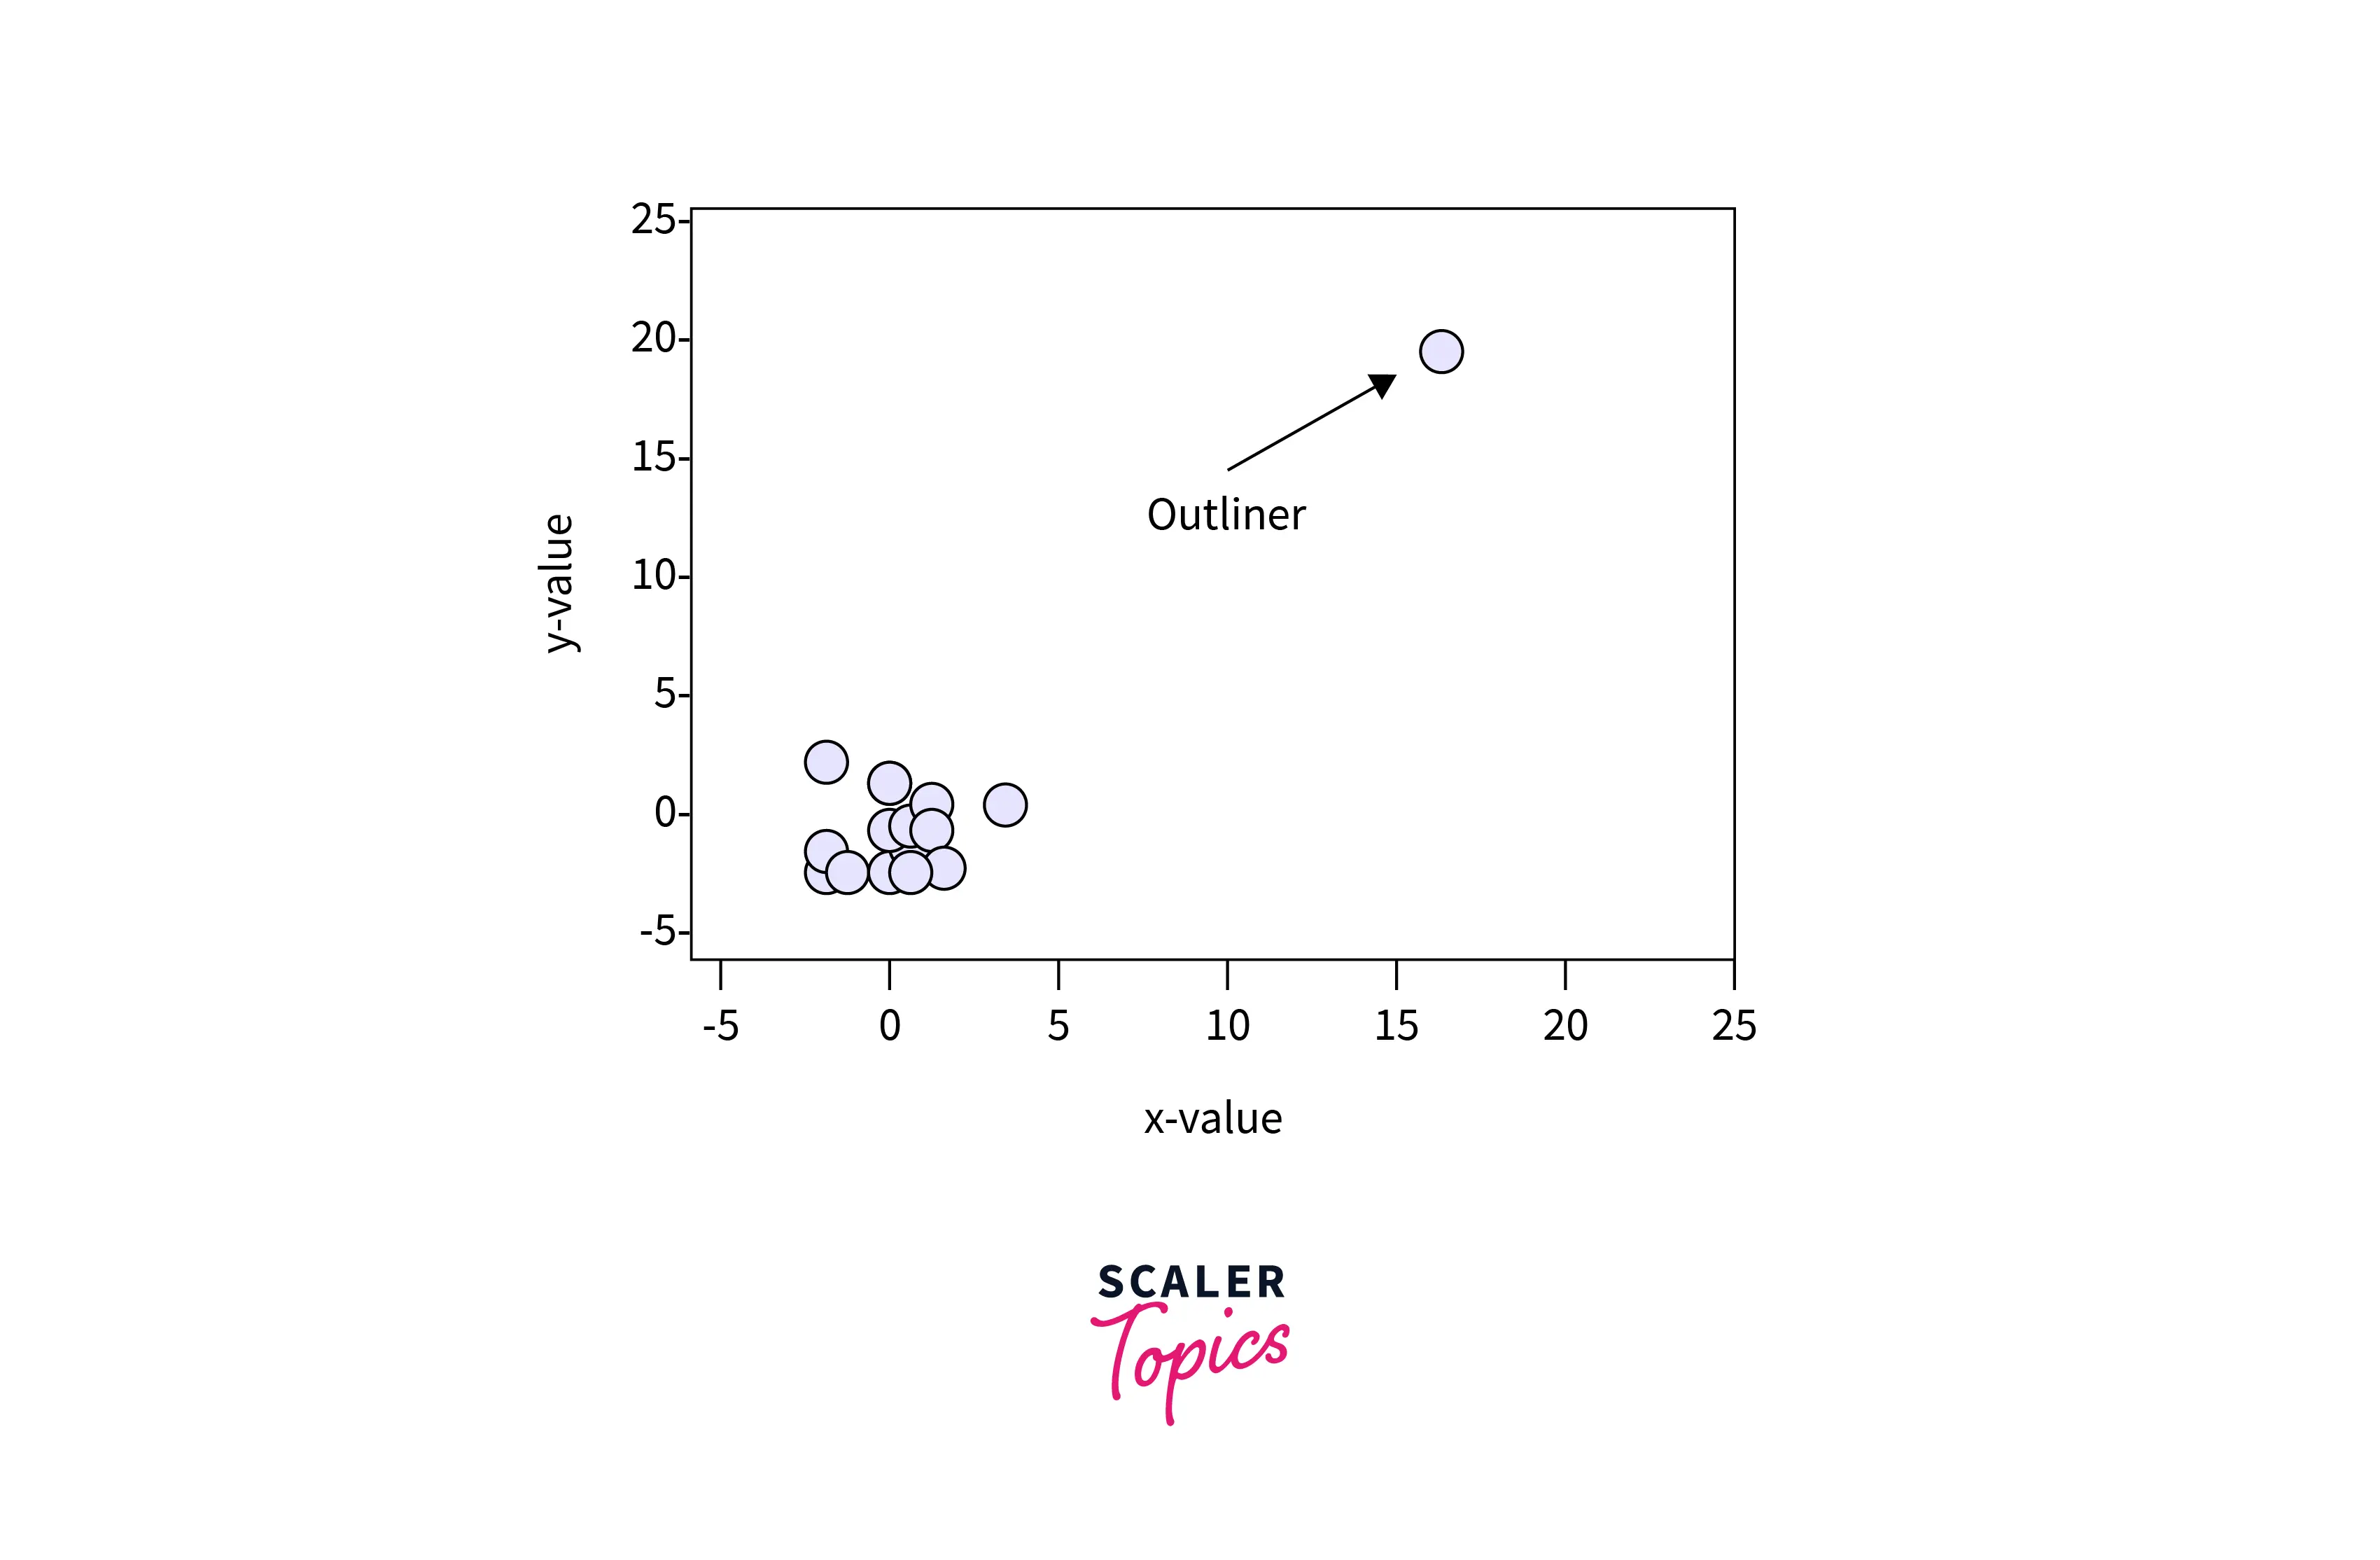
An outlier is an extreme value that lies at an abnormal distance from other points in the dataset. Dealing with outliers is tricky because sometimes, it can reveal abnormal cases or individuals with rare traits. It can also distort statistical analyses and violate their assumptions. In general, machine learning modeling and model skills can be improved by understanding and even removing these outlier values. Hence it is sometimes recommended to remove outliers from data before feeding it to the machine learning model. In this article, we will understand what outliers are, when we should remove them, different statistical analyses that can handle them, and techniques for removing them.
Pre-requisites
- Learners must know different metrics for performance measurement of machine learning algorithms like precision, recall, f1 score, etc.
- Knowledge about standard deviation, mean, quantile, and other statistical measures is required.
- Knowledge of different one-class classification algorithms is also required.
Transform Your Career
Choose from our industry-leading programs designed for career success
Modern Software and AI Engineering Program
Master full-stack development with AI integration

Modern Data Science and ML with specialisation in AI
Advanced data science techniques with AI specialization
Advanced AIML with Specialisation in Agentic AI
Deep dive into AIML with focus on Agentic systems
DevOps, Cloud & AI Platform Engineering
Build and manage AI-powered cloud infrastructure
AI Engineering Advanced Certification by IIT-Roorkee
Premier AI engineering certification from IIT-Roorkee
Introduction
Outliers are data points at an extreme distance from other data points in the dataset. Outliers sometime carry essential information about rare scenarios. On the flip side, it can affect the model's performance by violating statistical assumptions made by data. Hence, outliers should be treated judiciously, and if required, they should be removed from the data before feeding it to the machine learning model. This article will cover outliers, when we should remove them, statistical analyses that are outlier proof, and different methods for eliminating outliers with python code.
Scaler Placement Report and Statistics
Scaler learners achieved 2.5x salary growth with average post-Scaler CTC reaching ₹23L.
What are Outliers?
As mentioned earlier, outliers are extreme values present in data. One can look into small data and decide whether it is an outlier. Consider an array=[12,5, 9, 11, 72, 7, 61]. In this data, 72 and 61 can be considered an outlier.
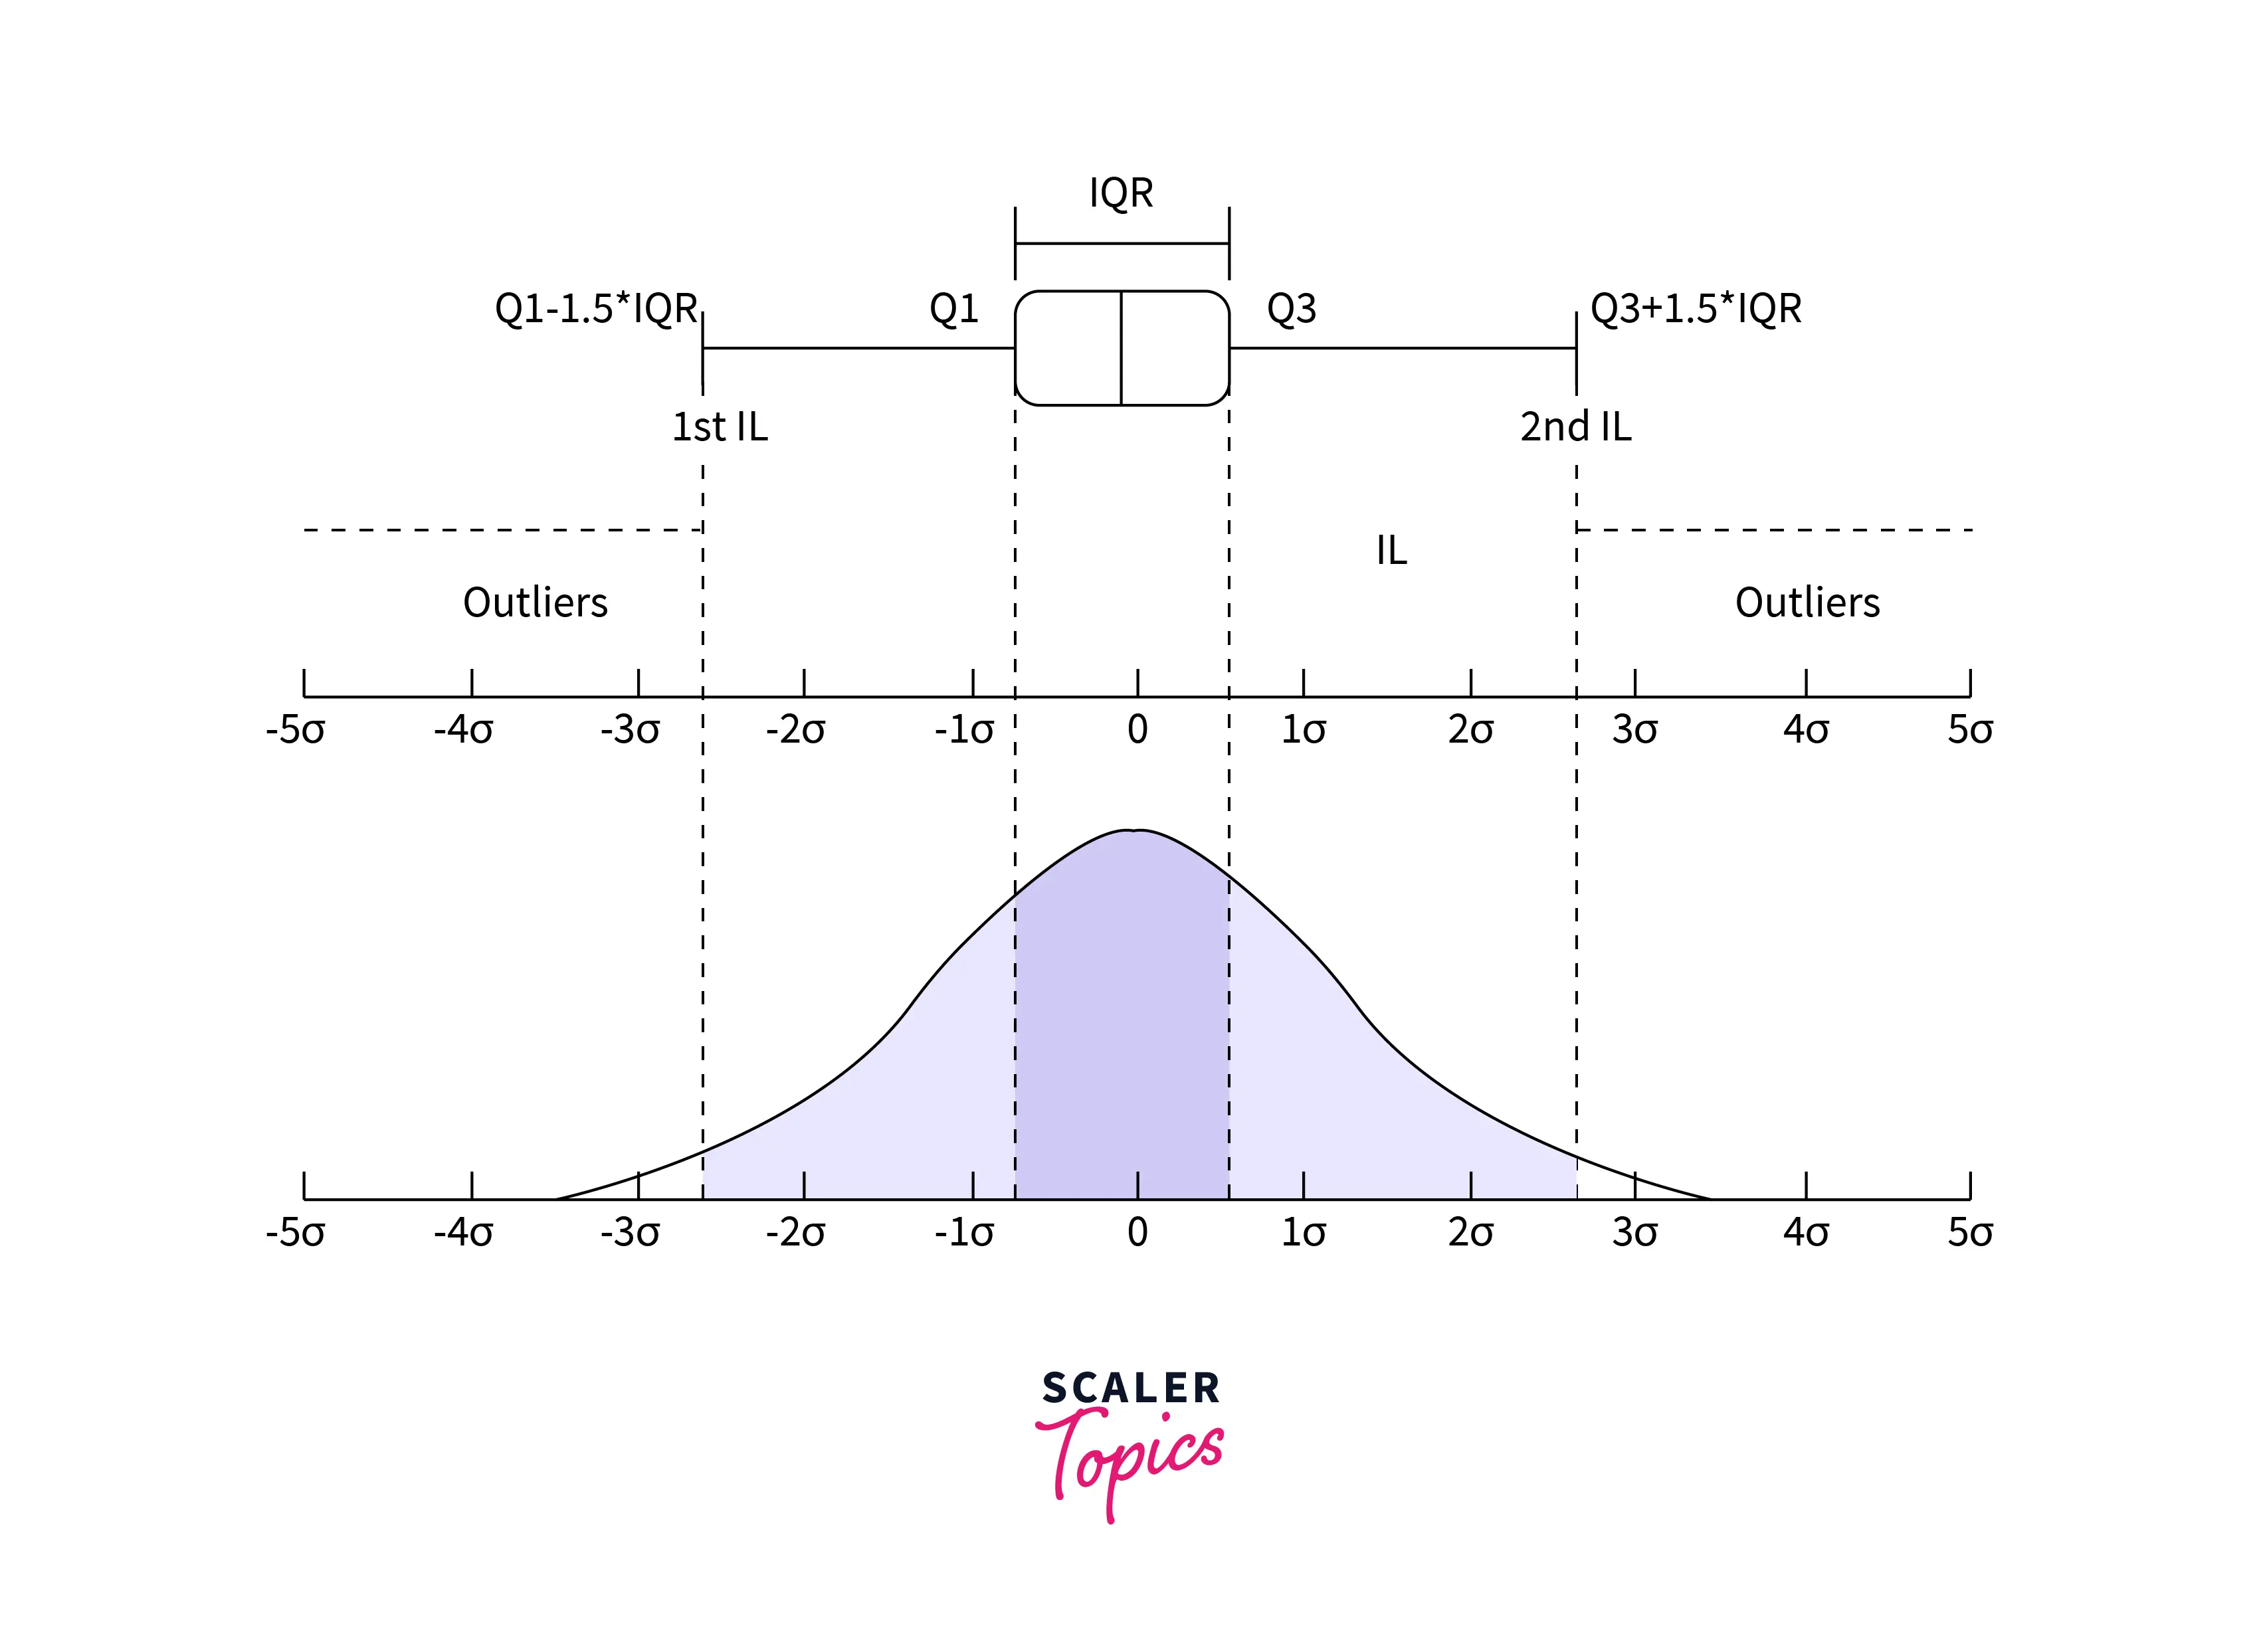
 Most of the time, data scientists deal with larger-size data. Hence, identifying outliers from data looking at a glance is not possible. Instead, there are different methods to identify and decide whether the data point is an outlier. Sometimes, a sample that lies beyond three standard deviations of the data is considered an outlier. InterQuartile Range (IQR) is also used to identify possible outliers. IQR is used to measure variability by dividing a data set into quartiles. The data is sorted in ascending order and split into three equal parts. Q1, Q2, and Q3, the first, second, and third quartiles, are the values that separate the four equal parts. Q1, Q2, and Q3 represent the data's 25th percentile, 50th percentile, and 75th percentile, respectively. IQR is the range between the first and the third quartiles, namely Q1 and Q3: IQR = Q3 – Q1. The data points that fall below Q1 – 1.5 IQR or above Q3 + 1.5 IQR are outliers.
When Should You Remove Outliers?
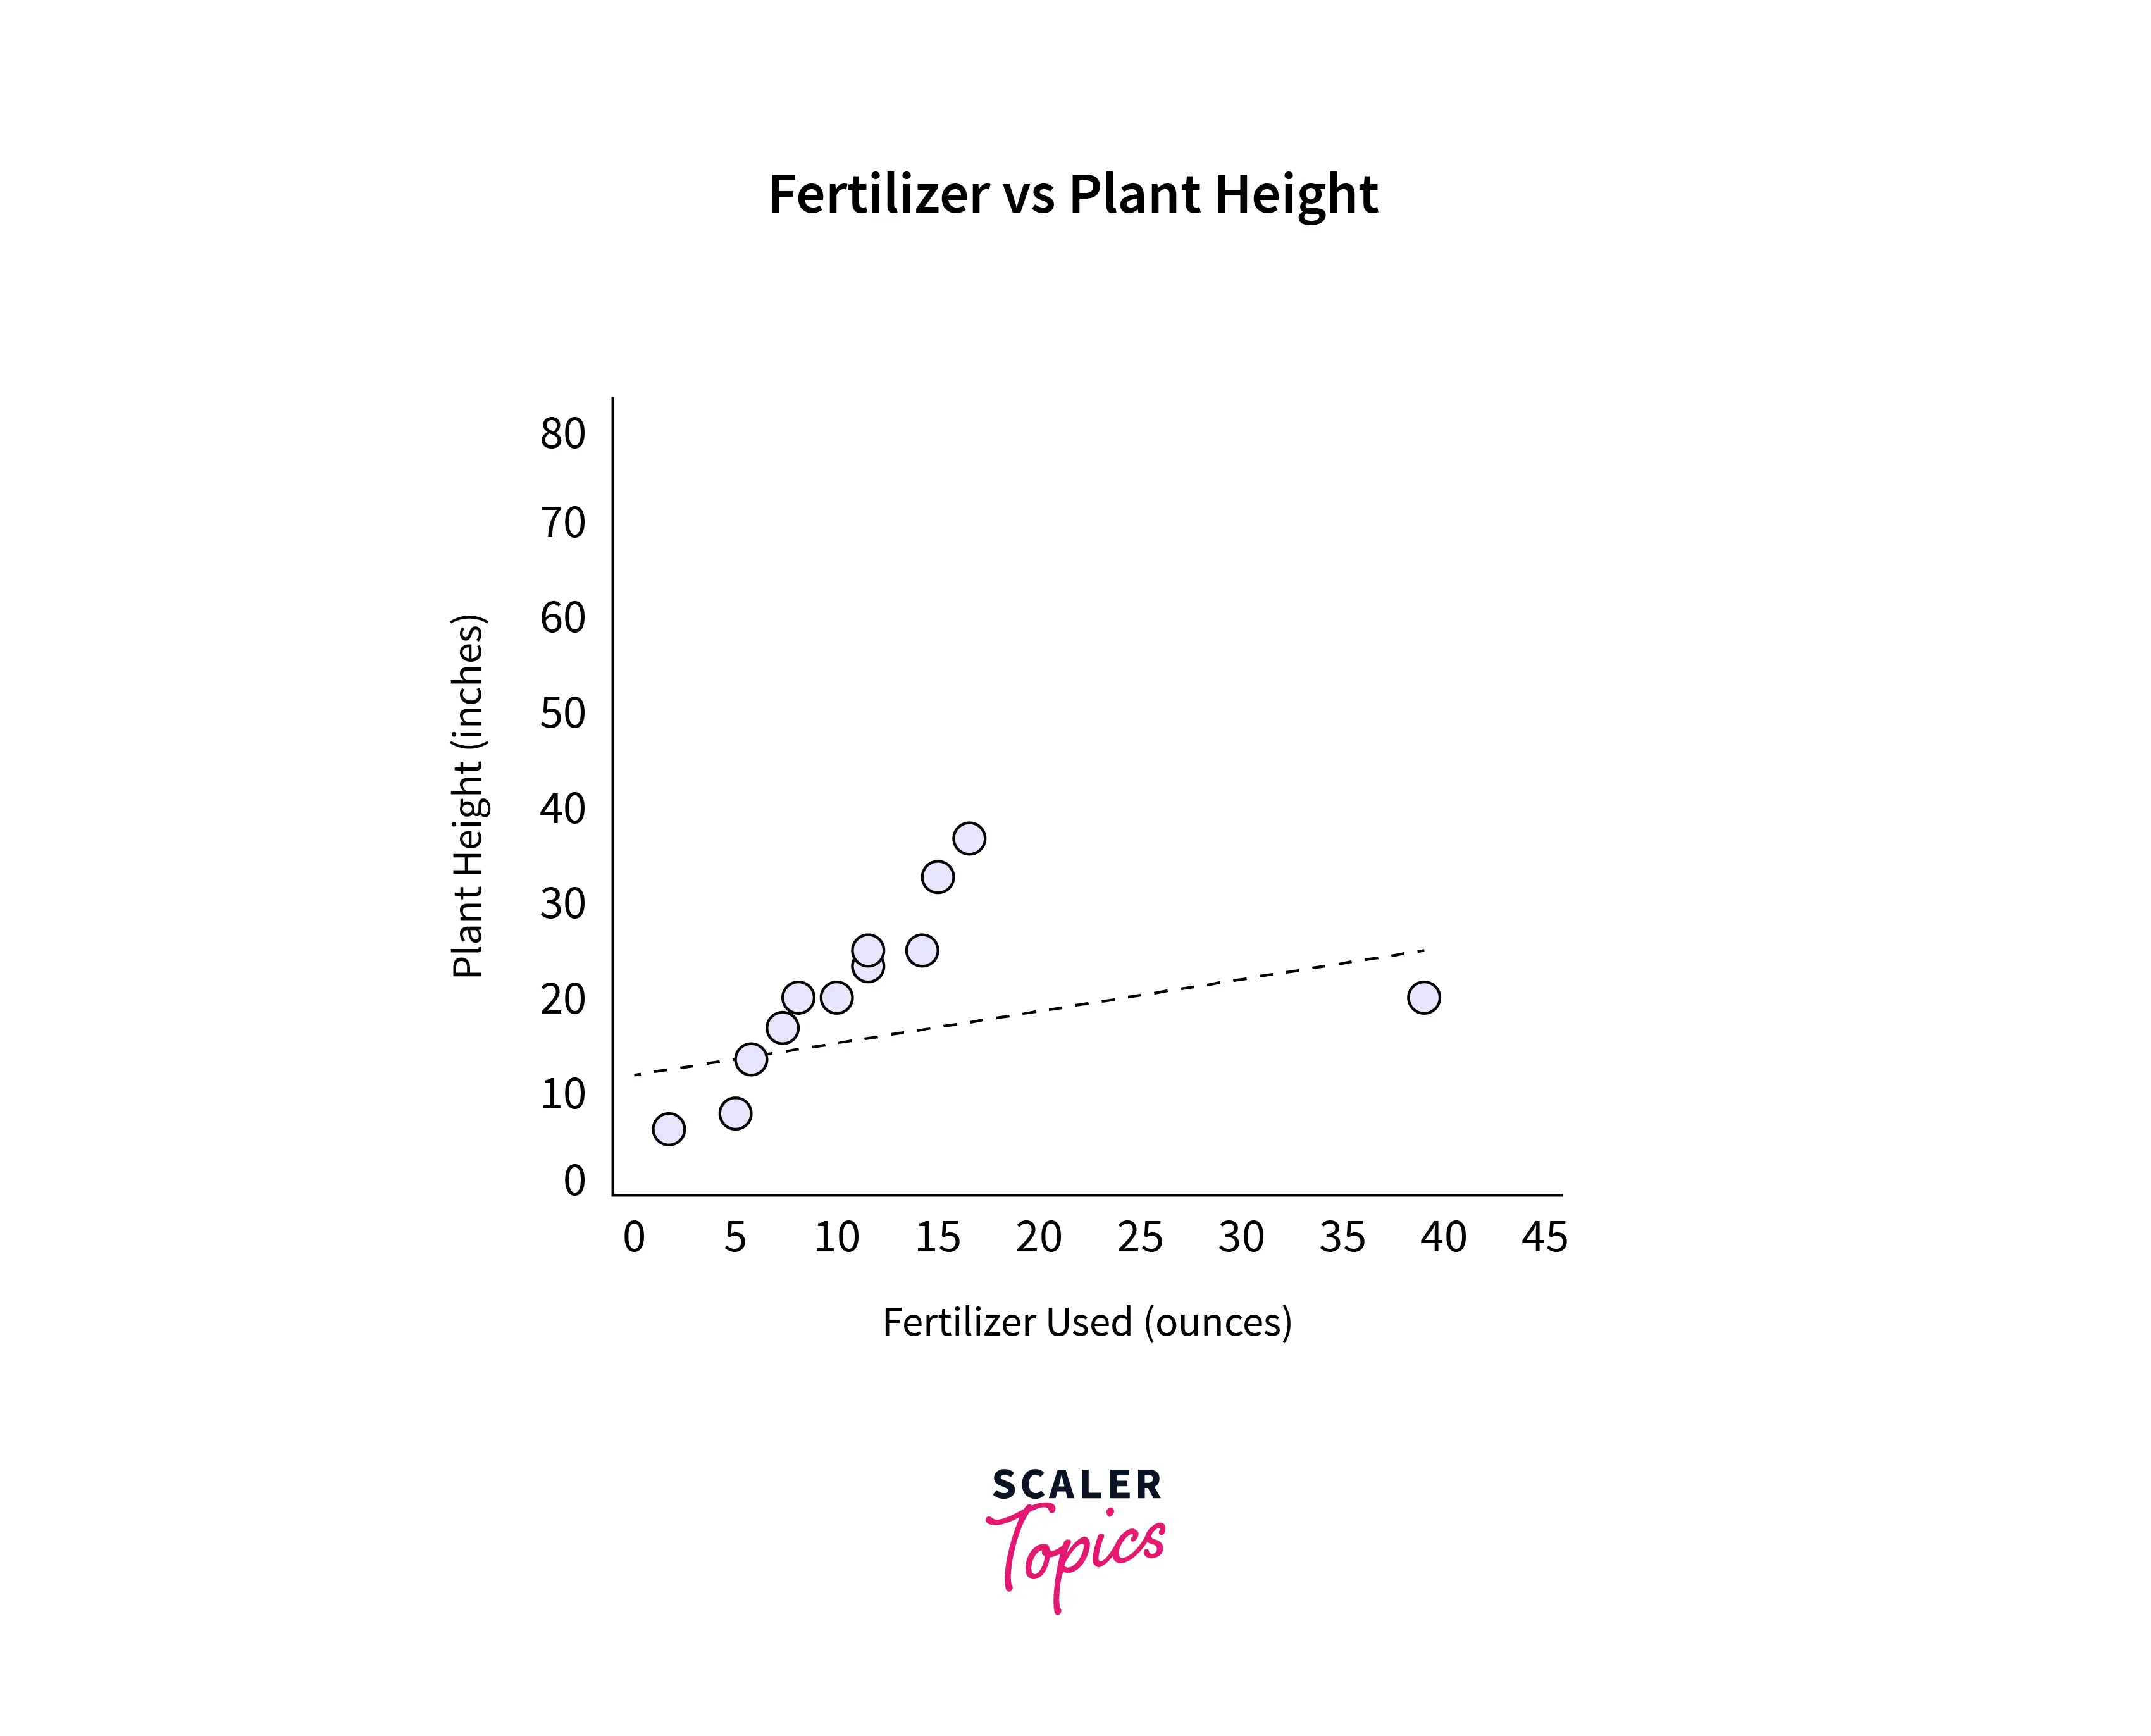
Outliers sometimes affect the performance of a model, But they also uncover rare traits. Hence, whether to keep an outlier or not, that decision should be made judiciously. Look at the figure shown below:
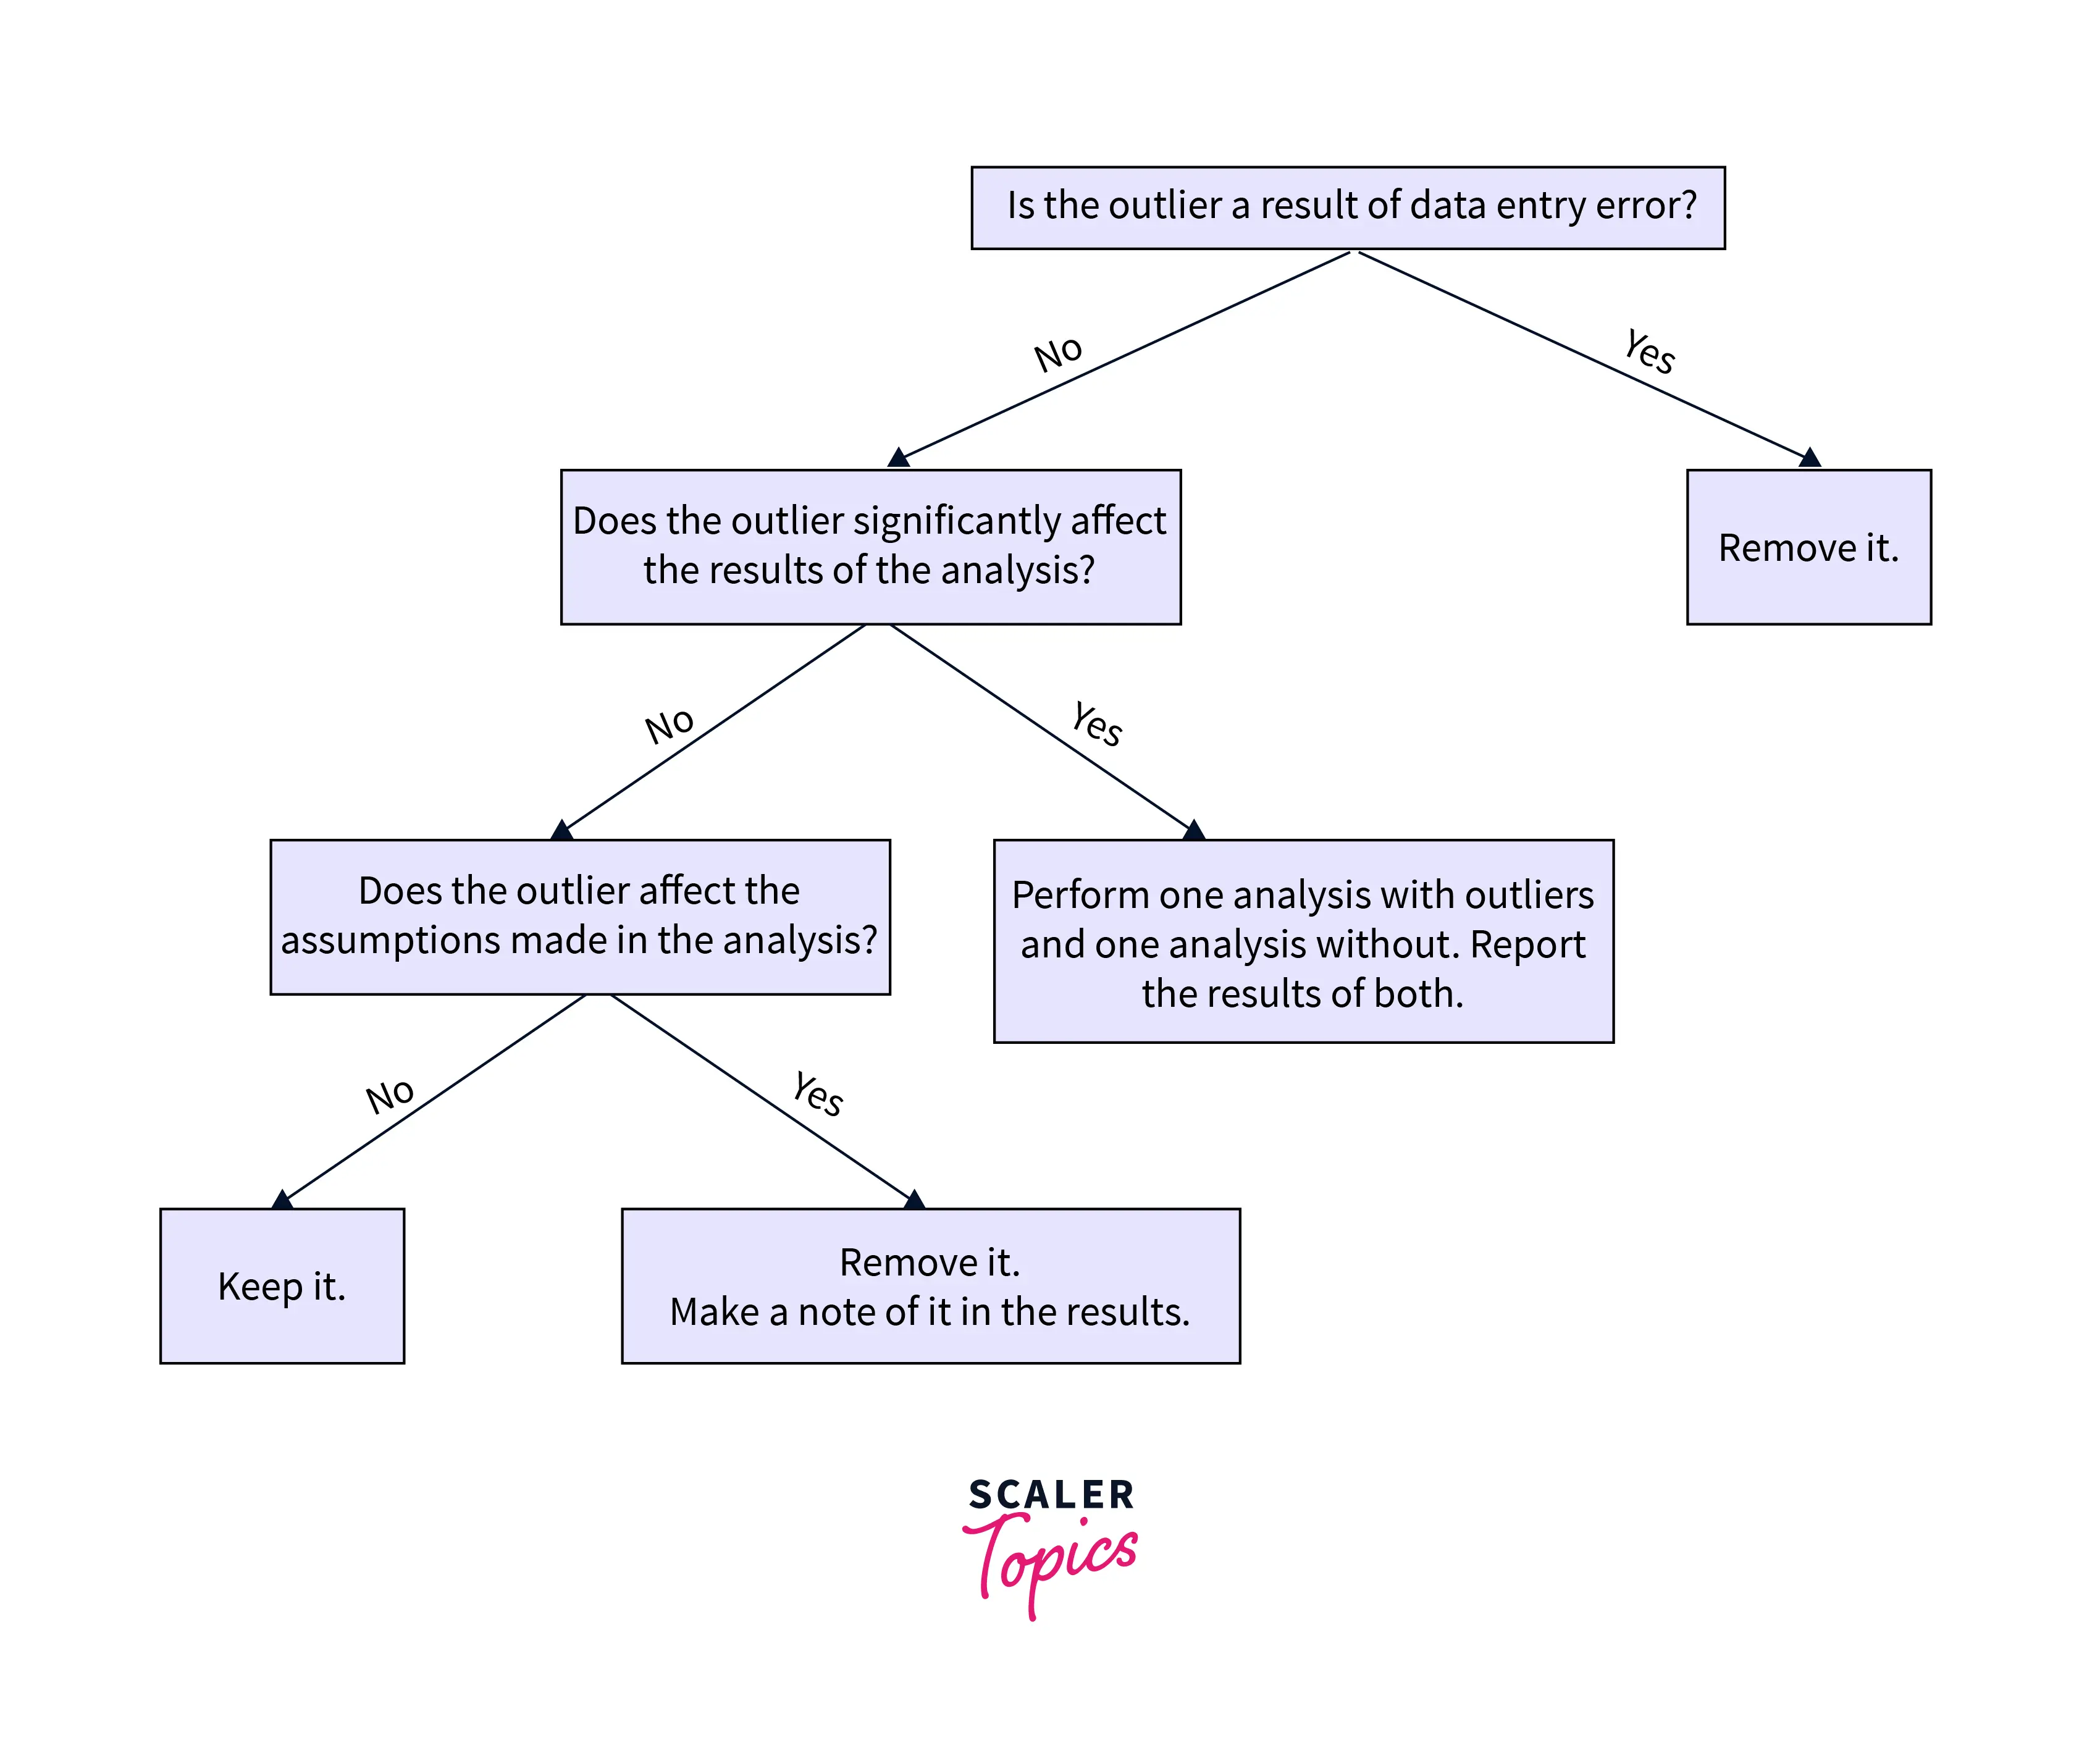
Let's look at the image above. First, checking if the error is due to data entry is recommended. Suppose we observe the weight of a student is entered as 350kg in a survey. We can delete the entry as it is due to a manual error. Next, if the outlier is not because of manual error, we need to check its impact on the statistical analysis. Look at the table shown below:
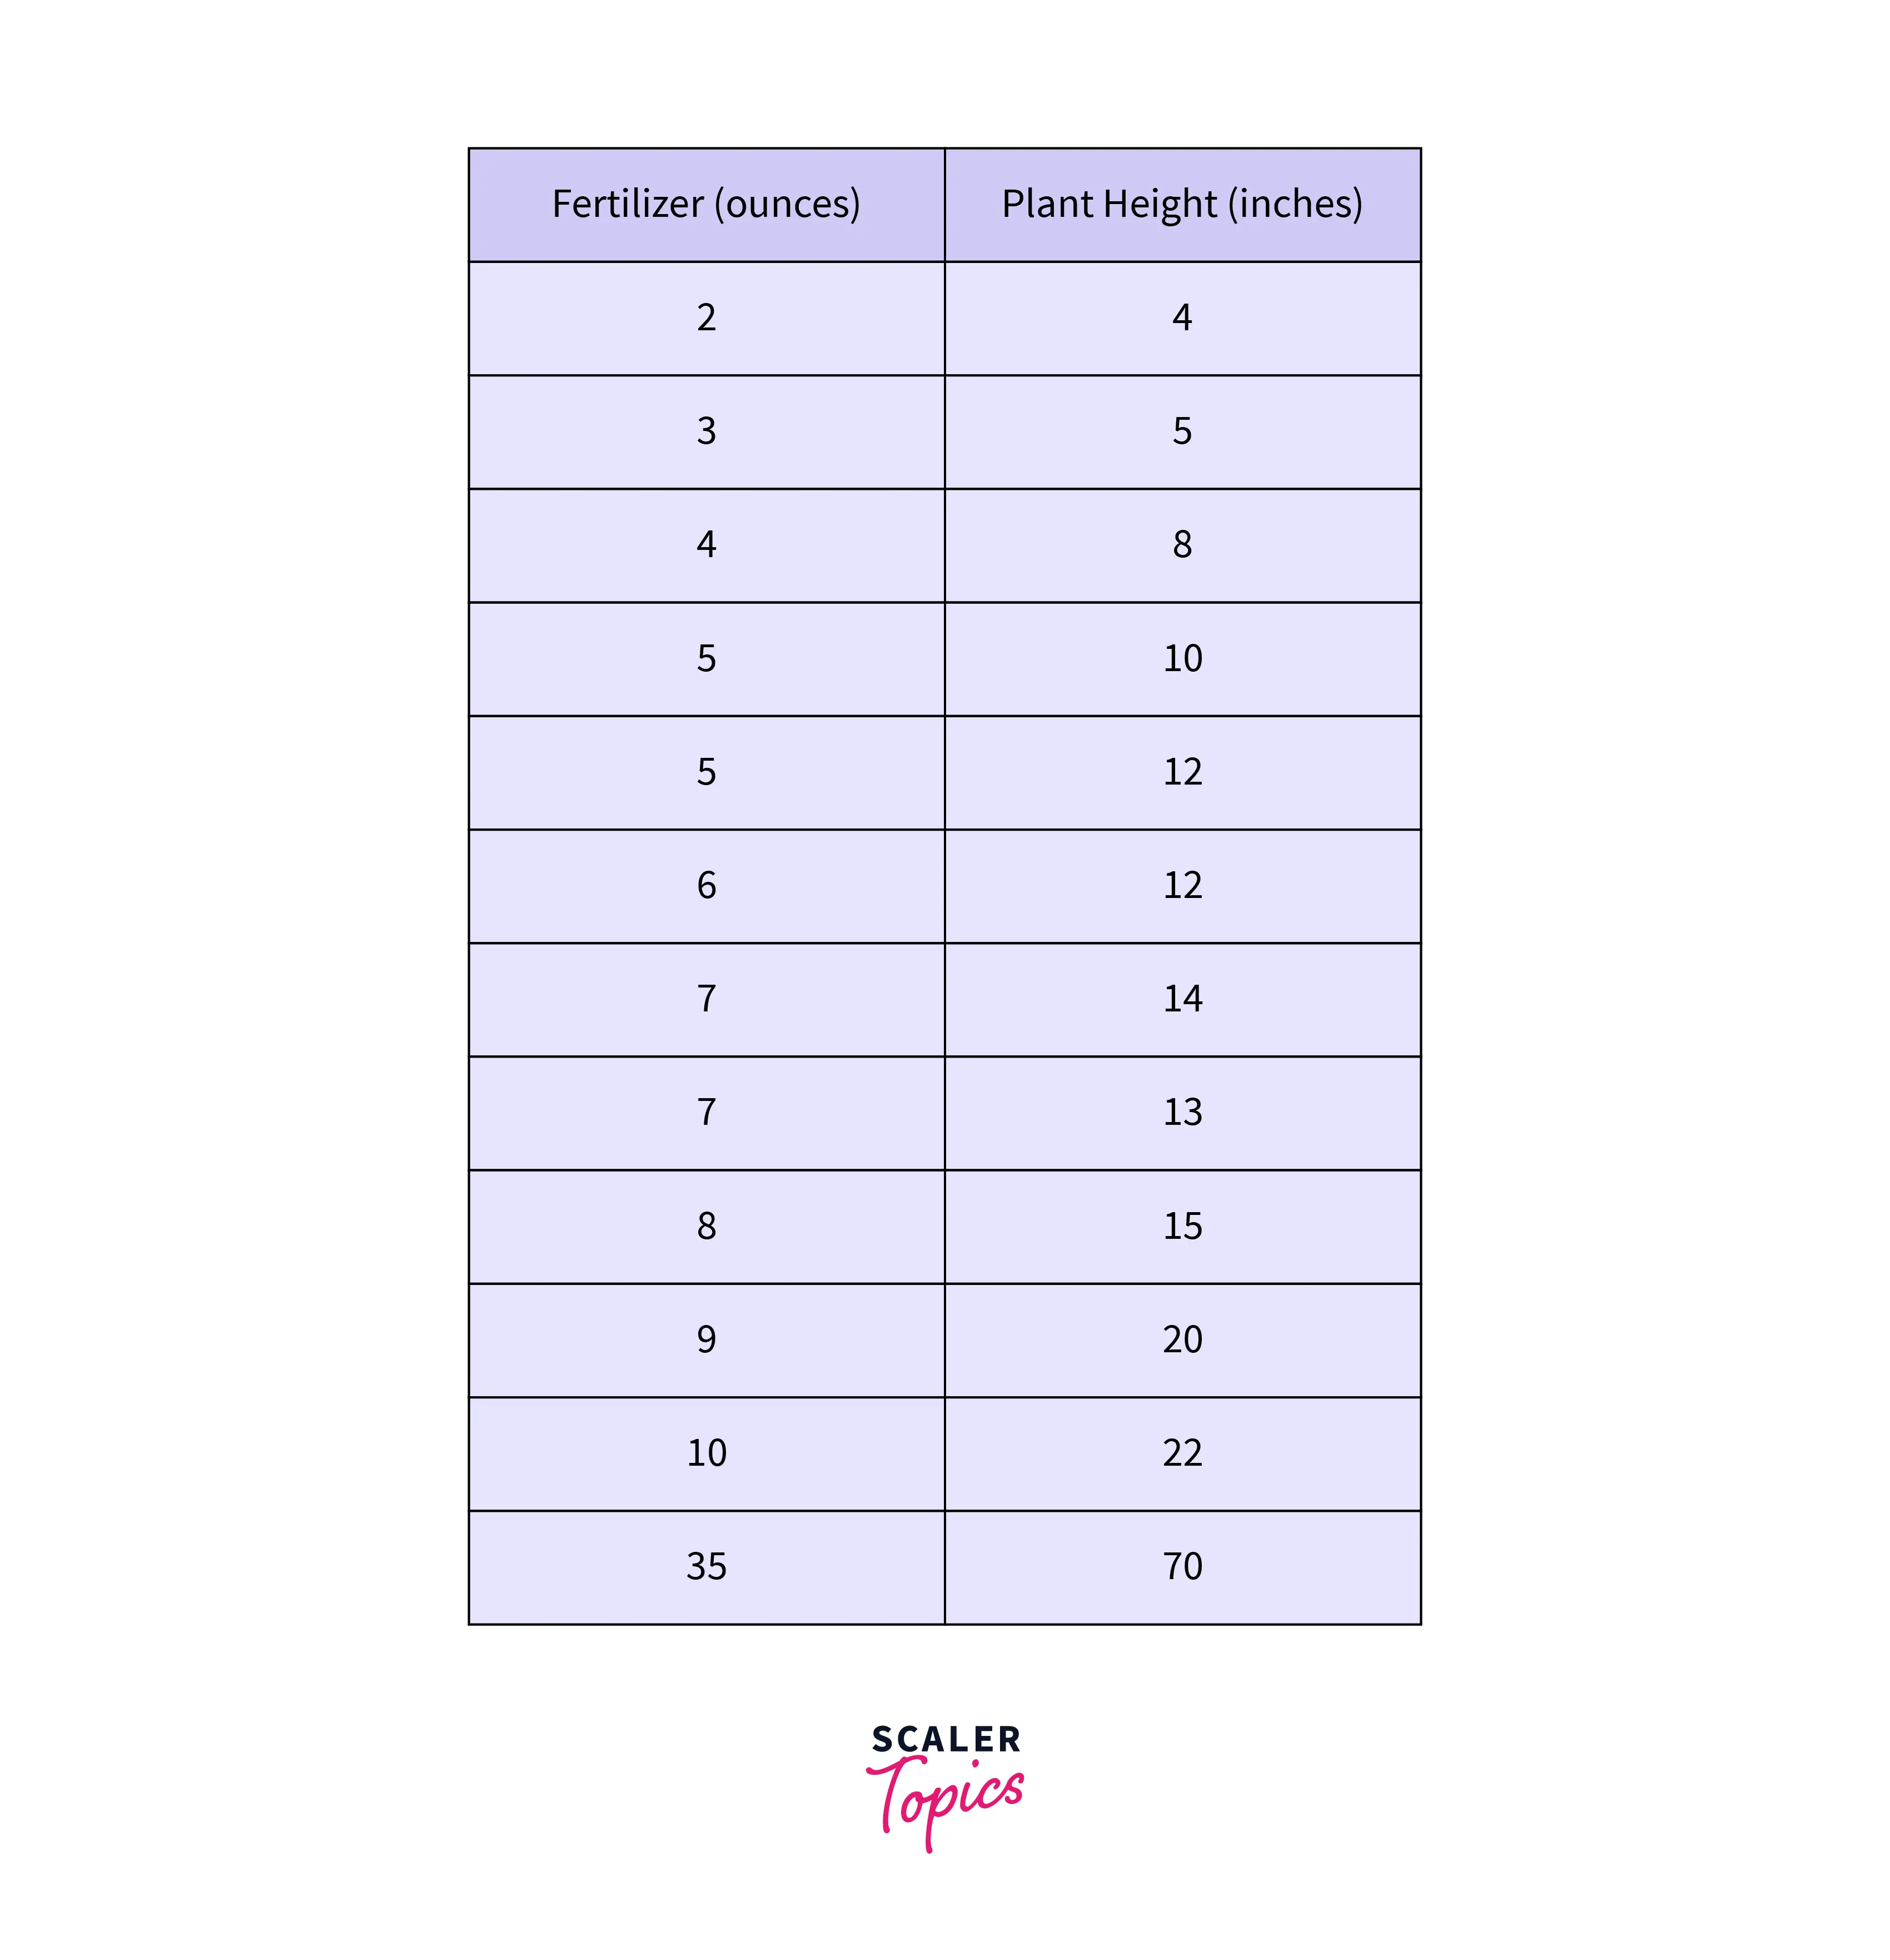
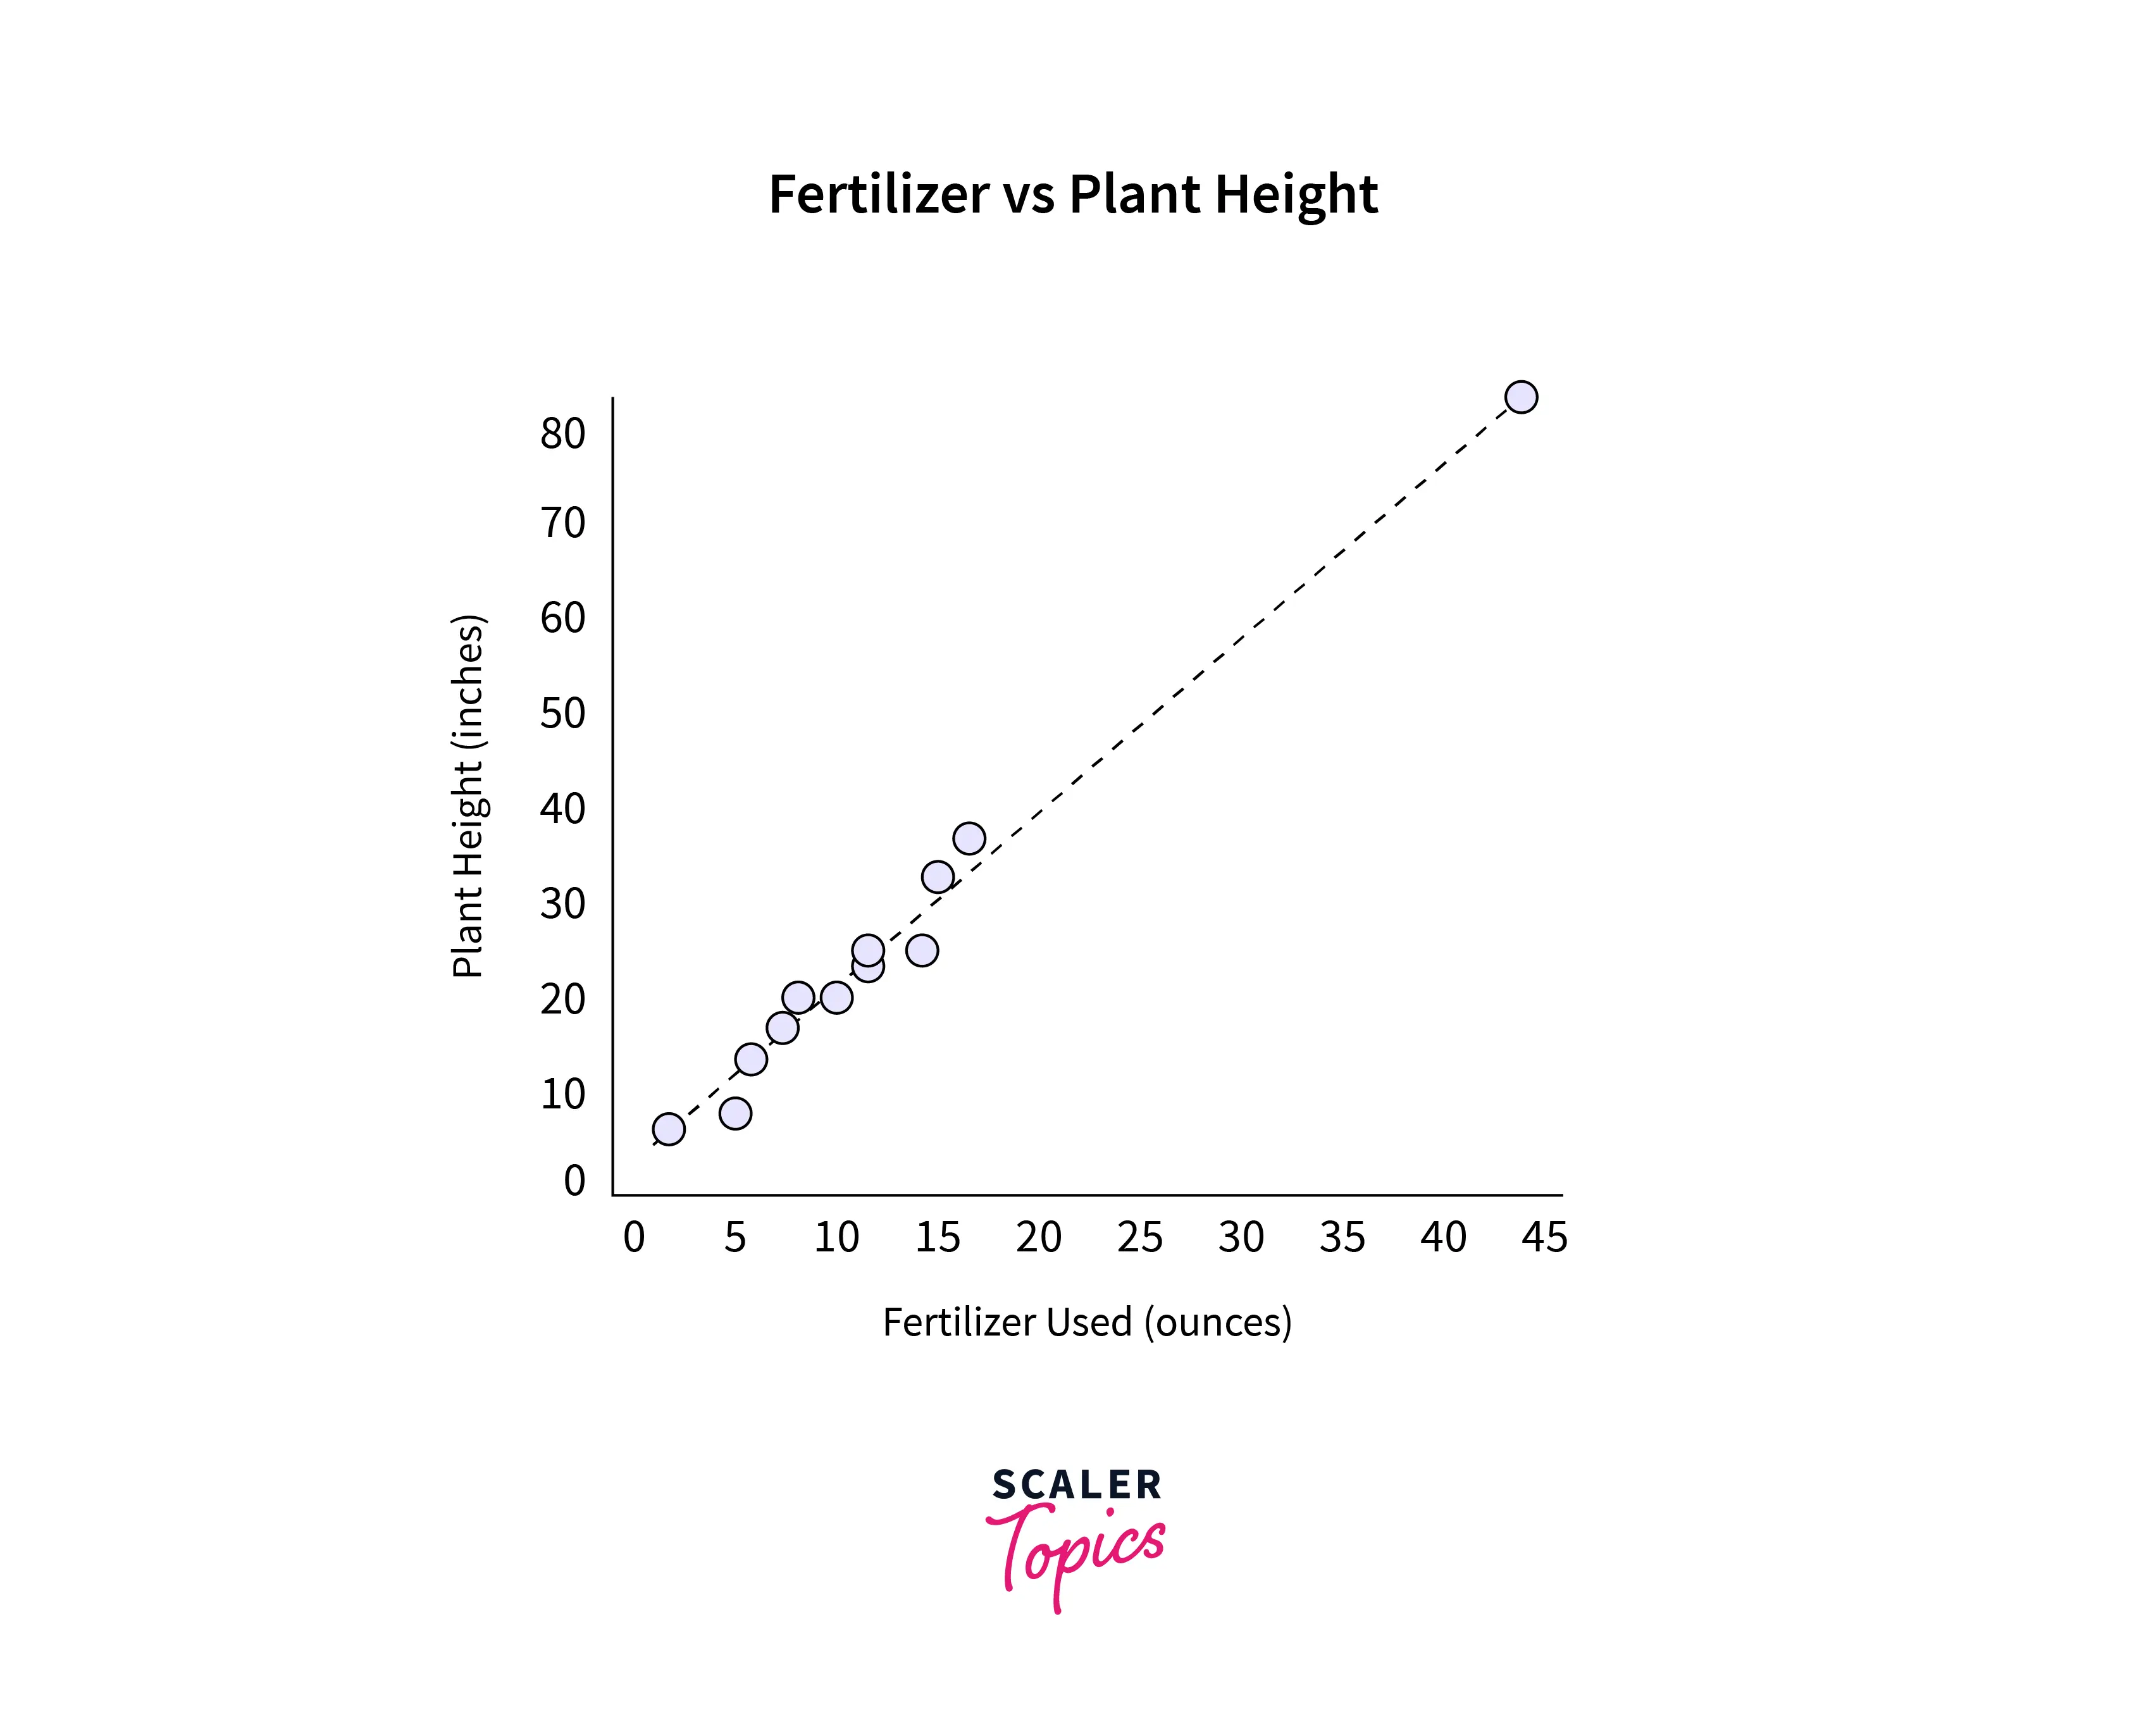
Here, the last entry seems like an outlier. So here, we perform two regression plots, one without the outlier and one without the outlier.
Undoubtedly, the outlier changes the slope of the regression line significantly. Hence, we can safely discard it.
If the analysis shows that the outlier doesn't impact the result, one needs to check if it contradicts the assumptions made in the analysis. If yes, then again, we can discard the outlier, or there is no harm in keeping the outlier and feeding the data to the model.
Statistical Analyses that Can Handle Outliers
Sometimes we have to keep the outliers even though it violates statistical assumptions. In such a scenario, it is recommended to keep them, making sure that they do not distort the result. There are statistical methods that can help in such situations. Data transformation techniques like taking the square root, log, reciprocal, or square of features mitigate the impact of an outlier. Thus, after applying these transformations judiciously, one can perform regression in data. Some robust regression analysis packages can handle outliers automatically. Using the bootstrapping technique is another solution, as they make no assumptions about the data distribution. To summarise, with the help of these techniques, we can capture the entire variability of the data without hampering any statistical assumptions.
Turn Learning into Career Growth
Methods to Remove Outliers (with Code Examples)
Several methods can help us to detect the outlier. Once detected, we can quickly eliminate them from our data before feeding the data into a model. Here, we will discuss three different methods to identify and remove outliers. Python code for each of these is presented for a better understanding of the readers.
Standard Deviation Method
If data follows gaussian or nearby gaussian distribution, the standard deviation can be used as a cut-off for identifying outliers. For data following gaussian distribution, its mean summarises the percentage of values in the sample. For example, 1 Standard Deviation from the mean covers 68% of data, 2 Standard Deviations from the mean cover 95% of data, and 3 Standard Deviations from the mean cover 99.7%.
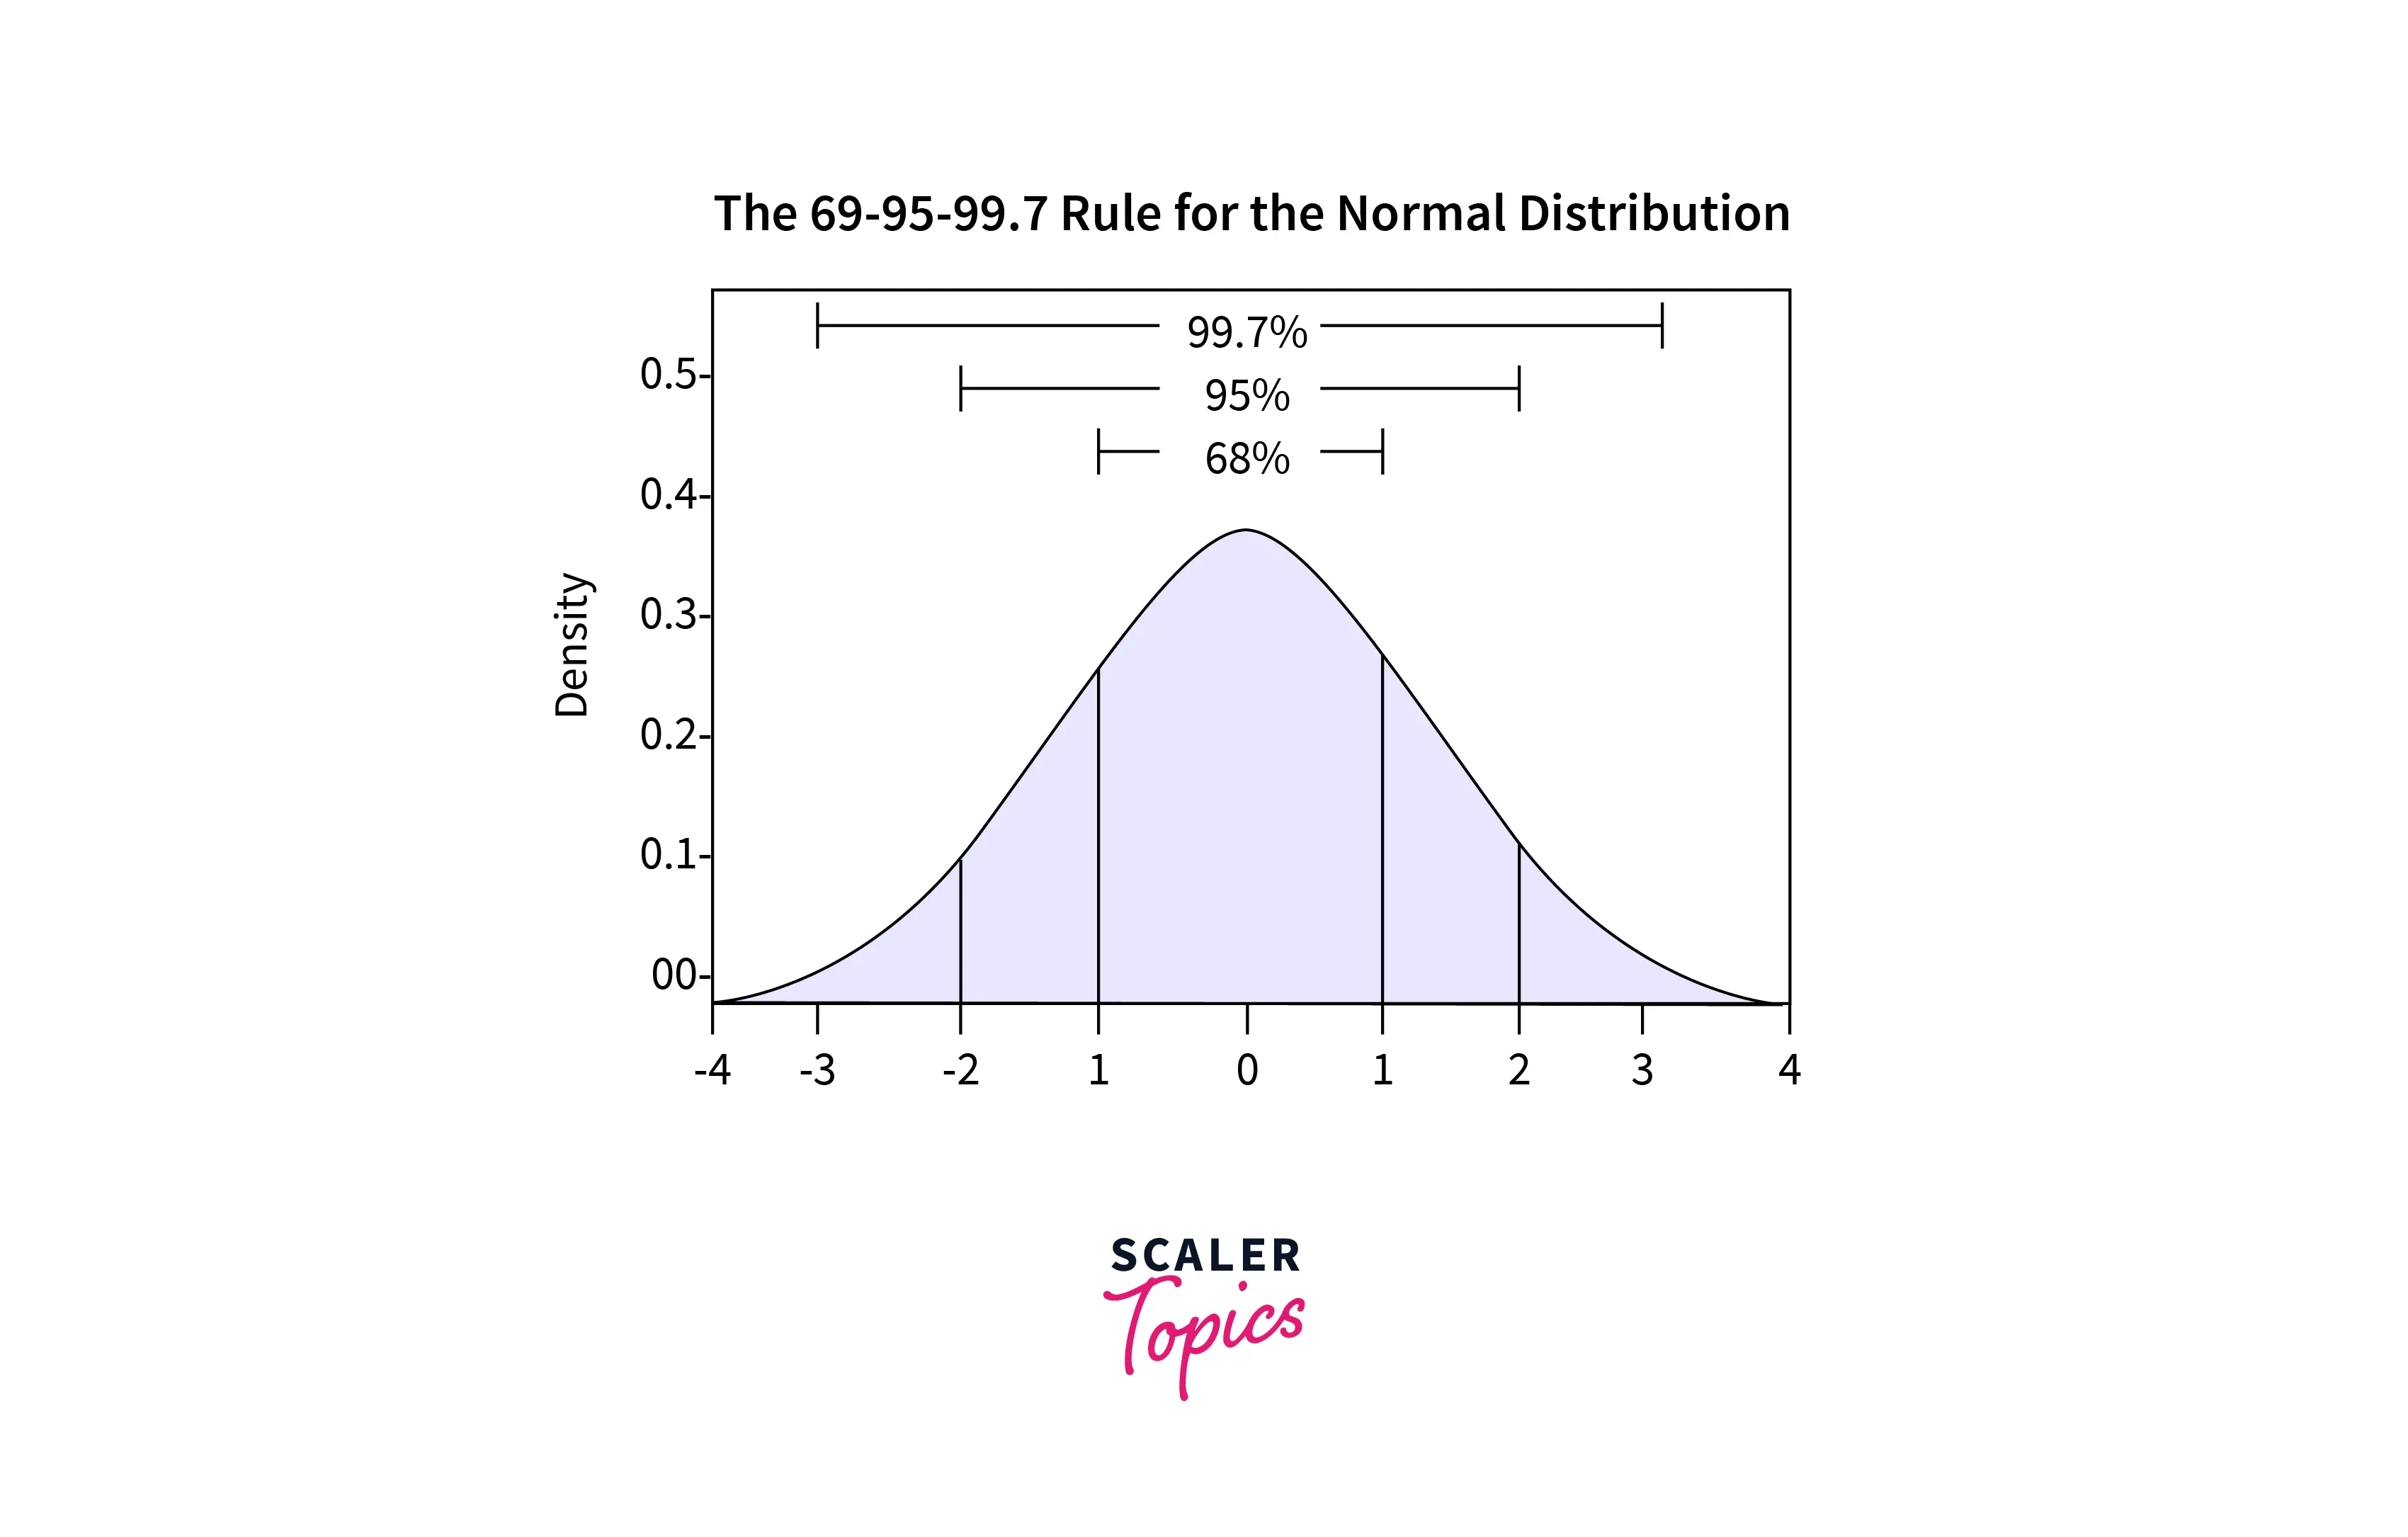
Generally, samples that are three standard deviations from the mean can be considered outliers. Occasionally, the data is standardized first using a Z-score. Next, outlier detection can be completed using Z-score cut-off values. A python code is shown below:
Output:
Interquartile Range Method
Training data may only sometimes follow Gaussian distribution or nearly Gaussian distribution. In such cases, the Interquartile Range, or IQR for short, helps to eliminate outliers. The IQR is the difference between the data's 75th and 25th percentiles. It represents the box in a box and whisker plot. IQR-based outlier detection techniques assume that the non-anomalous data points lie at high-density regions, while outliers would occur sparsely.
Python code for removing outliers based on IQR is shown below:
Output:
Automatic Outlier Detection: One-Class Classification
One-class classification is another approach for identifying outliers. A one-class classifier is trained on data without an outlier. Once training is done, it can identify data comprised of both outliers. The local outlier factor(LOF) algorithm works based on the nearest neighbors technique for outlier detection. Here, samples are given a score based on how isolated they are based on their local neighborhood. Examples with the most significant score are more likely to be outliers.
Python code for LOF is given below:
Output:
Conclusion
- Outliers are extreme values present in data. Removing outliers in machine learning is crucial before feeding the data into the model.
- In this article, we have discussed what outliers are.
- We have also presented when one should remove outliers.
- Different statistical analyses that can handle outliers are covered here.
- Different methods for removing outliers are presented with python code for better understanding for readers.