Standard Metric in Machine Learning
Overview
A model is the cornerstone of any Machine learning task. We all need our model to be the best in its business. To judge our model on its performance, there are certain evaluation metrics that we need to look upon. This article revolves around the standard evaluation metrics in Machine Learning.
Introduction
Performance metrics are a part of every machine-learning model. Choosing a good metric is as important as choosing a good model. They help us to track the progress of the model and put a number on it. From simple machine learning models to state-of-the-art ones like BERT need a performance metric to be judged and evaluated. There are a lot of performance metrics to choose from such as accuracy, precision, and recall. We will analyze them one by one.
Transform Your Career
Choose from our industry-leading programs designed for career success
Modern Software and AI Engineering Program
Master full-stack development with AI integration

Modern Data Science and ML with specialisation in AI
Advanced data science techniques with AI specialization
Advanced AIML with Specialisation in Agentic AI
Deep dive into AIML with focus on Agentic systems
DevOps, Cloud & AI Platform Engineering
Build and manage AI-powered cloud infrastructure
AI Engineering Advanced Certification by IIT-Roorkee
Premier AI engineering certification from IIT-Roorkee
Standard Metrics for Regression
R Square/Adjusted R Square
Definition
R-Squared (R² or the coefficient of determination) is a statistical measure in a regression model that determines the proportion of variance in the dependent variable that can be explained by the independent variable.
In other words, R² helps us to analyze how well our regression model has fit the data.
R-squared can take any value between 0 to 1.
Example
For example, if the R² of a regression model is 0.6, this means 60% of the variations observed in the target variable are explained by the regression model. Generally, the higher the value of R², the better your regression model has fit the data.
Formula
R² is based on the formula:-
Unexplained Variation: Once you get the model with the best-fit line, you would calculate predicted values, subtract actual values, and square the results. This results in a list of errors squared, which is then totalized and equals the unexplained variance.
Total Variation: To calculate this, you would subtract the average actual value from each of the actual values, square the results and sum them.
Advantage
Gives a better understanding while explaining the model to other people because you can explain the number as a percentage of the output variability.
Mean Square Error(MSE)/Root Mean Square Error(RMSE)
Definition
MSE is calculated by the sum of the square of prediction error which is the actual output minus predicted output and then divide by the number of data points.
RMSE is the square root of MSE. Since the MSE value can be too big to compare easily, RMSE is easier to interpret.
Formula:
Advantage
Gives a better understanding while comparing performance between different regression models.
Mean Absolute Error(MAE)
Definition
Mean Absolute Error(MAE) is similar to Mean Square Error(MSE). However, instead of the sum of the square of error in MSE, MAE is taking the sum of the absolute value of error.
Formula
Advantage
- Does not penalize big prediction errors.
- Easy to implement.
Turn Learning into Career Growth
Accuracy
Definition:
The ratio of the total no. of correctly classified points to the total no. of points in the test dataset is called test accuracy.
Example
Think of it like this, there are 10 questions on a test and if you did 8 of them correctly, then your accuracy is 0.8 or 80%.
Advantage
- A simple technique: easy to understand and implement.
Disadvantage
-
Imbalanced Dataset: Let's say there is a test dataset, with 96 positive points and 4 negative points. Then even if the classifying model is dumb enough to predict all points positively, it will have 96% accuracy, which is not justifiable. Therefore we should never use accuracy as a measure when we have an imbalanced dataset. We use precision and recall to overcome this drawback.
-
Only suitable for classification algorithms.
Some terms to know
a) True Positive Rate (TPR) = TP/P: Correctly classified positive points.
b) True Negative Rate (TNR) = TN/N: Correctly classified negative points.
c) False Positive Rate (FPR) = FP/N: Incorrectly classified positive points
d) False Negative Rate (FNR) = FN/P: Incorrectly classified negative points.
The above terms help us to build the confusion matrix
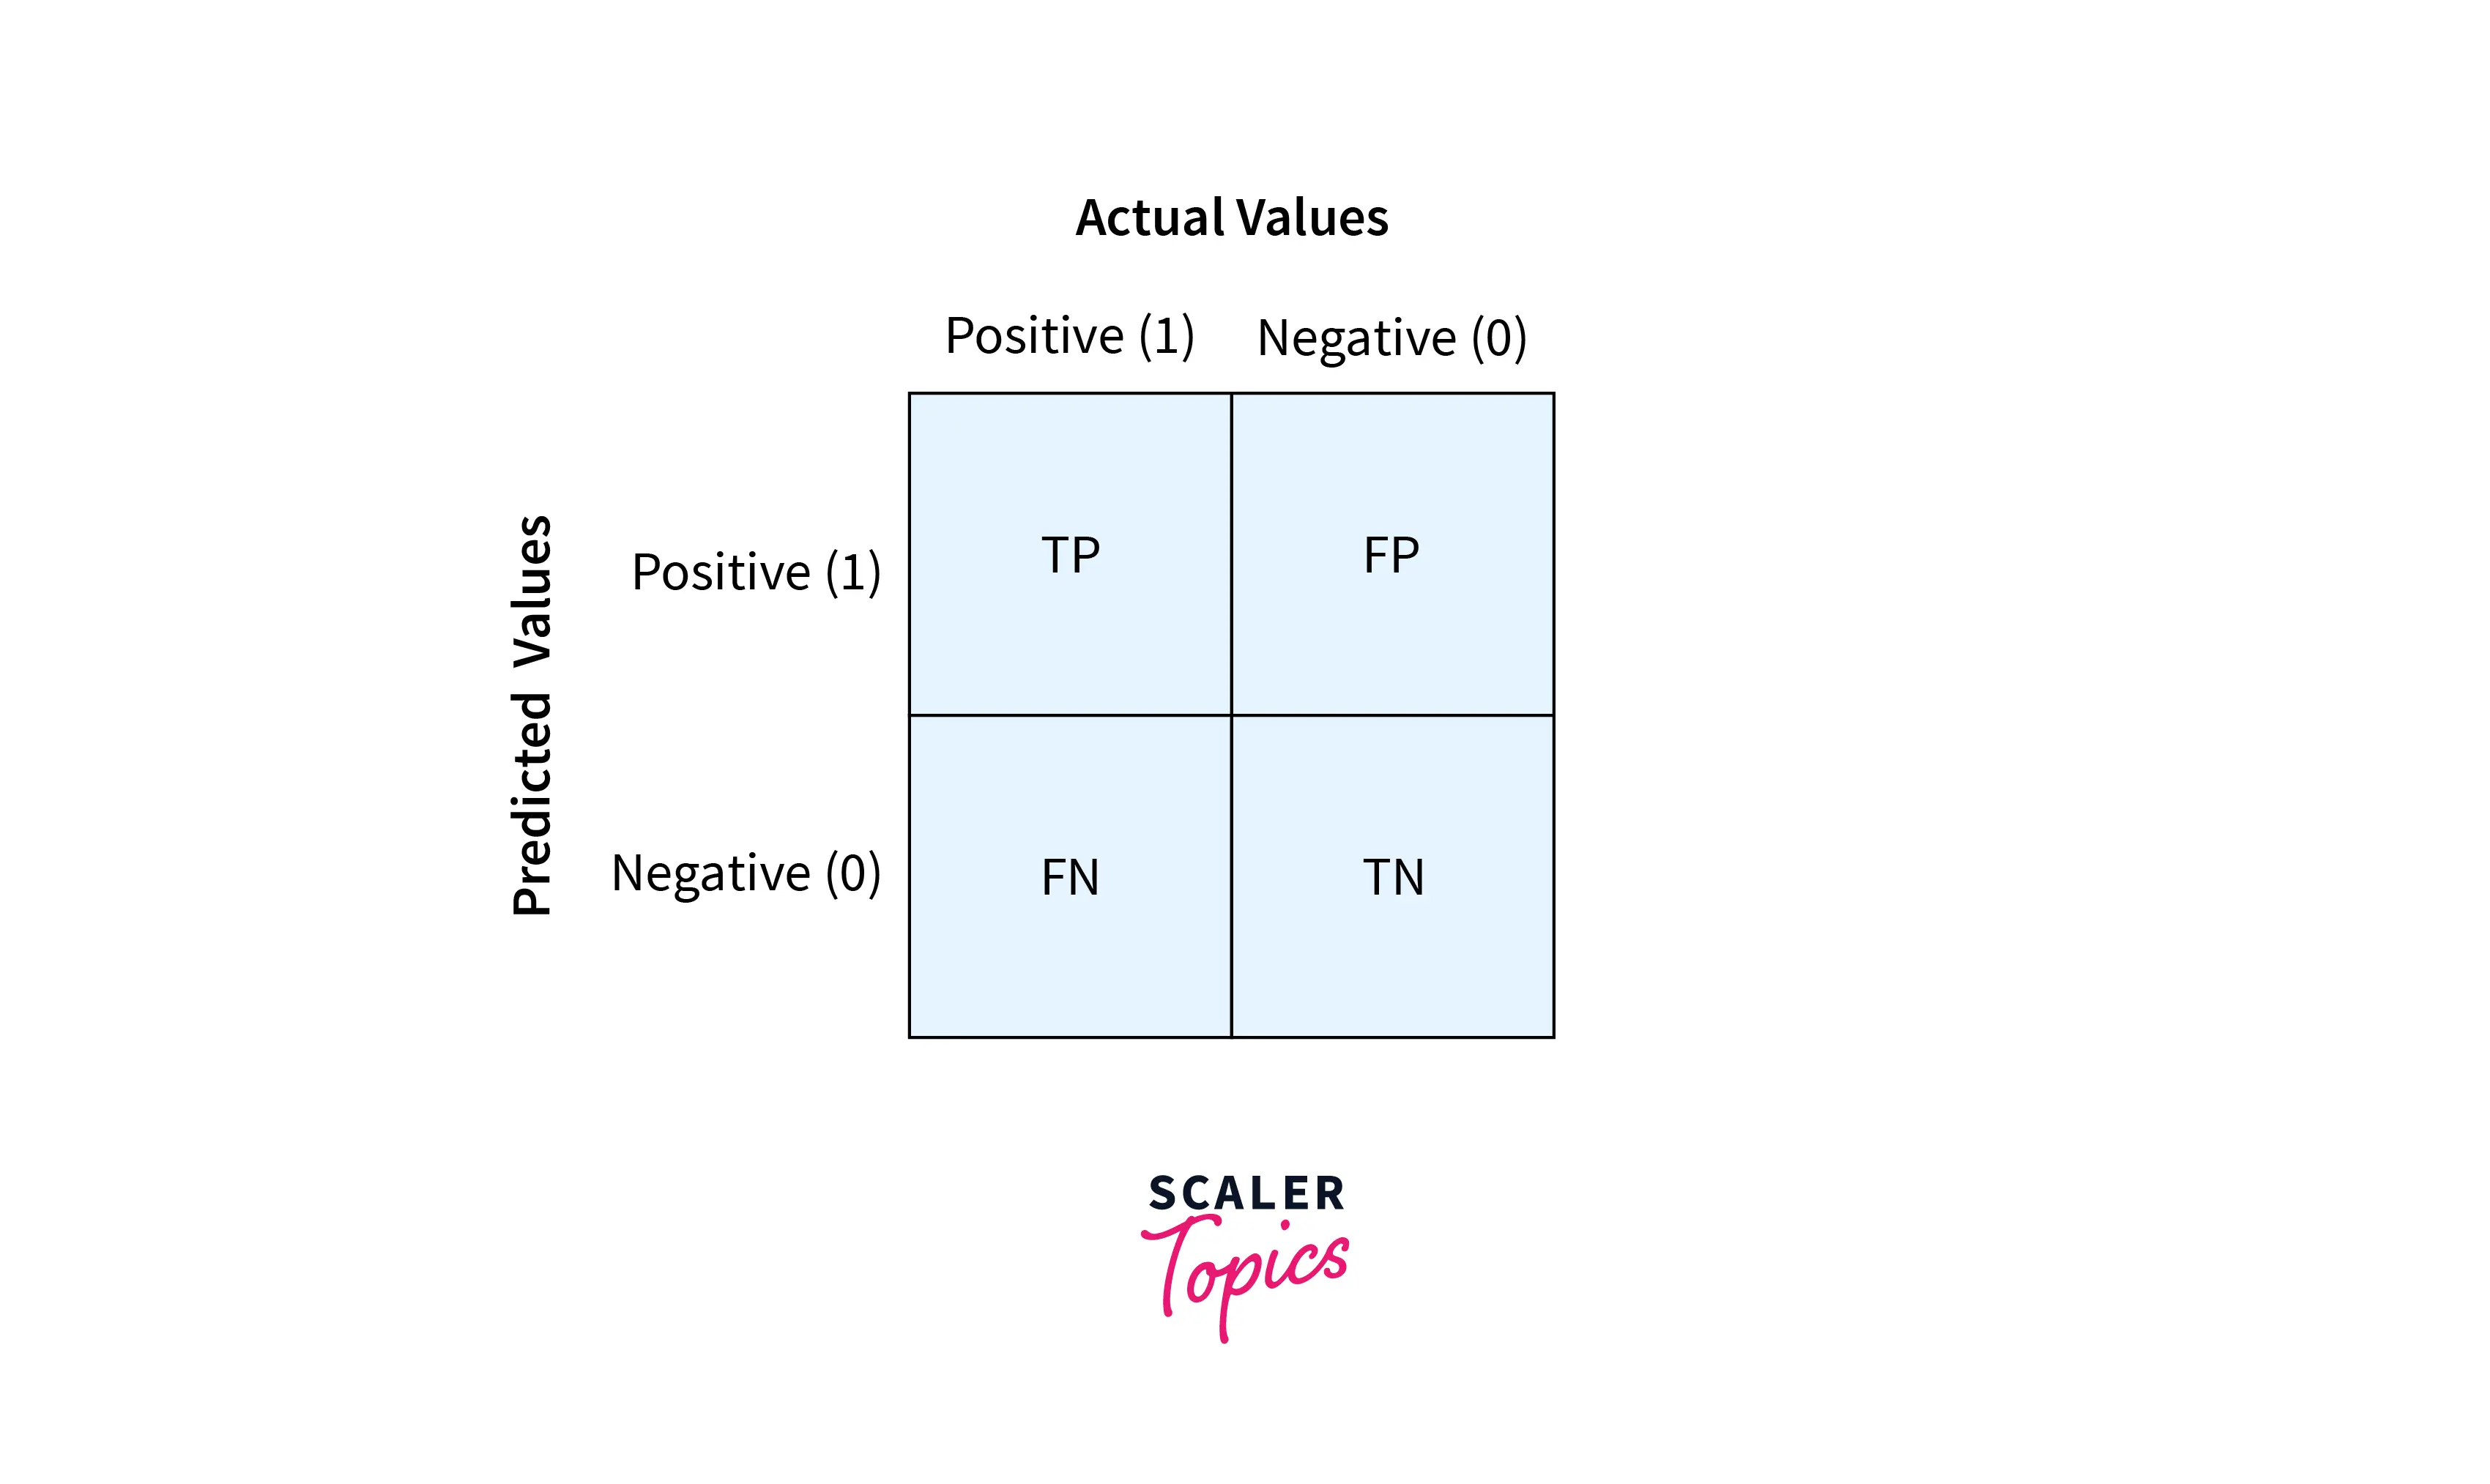
The above matrix gives us a clear idea of how our model is performing and helps us to calculate the precision and recall accurately.
Precision
Definition
Precision or Positive Prediction Value means out of all the points the model predicted to be positive, what percentage of them are positive?
A good model has a high precision which lies between 0 and 1.
Example
There is a cancer dataset that has 60 positive patients and 40 negative patients. The classifier model predicts that 70 patients have cancer, the precision is out of the patients that our model says have cancer, how many have cancer. So here the precision will be 60/70 or 0.85.
Recall
Definition
Out of all the points that belong to a positive class, what percentage of the model detected to be a positive class?
A good model has a high recall which lies between 0 and 1.
Example
Continuing the cancer detection problem from precision, the recall states that out of the total patients who have cancer, how many patients my model detects has cancer?
Drawbacks of Precision and Recall
- Recall depends on true positives and false negatives and precision depends on true positives and false positives.
- Thus, using this pair of performance measures, true negatives are never taken into account.
- Thus, precision and recall should only be used in situations, where the correct identification of the negative class does not play a role.
- Measuring recall is difficult because it is often difficult to know how many relevant records exist in a database.
Conclusion
The key takeaways from this article are:-
- Performance metrics help us to track the progress of the model and put a number on it.
- Accuracy does not work well with imbalanced datasets.
- Precision and recall are intertwined and overcome the drawbacks of accuracy.
- Precision and recall do not take false negatives.