Stationary data and Autocorrelation
Overview
We've been collecting data for years, and it's susceptible to change as time goes on. Therefore, researchers must pay attention to historical trends to develop accurate forecasts for future occurrences. Time is the independent variable in a time series.
This article will assist you in comprehending some fundamental concepts before diving into predictive modeling for forecasting.
Pre-requisites
- A basic understanding of Time series data and analysis is required.
- Knowledge about seasonality and trends in time series is a plus.
Introduction
The correlation between two values in a time series is known as autocorrelation. In other words, the time series data are correlated with one another. Stationarity denotes the absence of a trend, a constant variance, a constant autocorrelation pattern, and no seasonal variation in a time series. Let us examine how stationarity and autocorrelation play a key role in time series forecasting.
Transform Your Career
Choose from our industry-leading programs designed for career success
Modern Software and AI Engineering Program
Master full-stack development with AI integration

Modern Data Science and ML with specialisation in AI
Advanced data science techniques with AI specialization
Advanced AIML with Specialisation in Agentic AI
Deep dive into AIML with focus on Agentic systems
DevOps, Cloud & AI Platform Engineering
Build and manage AI-powered cloud infrastructure
AI Engineering Advanced Certification by IIT-Roorkee
Premier AI engineering certification from IIT-Roorkee
What is Autocorrelation?
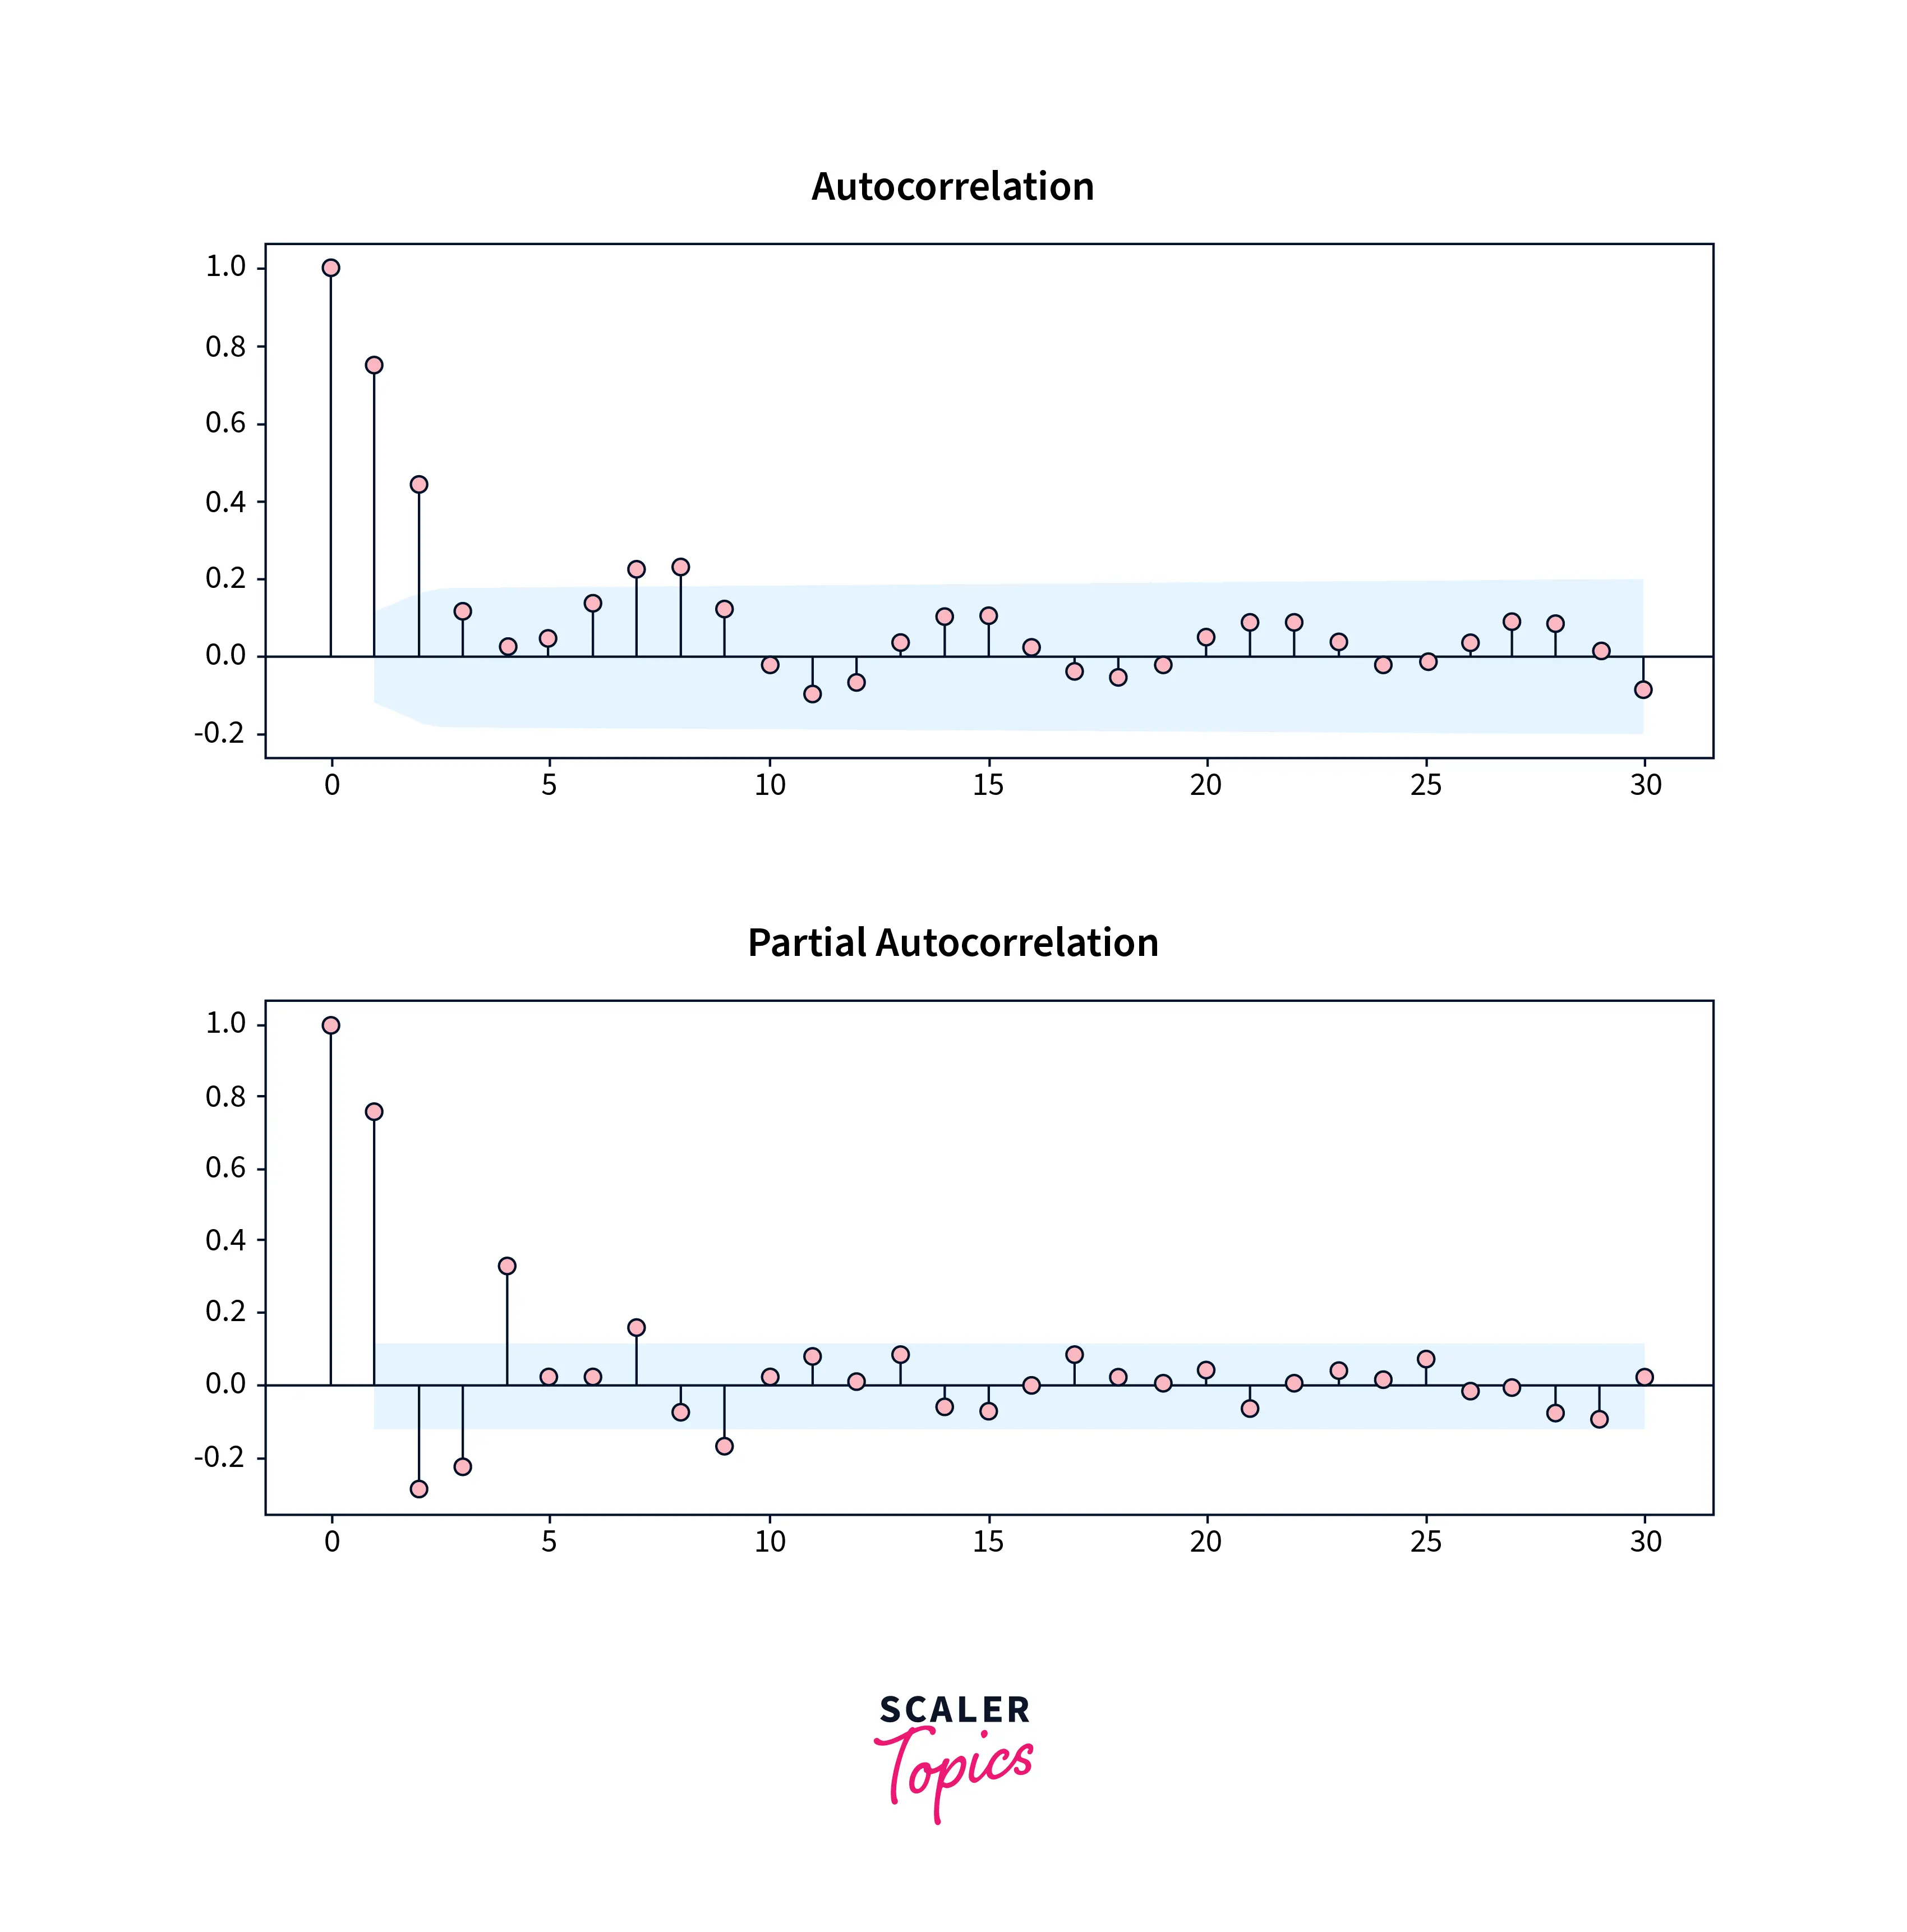
The degree of similarity between a particular time series and its lagged version over subsequent time intervals is represented mathematically as autocorrelation. In other words, rather than calculating the correlation between two independent series, we compute the correlation between the series and an "x" unit-lagged version of itself.
Analysts collect time-series data by measuring a characteristic at regular intervals, such as daily, monthly, or yearly. The lag is the number of gaps between two observations. For example, the lag between the present and previous observations is one. If you go back one more period, the lag is two.
Lagged correlation or serial correlation are other terms for autocorrelation. The autocorrelation coefficient ranges between +1 and -1.
Partial Autocorrelation
Partial autocorrelation is similar to autocorrelation. However, it only shows the association between two data that the shorter lags between those observations need to explain. The partial autocorrelation for lag 3 is, for example, merely the correlation that lags 1 and 2 do not explain. In other words, the partial correlation for each lag is the striking correlation between that two observations after the intermediate correlations are removed.
The autocorrelation function aids in determining the qualities of a time series. In contrast, the partial autocorrelation function (PACF) is more beneficial during the autoregressive model specification process. Analysts use partial autocorrelation plots to specify regression models with time series data and Auto-Regressive Integrated Moving Average (ARIMA) models.
Scaler Placement Report and Statistics
Scaler learners achieved 2.5x salary growth with average post-Scaler CTC reaching ₹23L.
What is Stationarity?
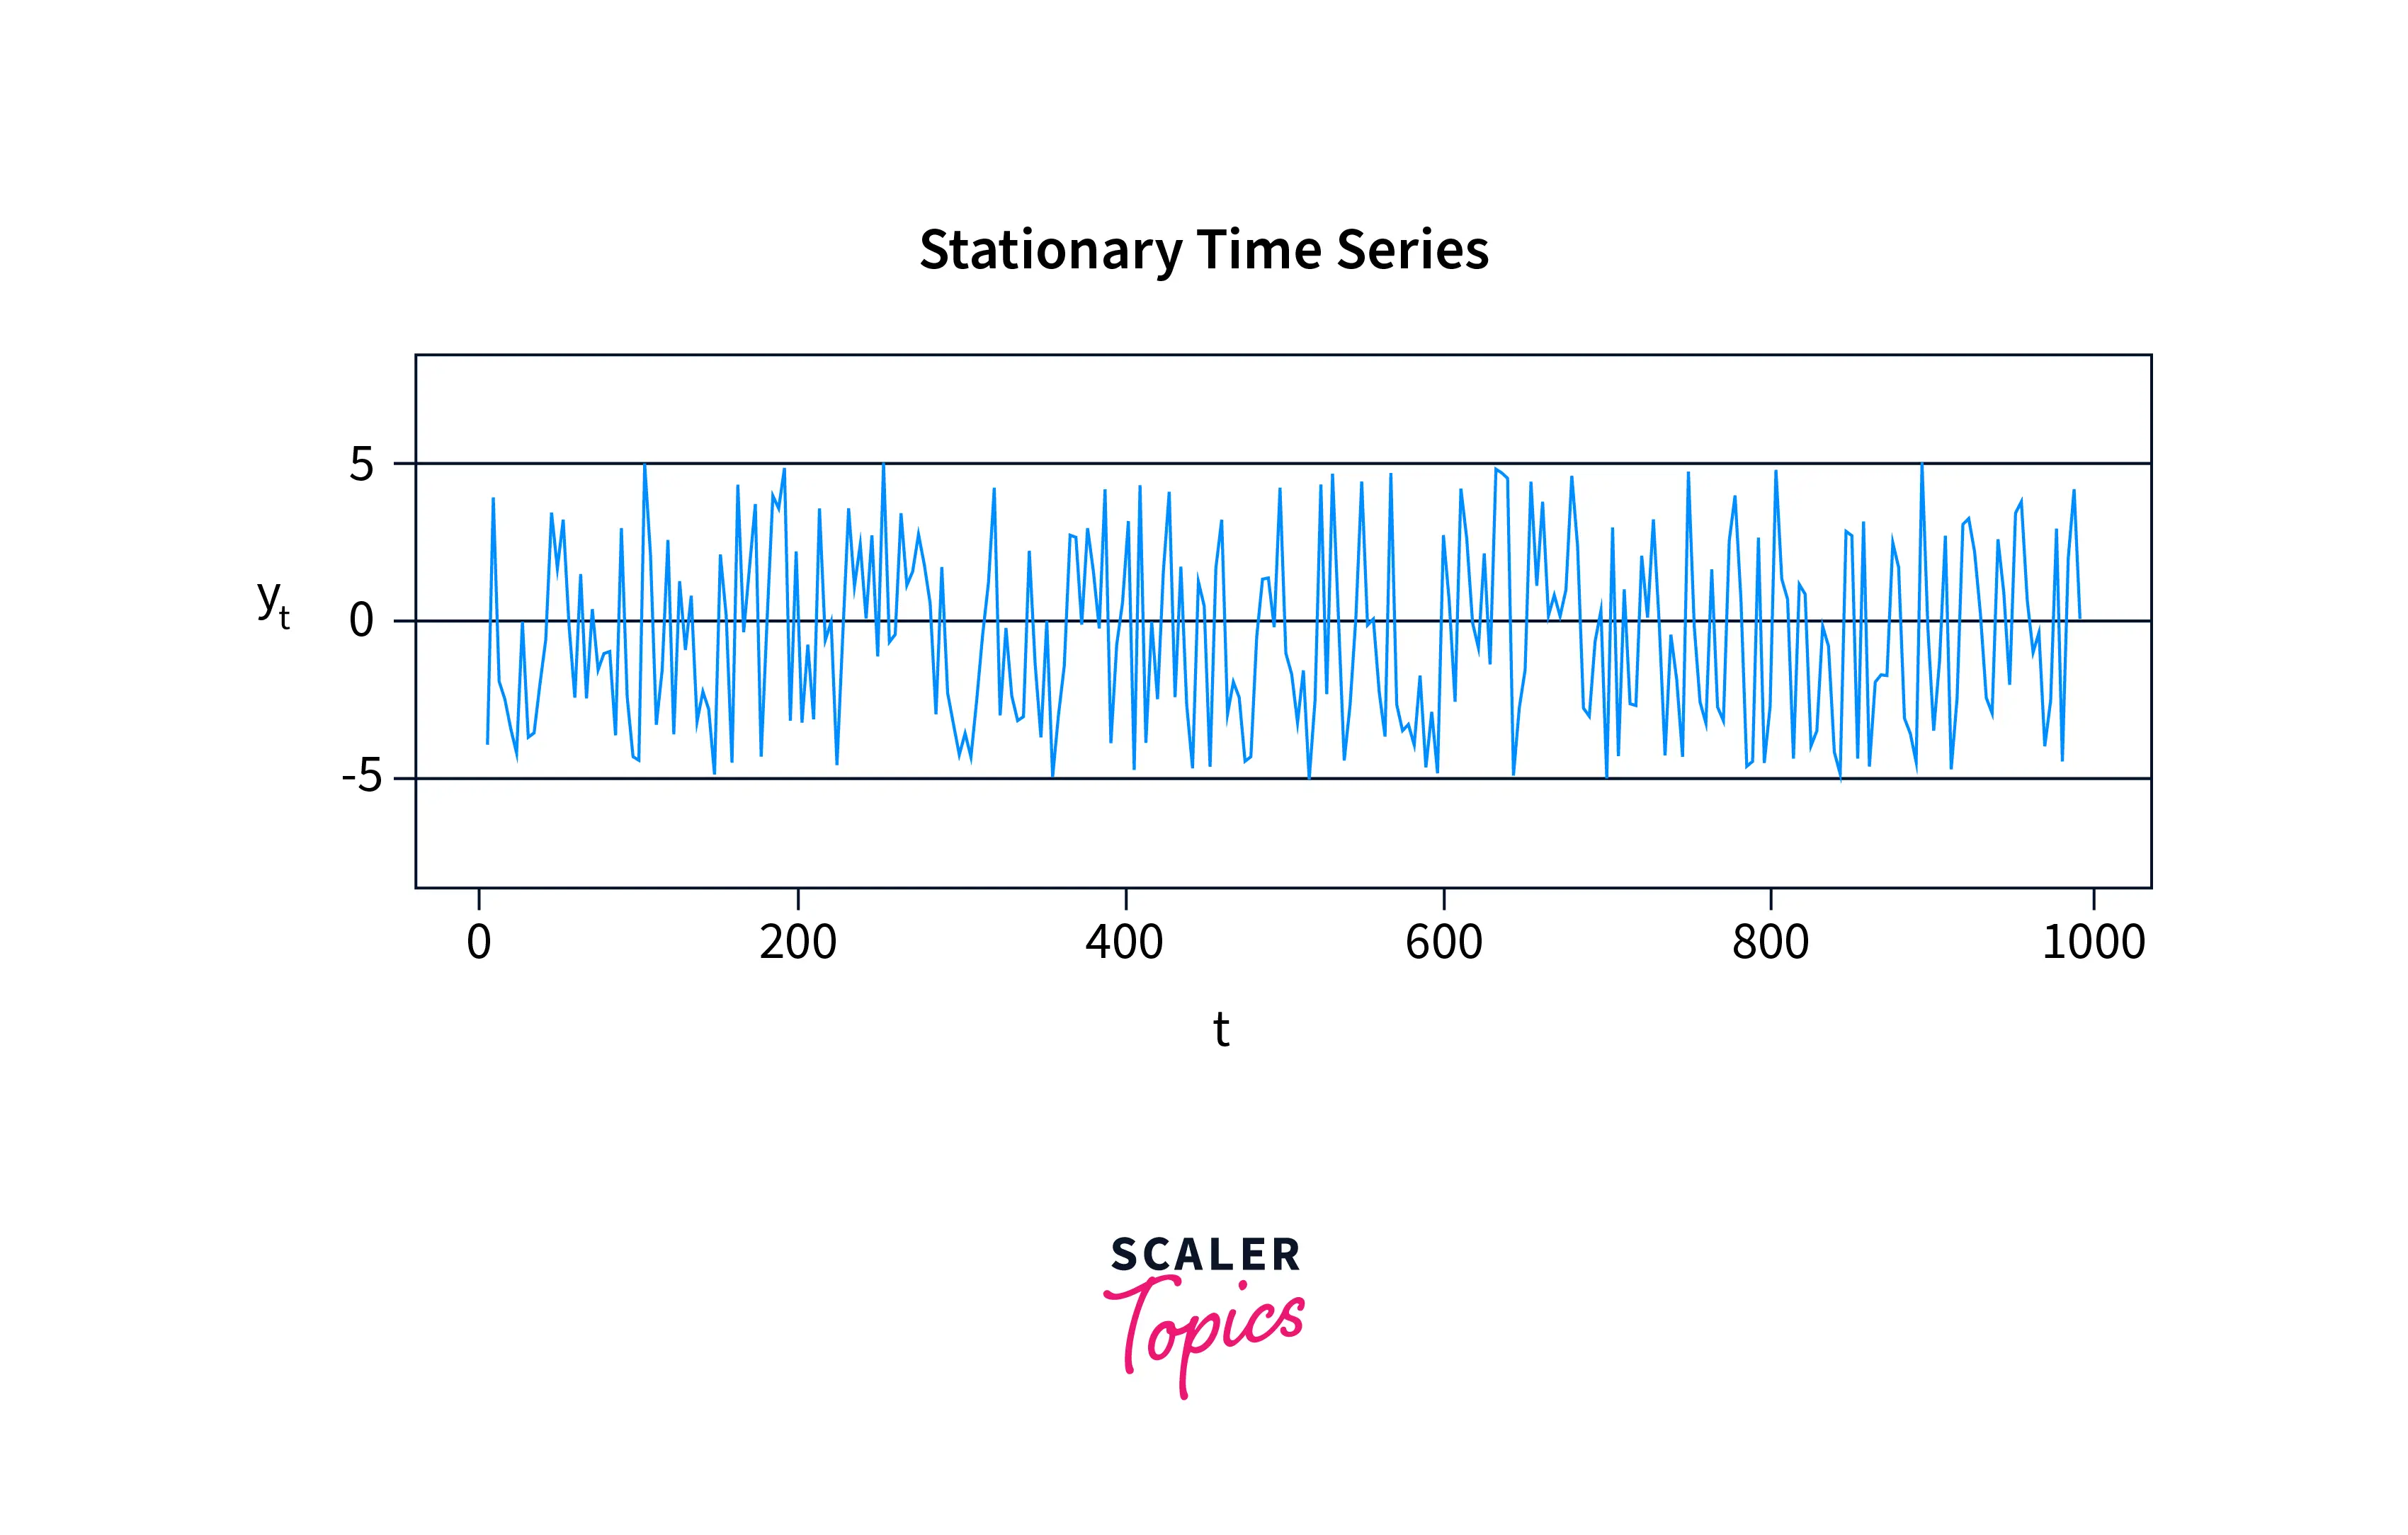
This is one of the most crucial features of time series data. A time series is considered stationary in machine learning if its mean, variance, and covariance are constant. We would like stationary data in machine learning in a perfect world, but that may be different.
Stationary Time Series and Non-Stationary Time Series
Stationary data in machine learning has statistical features independent of the time it is observed. The variance of a stationary time series is constant, and it always returns to the long-run mean.
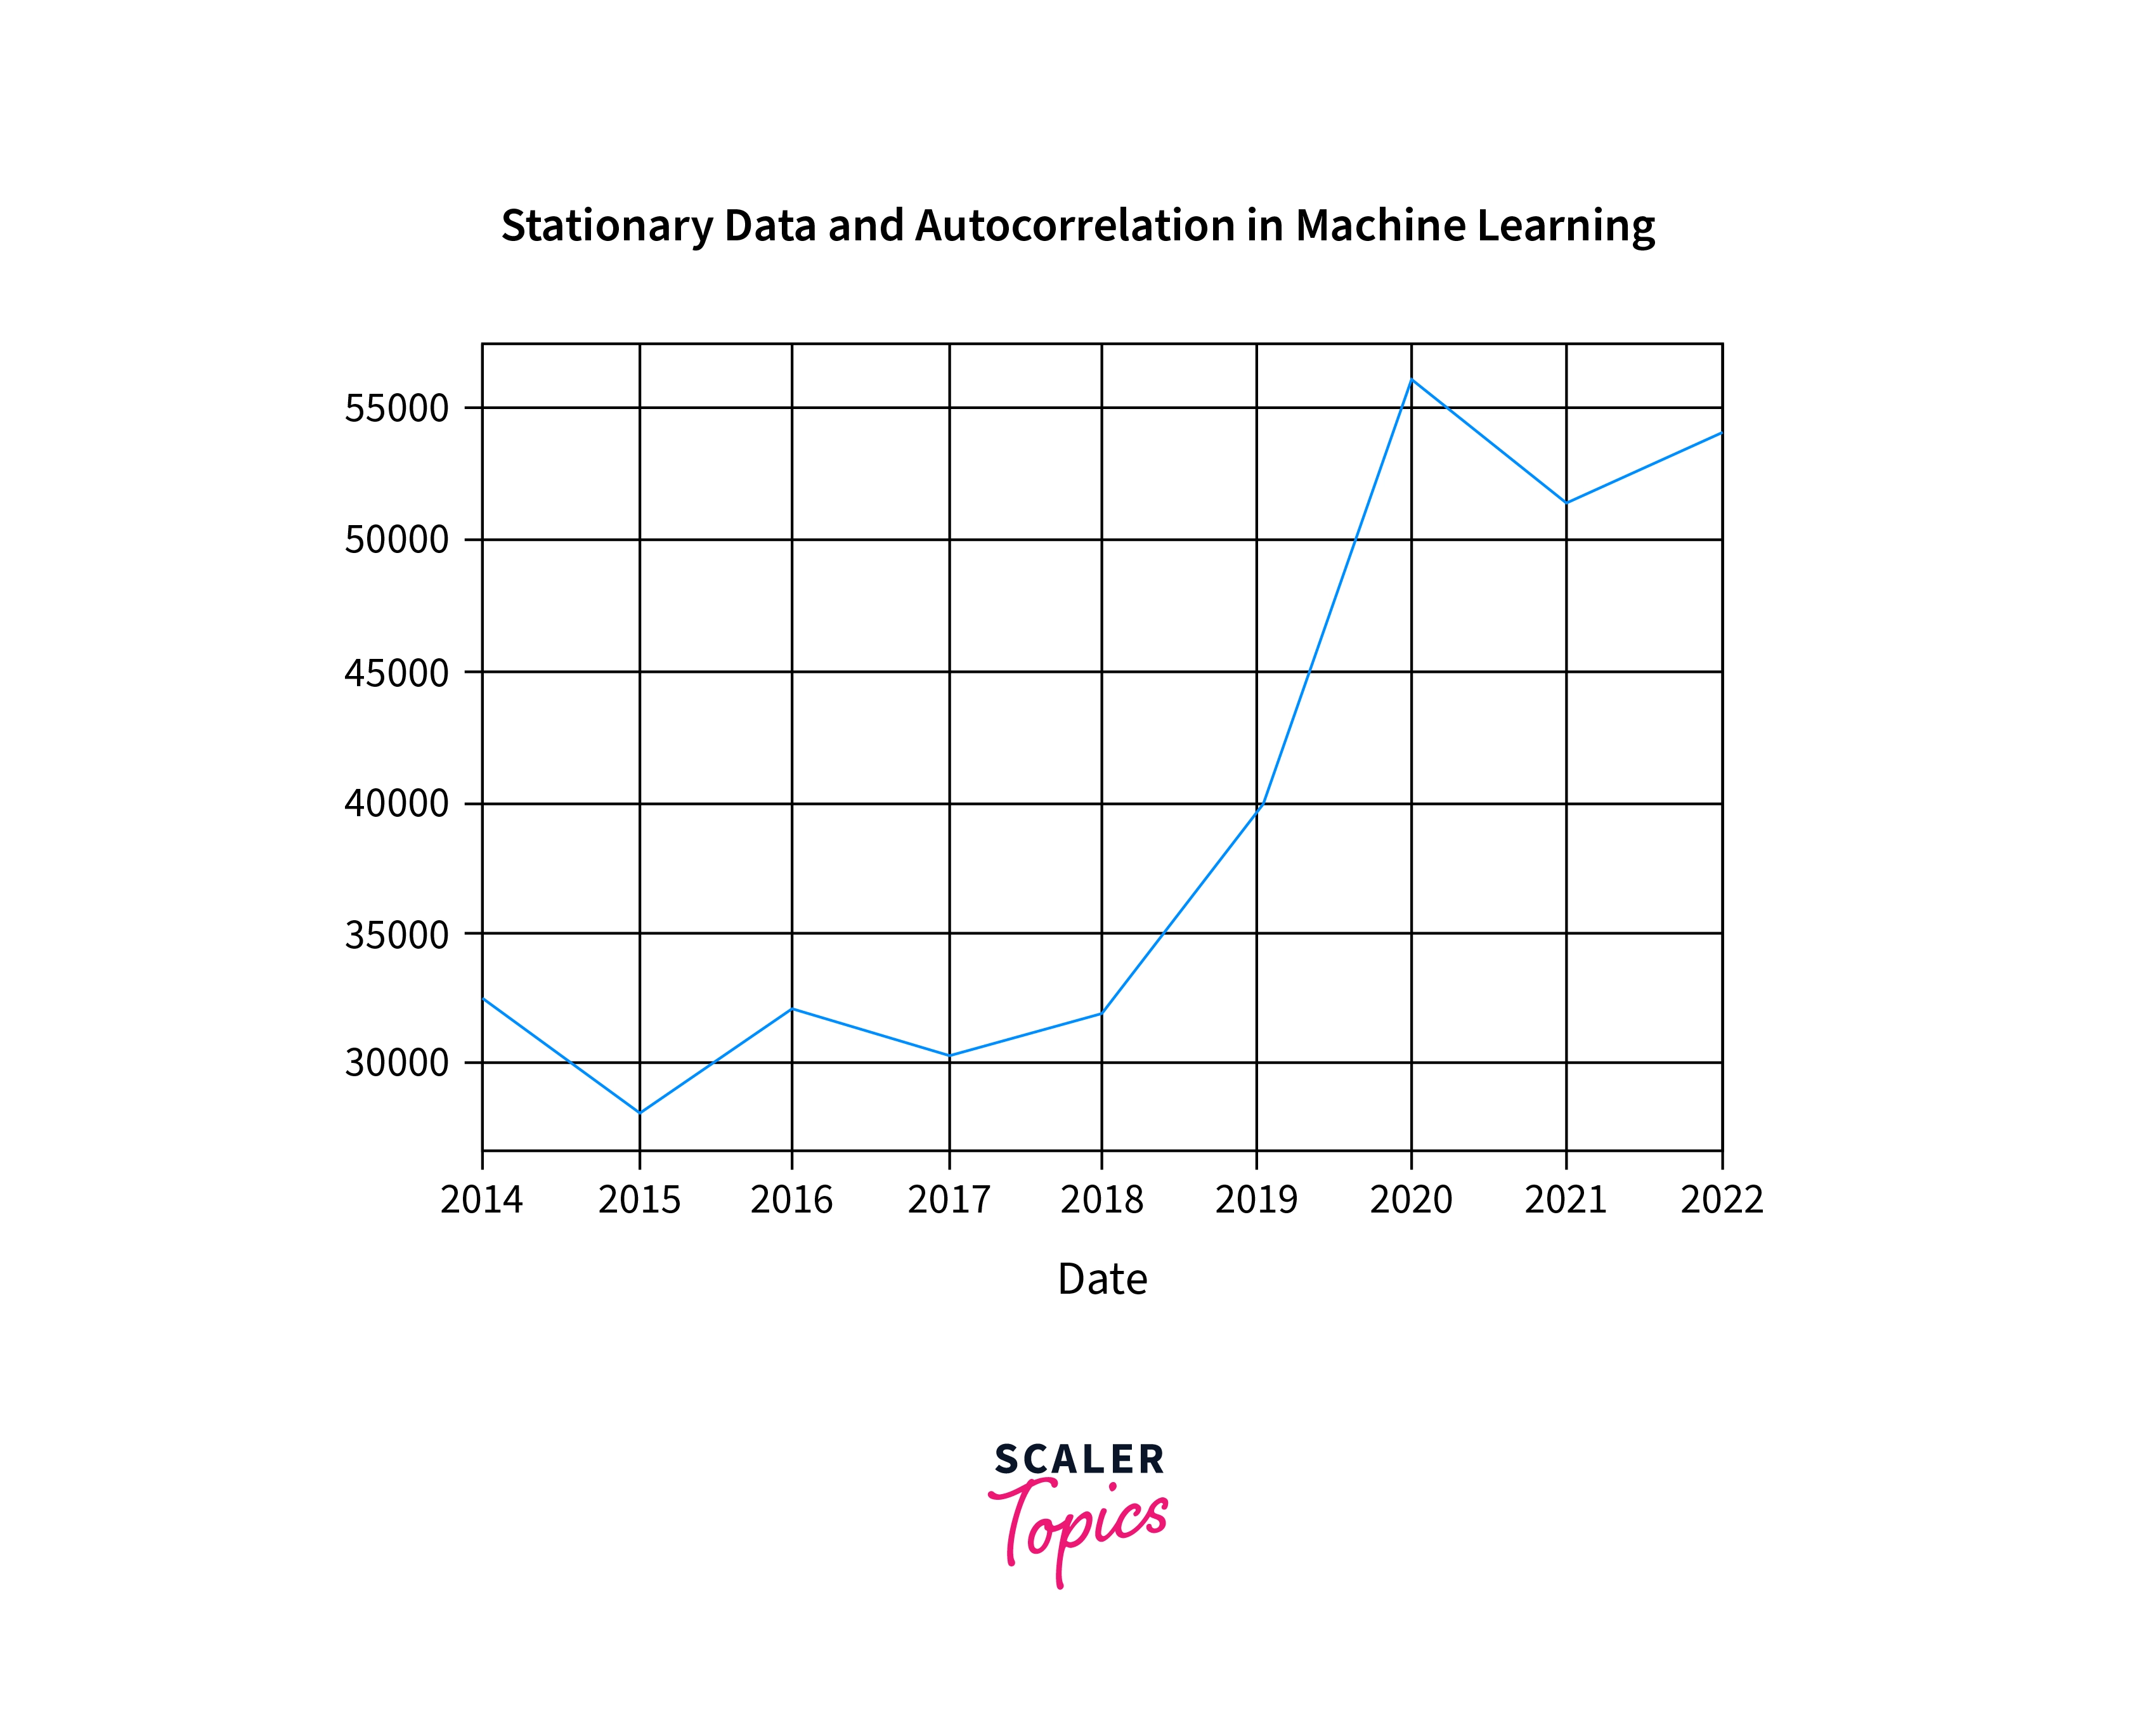
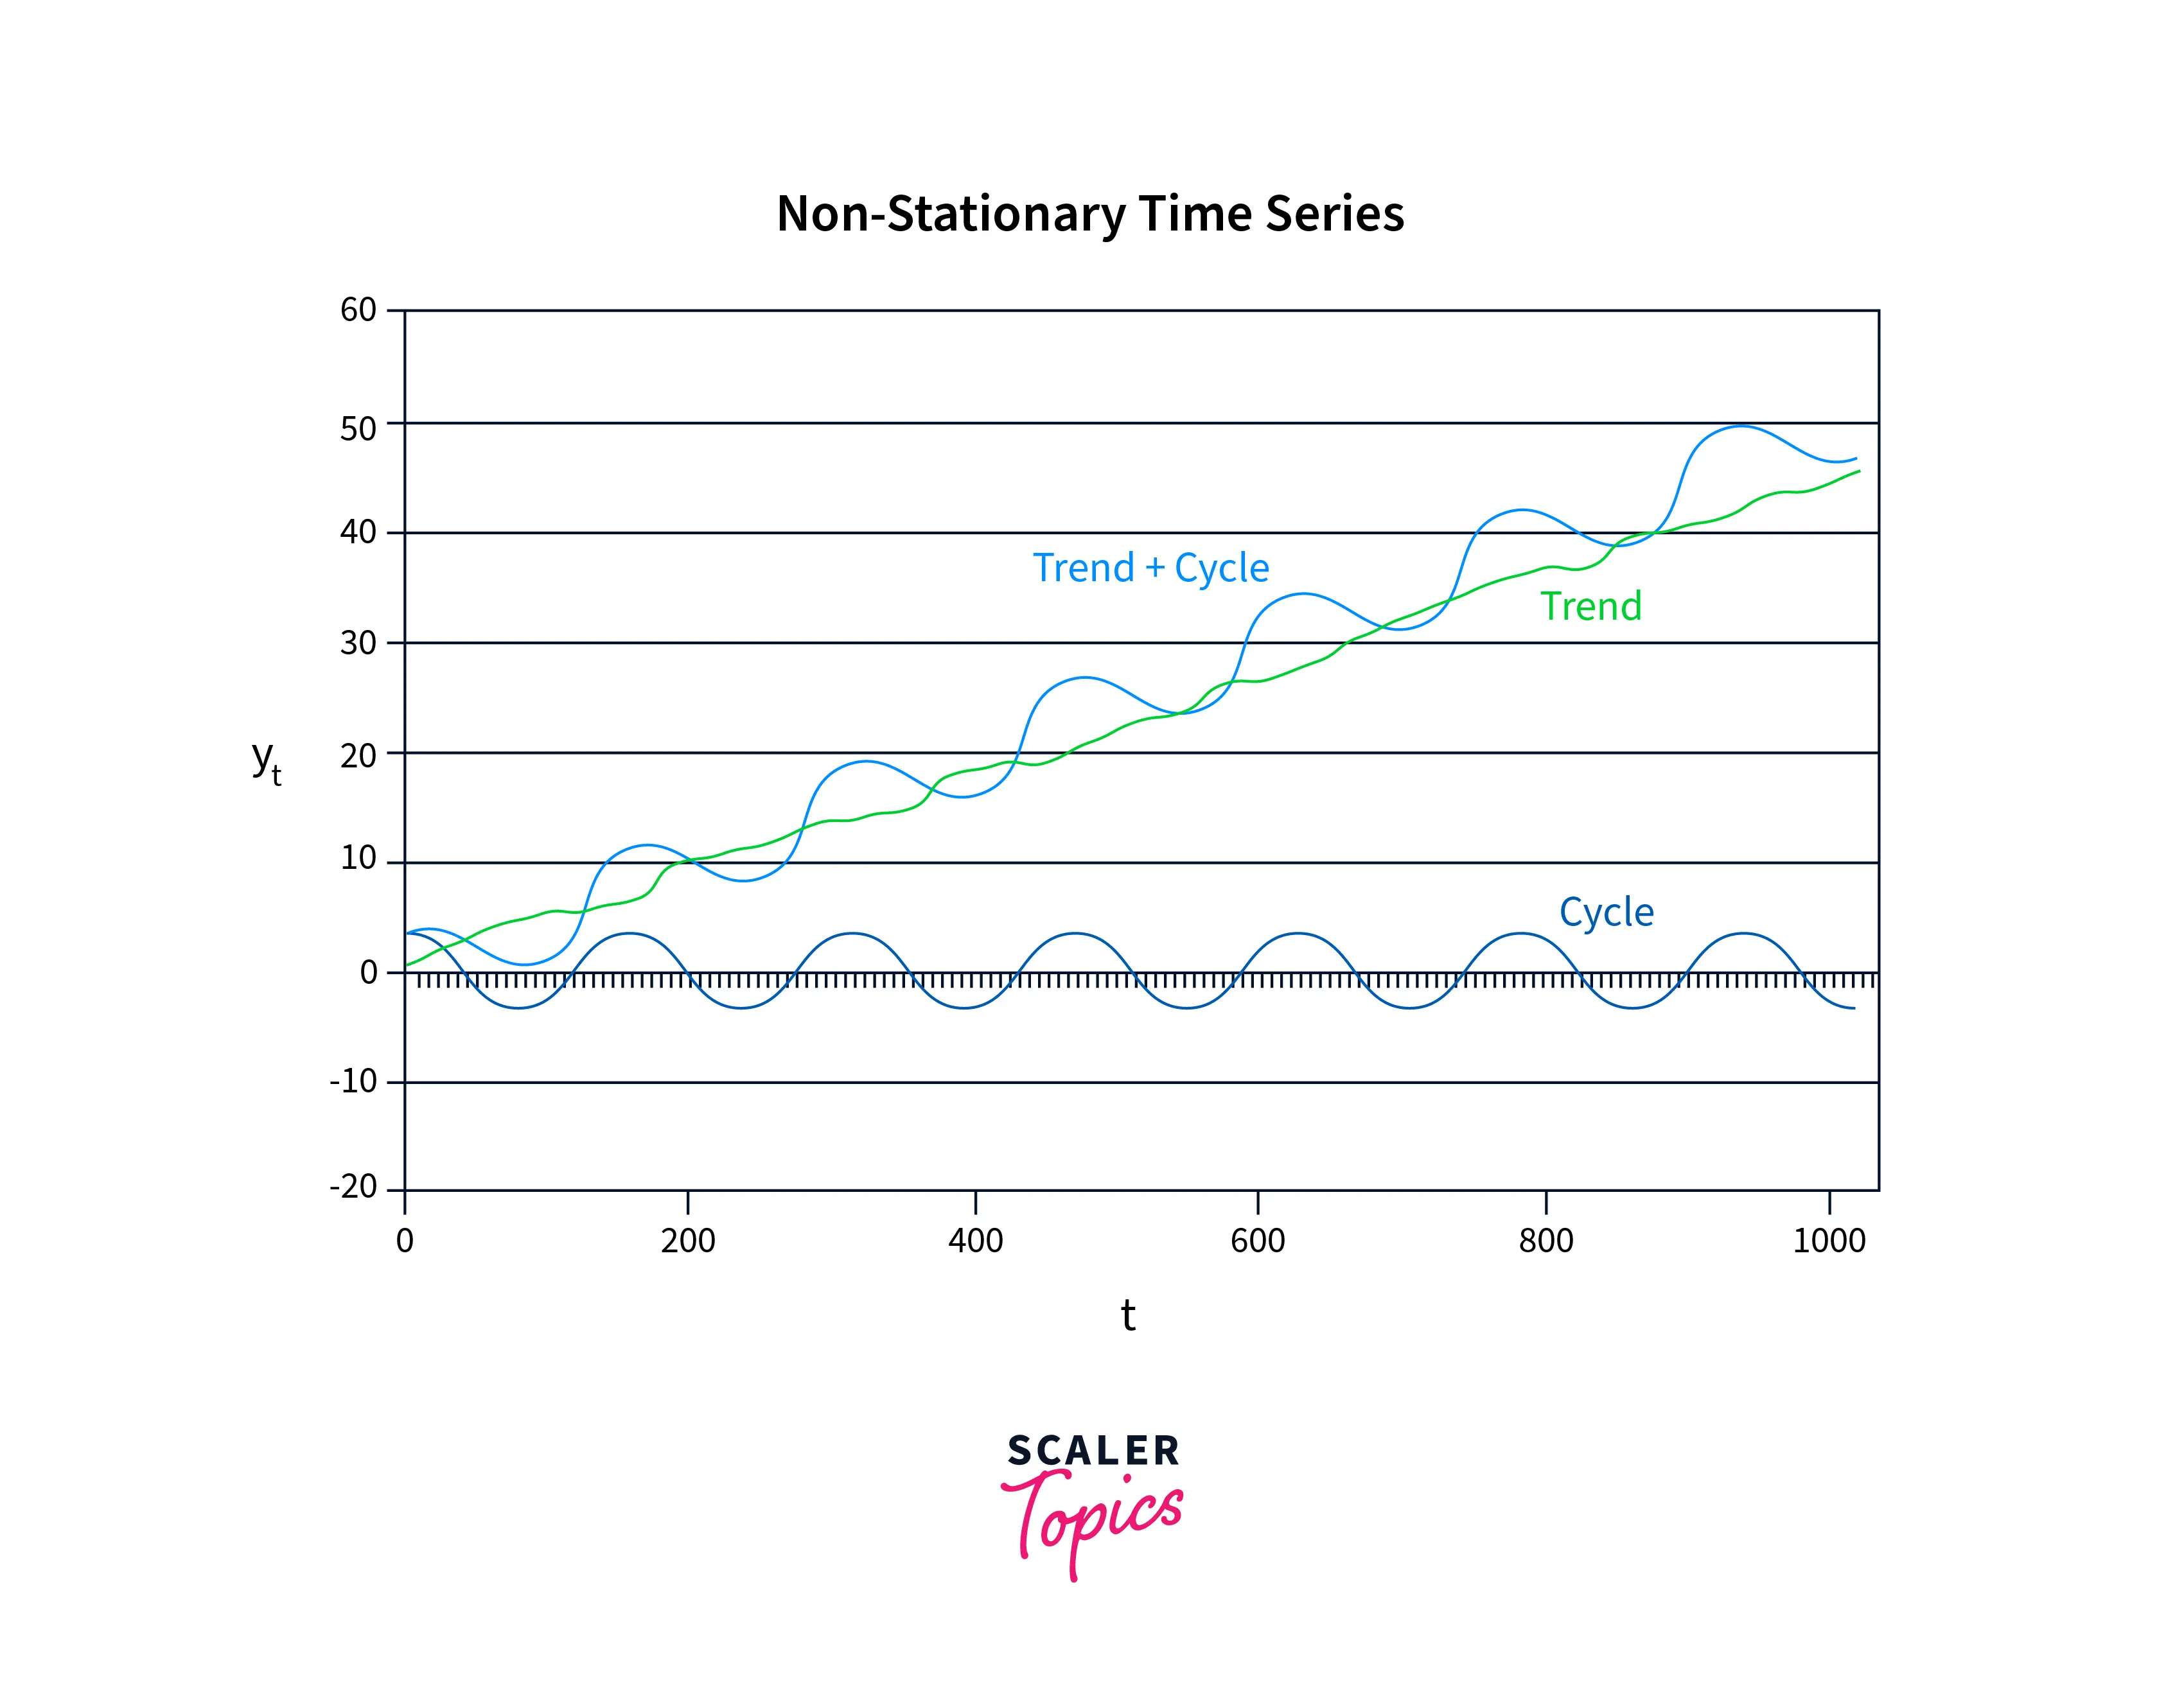
A non-stationary time series is one whose statistical properties alter over time. For example, a time series containing a trend or seasonality is thus non-stationary. This is because trend or seasonality will change the mean, variance, and other features at any particular moment.
Let us summarize the distinctions between non-stationary and stationary data in machine learning.
| Stationary Time Series | Non-Stationary Time Series |
|---|---|
| A stationary time series' statistical features are independent of the moment it is observed. | The statistical features of a non-stationary time series depend on the time it is observed. |
| A stationary time series' mean, variance and other characteristics stay constant. As a result, the study's stationary series findings are trustworthy. | A non-stationary time series' mean, variance and other statistics fluctuate with time. As a result, the results drawn from a study of a non-stationary series may need to be corrected. |
| A stationary time series always reach the long-term mean. | A non-stationary time series does not return to the long-term mean. |
| Stationary data in machine learning lacks trends, seasonality, and other characteristics. | The presence of trends and seasonality causes a series to be non-stationary. |
Turn Learning into Career Growth
Types of Stationarity
There are several forms of stationary data in machine learning, which are as follows:
- Stationary process: A process that creates a stationary series of observations.
- Stationary model: A model that explains a stationary series of observations.
- Trend stationary: A time series does not show a trend.
- Seasonal stationery: A time series does not depict seasonality.
- Strictly stationary: A strictly stationary process is invariant to time shift.
Scaler Placement Report and Statistics
Scaler learners achieved 2.5x salary growth with average post-Scaler CTC reaching ₹23L.
Why is Stationarity Important?
What happens when a process is not stationary?
Inferences made from a non-stationary process, on the other hand, will be unreliable since their statistical features will change with time. Therefore, when undertaking analysis, you are usually concerned with the anticipated value of the mean, the variance, and so on.
However, determining these values by averaging across time will be inaccurate if they are constantly changing. As a result, stationary data in machine learning is easier to analyze, and any prognosis based on non-stationary data in machine learning would be incorrect and misleading.
As a result, many statistical approaches in time series analysis assume that the underlying time series data is steady.
This assumption is required because most time series forecasting methods assume that the time series' statistical features will remain unchanged as they did in the past.
Detecting Stationarity
Visualizations
The fundamental approach for detecting stationarity focuses on charting data or functions. First, we visualize and judge whether they exhibit some recognized attribute of stationary data in machine learning.
Both stationary and non-stationary series exhibit characteristics immediately discernible from the data plot. In a stationary series, for example, the data points would always revert to the long-run mean with a constant variance. On the other hand, the data points in a non-stationary series may exhibit some pattern or seasonality.
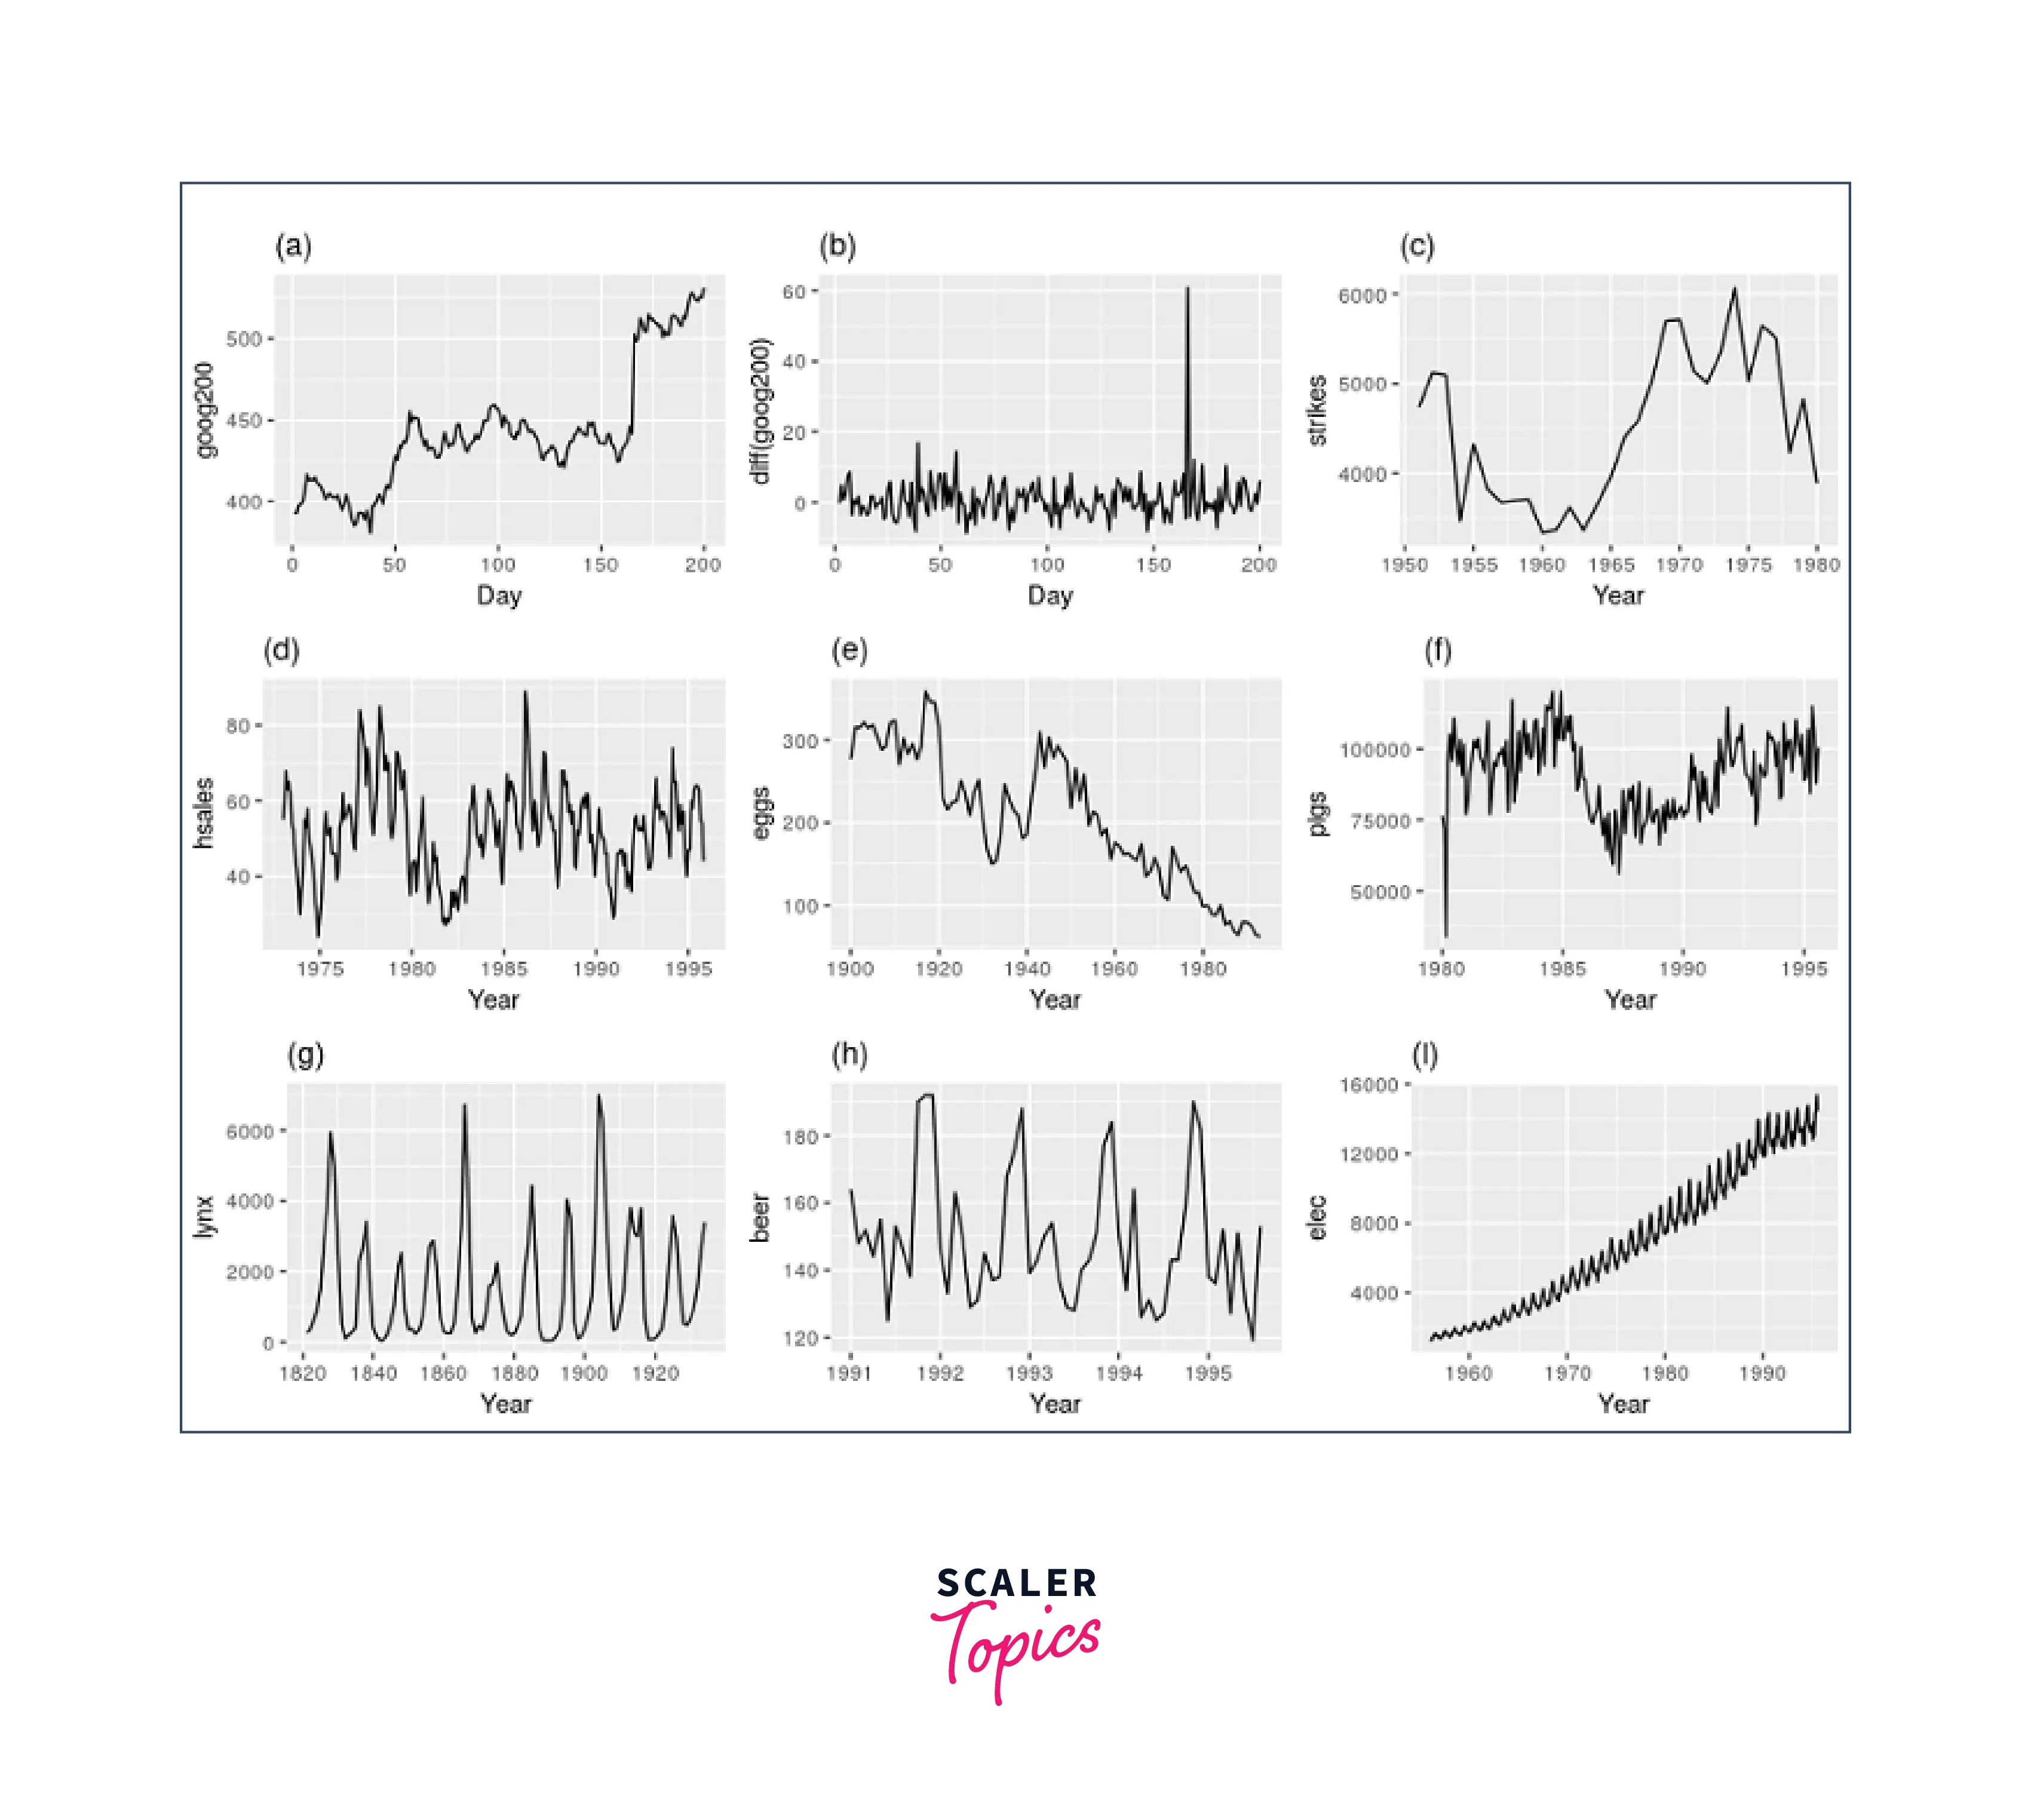
- Series d, h, and i show prominent seasonality.
- Series i has an increasing variance.
- The only stationary series appear to be b and g.
This strategy is just used to gain a basic understanding of the data and could be more dependable.
Summary Statistics
stationary data in machine learning has a constant mean, variance, and so on across time. Summary statistics such as mean and variance may thus be used to determine whether a time series is stationary.
You may divide the data into random periods and see the summary statistics for each time. The series is stationary if the mean and variance of distinct divisions are relatively close.
The series is not stationary if there is a considerable variation between the mean and variance of the different divisions.
Statistical or Parametric Tests
Various parametric and nonparametric techniques are available to determine the series' stationarity. First, let's look at an example of a parametric test.
Augmented Dickey-Fuller Test - One of the most used tests for stationarity is the Augmented Dickey-Fuller test. It puts the following theory to the test.
- H0 is the null hypothesis, which states that the time series is not stationary.
- Alternative Hypothesis, H1, states that the time series is stationary.
You can use the adfuller method from the statsmodels library to perform this test in Python and compare the value of the test statistics or the p-value.
- If the p-value is less than or equal to 0.05, or the absolute value of the test statistics is larger than the critical value, H0 is rejected, and the time series is concluded to be stationary.
- If the p-value is more than 0.05 or the absolute value of the test statistics is less than the crucial value, the time series is not stationary, and you fail to reject H0.
Conclusion
- We have understood auto-correlation and stationary data in machine learning.
- The above methods can be used for detecting stationarity in time series data which form the basis for time series forecasting.