Time Series Data in Machine Learning
Overview
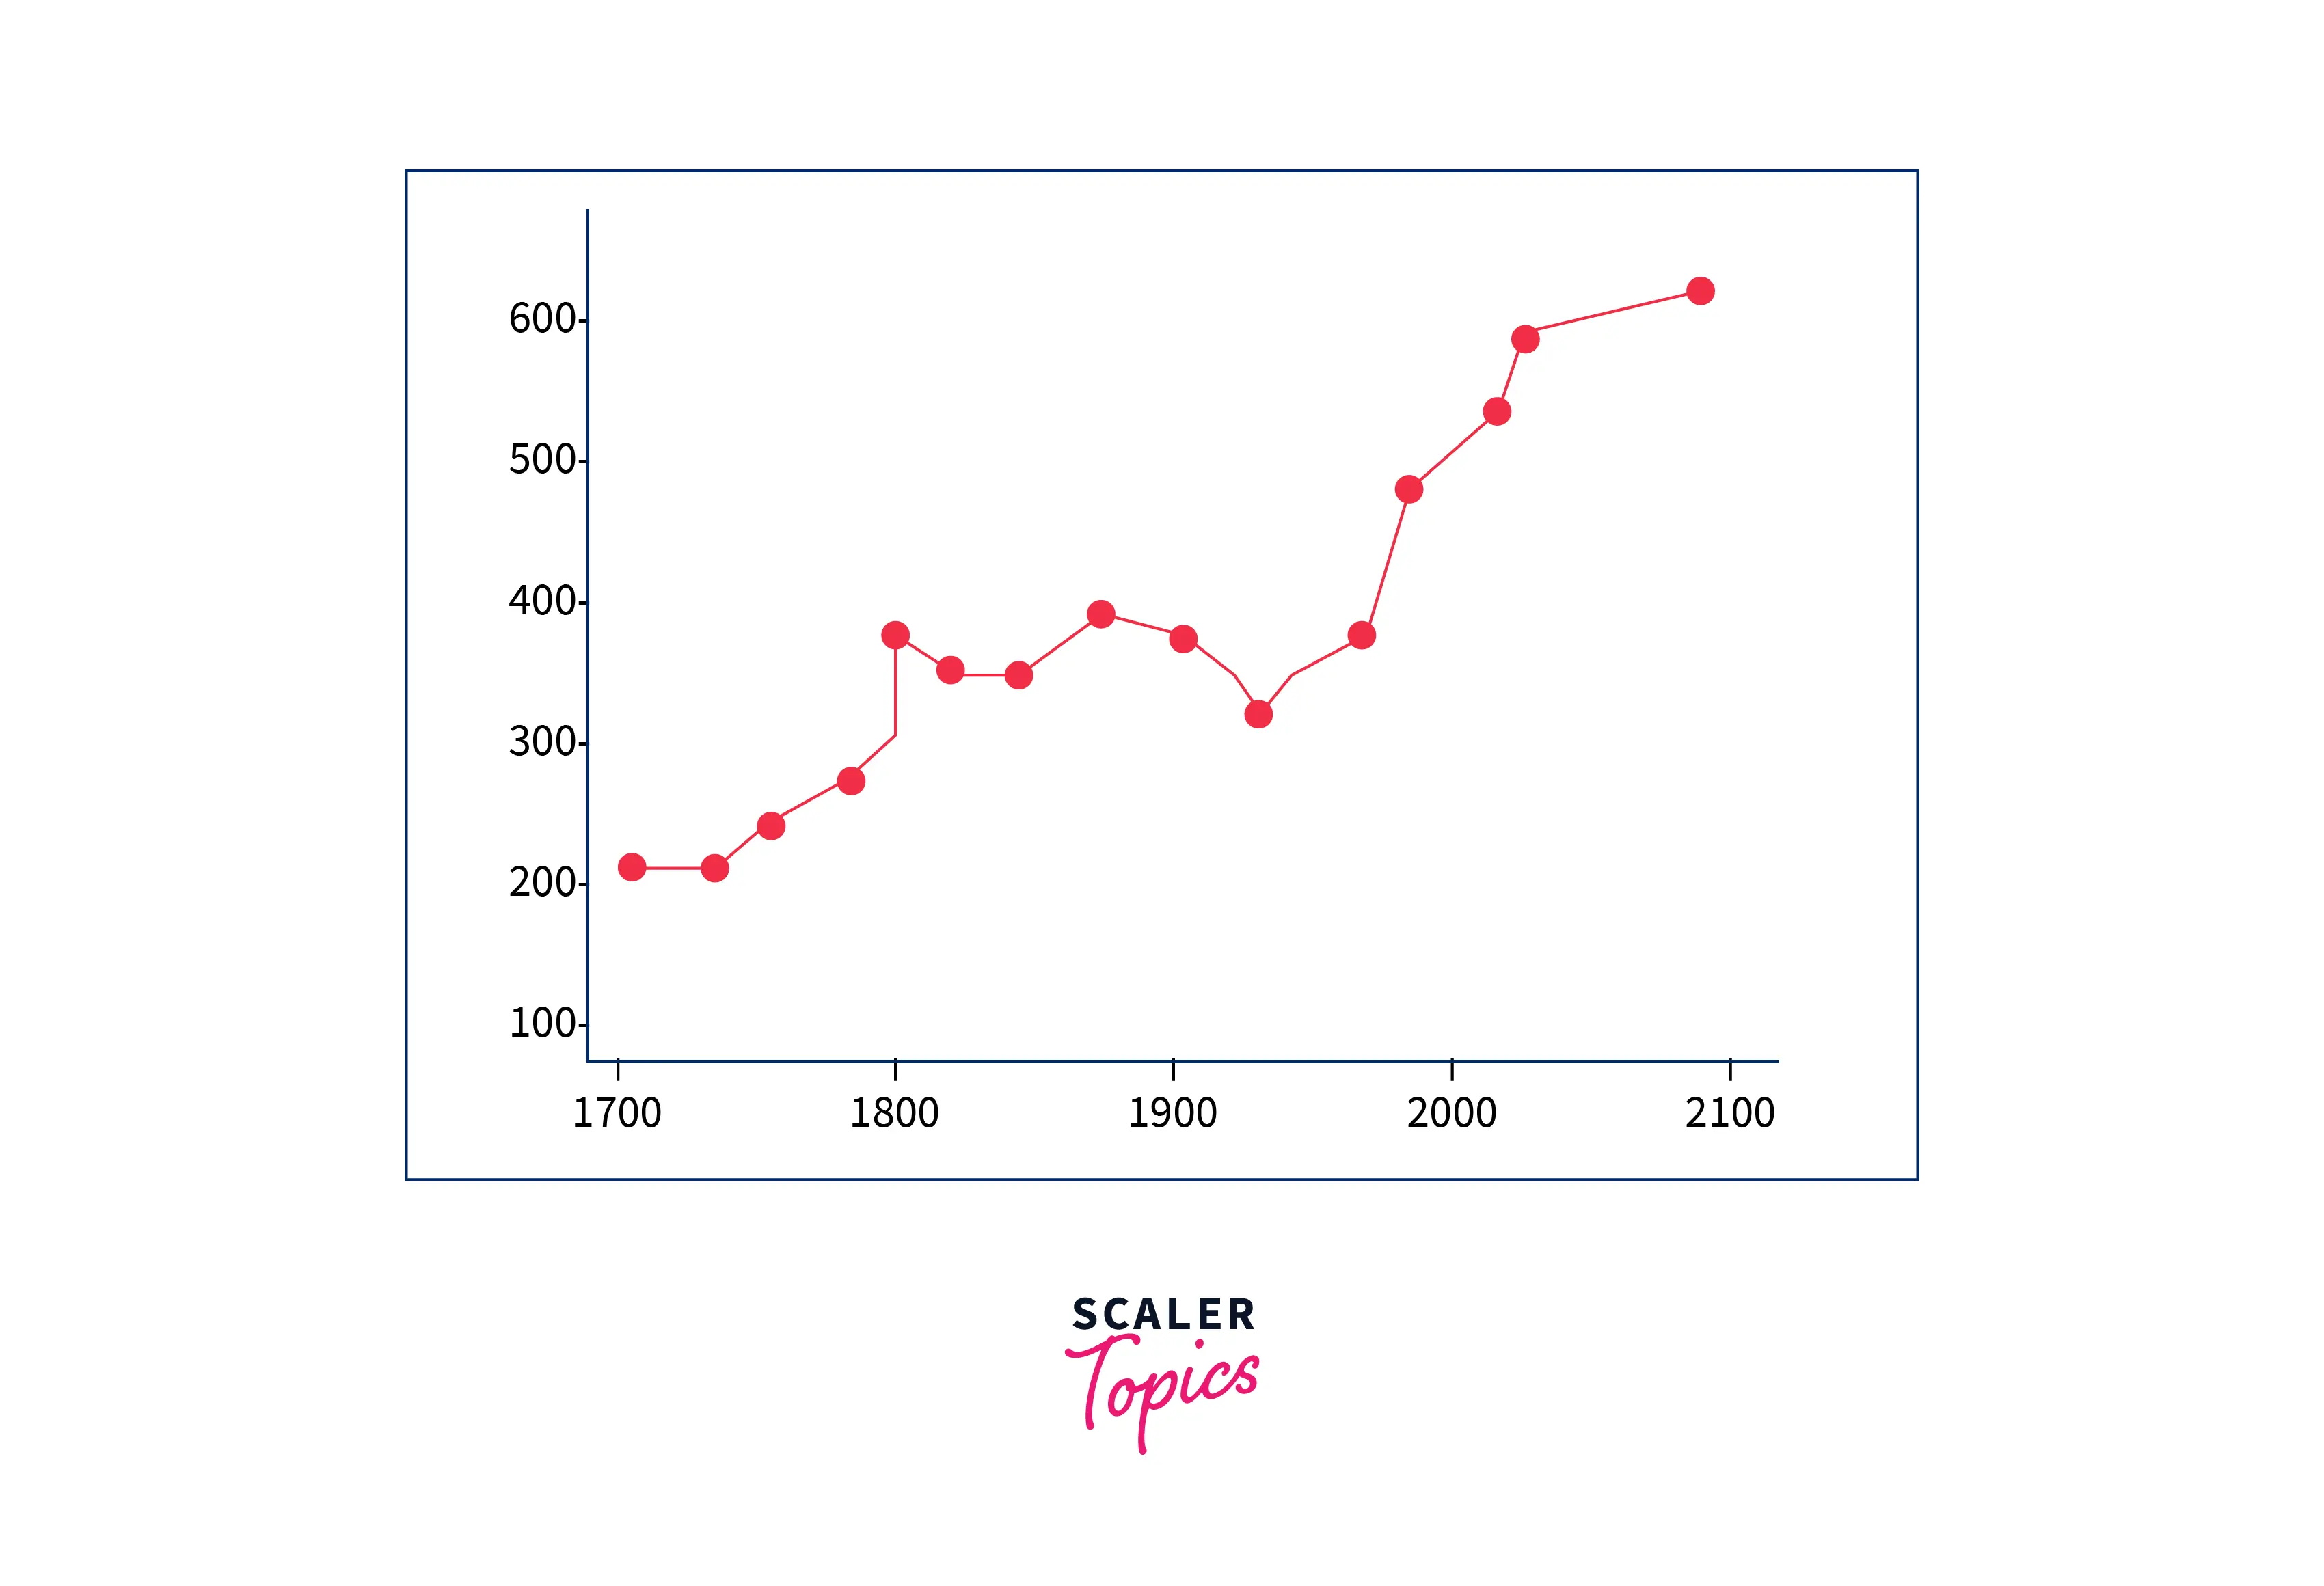
Time series data in machine learning is a collection of data points that appear to be in a specific sequence over a period of time. If you plot the points on a graph, one of the axes will always be time. For example, a chart illustrating how much inventory was sold on a specific day over a month plotted against each day would be a time series data. Cross-sectional data, on the other hand, captures a single point in time.
Introduction
A data collection that monitors a sample through time is known as a time series. Time series data in machine learning allows one to see the causes that affect certain variables.
A time series is a collection of data in which each value has a specific period. Any measurable quantity that is time-dependent, such as prices, humidity, or population, can be used as the value. Any medium might be measured with time series, provided the numbers we record are clear.
What Is Time Series Data?
Any variable that varies over time can be a subject of time series data in machine learning. A time series is frequently used in tracking an investment's price over time. This can be monitored over a short period, such as a security's price at each hour during a business day, or an extended period, such as the price of a security at close on the last day of each month over five years.
Examples
Time series data is commonly collected in banking, retail, and economics since currency and sales constantly fluctuate. When automated trading algorithms are used, stock market analysis is a fantastic illustration of time series analysis. Time series data can be used for predicting weather variations, assisting meteorologists in foreseeing everything from tomorrow's weather report to the following years of climate change. Following are some instances of time series data in machine learning that are further analyzed:
- Weather data
- Rainfall measurements
- Temperature readings
- Automated stock trading
- Interest rates
- Industry forecasts
- Stock prices
Difference Between Cross-Sectional and Time Series Data
| Time series data | Cross Sectional data |
|---|---|
| Time series data in machine learning is a set of observations collected at a usually equally spaced time that comes from different individuals or intervals. | Cross-sectional data are observations from different individuals or groups at a single point in time. |
| Focuses on the same variable over a period of time | Focuses on several variables at the same point in time. |
| Example: Profit of an organization over a period of 5 years | Example: Maximum temperature of several cities on a single day. |
Prominent Features of a Time Series
Time period
Firstly, there are no restrictions on the total time a time series data in machine learning can cover. A minute, a day, a month, or even a century might pass. All that is required are a beginning and an end. Of fact, there are generally many intermediate points, and the space of time that separates two consecutive ones is referred to as a time period.
Frequency
The dataset's frequency reveals how frequently the data values are captured. The periods in a time series data in machine learning must all be equal and precisely specified to be analyzed in a meaningful way. You can see how the two aspects are connected since this leads to a consistent frequency. This frequency, which measures time, might occur every few milliseconds or for several decades. But the ones we come across most frequently are daily, monthly, quarterly, and yearly.
Patterns
Finally, we may anticipate that the patterns found in the time series will continue to exist. Because of this, we frequently attempt to forecast the future through data analysis.
Usage of Time Series Data In
Weather Prediction
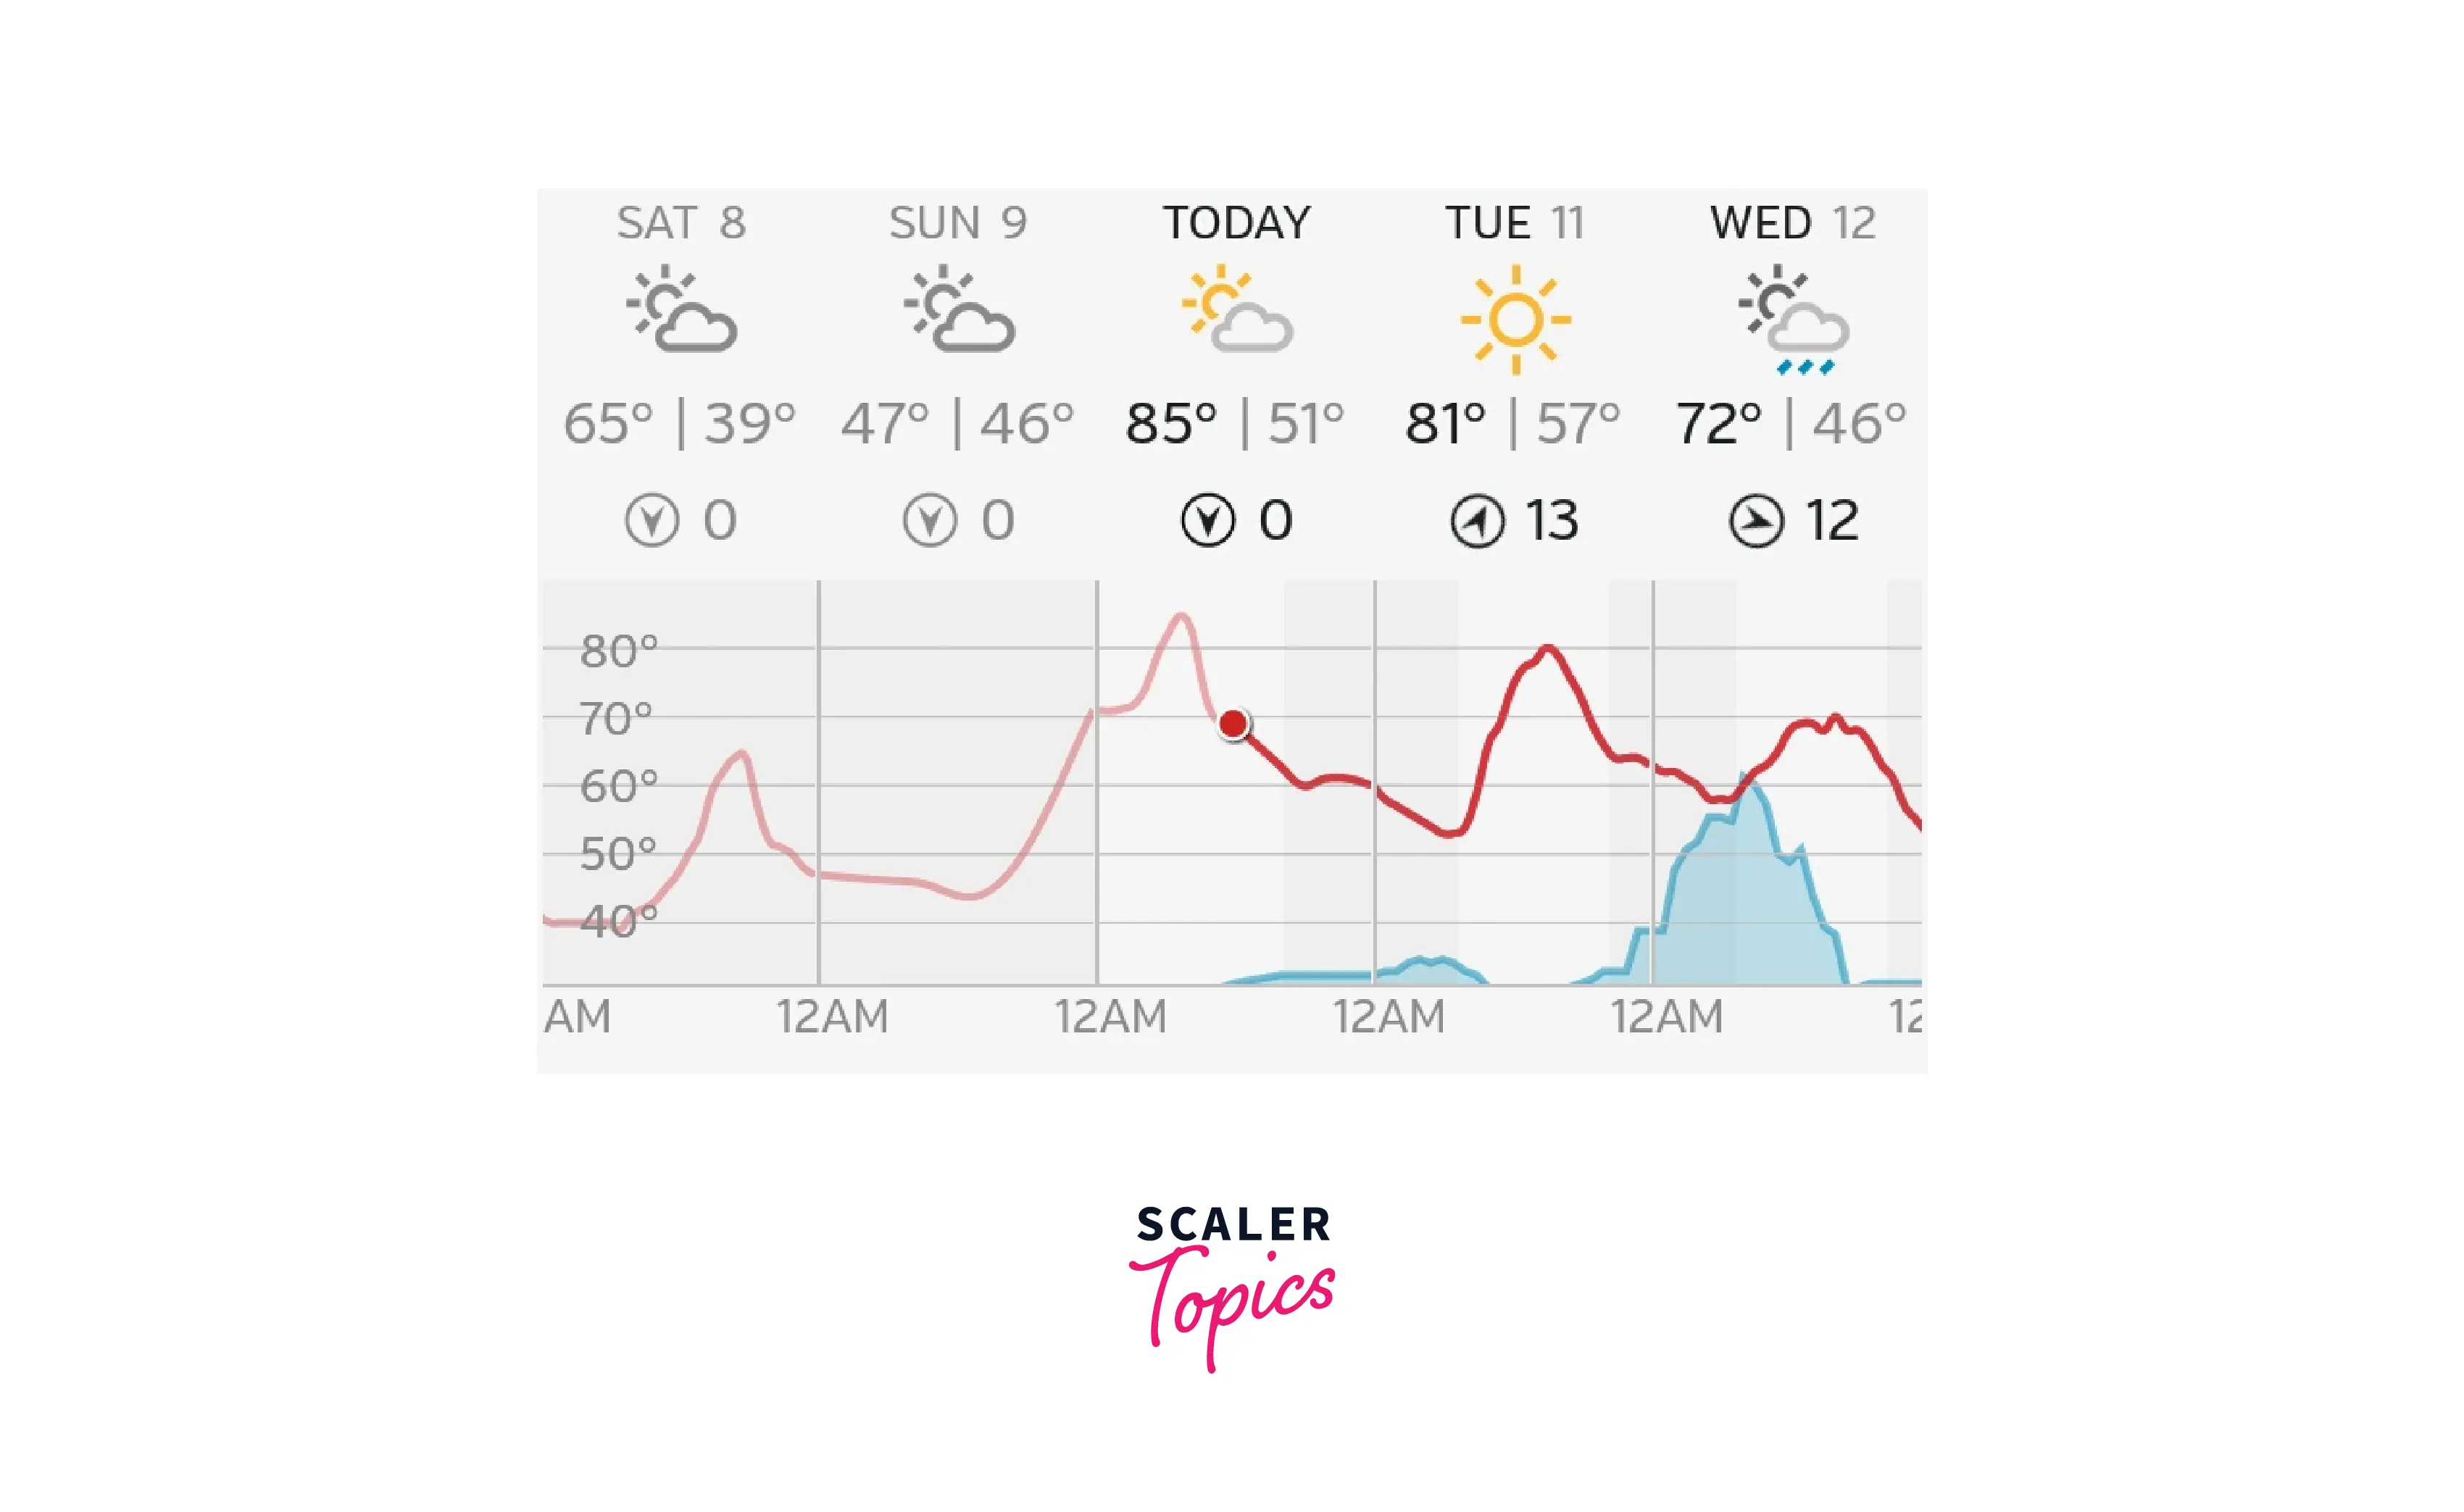
The task of predicting the weather for the coming days is one that meteorologists frequently handle. They rely on the analysis of historical data to consistently provide forecasts that are even somewhat correct. However, identifying the proper pattern would be challenging if the data were not arranged chronologically. For instance, we need to know which value belongs to each day to know the highest temperature for the past five days. Why? Because there is an equal likelihood of the temperature rising or falling five days in a row. As a result, the data would be far less valuable without the appropriate periods for each number.
Business
1. Finance
Time series data has many uses in business, particularly finance. Determining whether prices, returns, profits, and sales will rise or fall in the future is vital for investors and business owners. Therefore, assessing the effectiveness and stability of financial markets and portfolios is a widespread issue in time series analysis. For instance, these markets aren't particularly efficient if we can correctly estimate the prices of market indexes from initial values.
2. Sales Forecasting
Sales forecasting is another way that time series are used in business. In other words, we're examining historical tendencies to foresee present needs. This enables companies to fill their warehouses with goods and always have enough inventory. Additionally, it aids them in adjusting prices to generate the most significant profit.
What Is Time Dependency in Time Series Data?
Time series data in machine learning often depends on time. This implies that the values for each era are influenced by both the values of earlier periods and external causes. For instance, we anticipate the outdoor temperature to be close to today's figures tomorrow. Seasonality is another issue that might affect time series data in machine learning. The time of day and the year's season might affect some numbers, such as rain or temperature. We can foresee and consider these changes when making our projections because it is a recurring cycle. Regular data seldom show seasonality as a characteristic.
How Do We Denote Time Series?
We must properly use some notation to represent time series data in machine learning. We use capital letters to denote time series variables. Let's take an example. Let's take a time series that notes a particular city's average temperate every day.
X - The name of this particular time series that denotes a city's average daily temperature. T - A capital T would denote the whole time period the series covers. t - A lowercase t would represent a specific period that falls inside the interval.
Imagine having access to the daily average temperatures for an entire year. The lowercase t could stand for a single day, and the capital T denotes the whole year.
X of t - We would use this notation to indicate the temperature on a particular day.
For example, let X be a time series of Mumbai's average daily temperature and t = 1st January. Then X of t = 24°C indicates that the average temperature of Mumbai on 1st January was 24°C.
Conclusion
- Cross-sectional data employs various data at a particular moment, whereas time series data takes the same factors into account across an extended period.
- Time series data is time-dependent as the previous or forthcoming information depends on the current.
- Time series data in machine learning has various applications, from finance to medicine and from markets to weather.