Animation with Matplotlib
Overview
Python’s plotting library, Matplotlib, has the functionality to create animations and dynamic visualizations. The matplotlib.animation module and the FuncAnimation class are used to build the plots. It offers a framework on top of which the animation features are constructed. This article will discuss the concepts and approaches for utilizing Python's Matplotlib to create animations.
Introduction
Animations are an exciting way of demonstrating data. Animations make more sense when depicting time-series data since we can see how a particular parameter behaves with time.
Matplotlib is a Python 2D plotting library and one of the most popular python visualization packages. One can easily generate plots, histograms, bar charts, scatterplots, etc., with matplotlib. It also integrates seamlessly with libraries like Pandas and NumPy to create even more sophisticated visualizations. It can also be used as an animation tool. The easiest way to make a live animation with Matplotlib is to use one of its Animation classes.
How to Create Animation with Matplotlib
The Matplotlib package for Python is a fantastic animation tool. When animated, the plotted graphs provide a more informative picture.
Installations Required
A few prerequisites must be met to follow along with this tutorial:
- We will build up a new Python virtual environment to get the coding process started.
- The PC must have Python installed. Installing the Python Anaconda Distribution is recommended.
- You should be familiar with the fundamentals of Python and use your IDE or a terminal prompt to run Python programs.
- Installing modules such as Numpy and Matplotlib is recommended.
- Ffmpeg or Imagemagick must be installed in order to save the animation to your computer as an mp4 or gif file.
Transform Your Career
Choose from our industry-leading programs designed for career success
Modern Software and AI Engineering Program
Master full-stack development with AI integration

Modern Data Science and ML with specialisation in AI
Advanced data science techniques with AI specialization
Advanced AIML with Specialisation in Agentic AI
Deep dive into AIML with focus on Agentic systems
DevOps, Cloud & AI Platform Engineering
Build and manage AI-powered cloud infrastructure
AI Engineering Advanced Certification by IIT-Roorkee
Premier AI engineering certification from IIT-Roorkee
By Calling a Function Over and Over
By continually calling a function func, the TimedAnimation subclass of FuncAnimation creates a matplotlib animation. The Animation object has a single reference to a timer that updates the animation (usually from the host GUI framework). The animation will stop if we do not maintain a reference to the Animation object, forcing the timers to be garbage collected.
Scaler Placement Report and Statistics
Scaler learners achieved 2.5x salary growth with average post-Scaler CTC reaching ₹23L.
By Using Fixed Objects
A matplotlib animation scene is created by combining various animated artistic objects. It’s crucial to remember that without a constant reference to the animated item, the animation would stop. This is so that when the time comes to run the animation, the single pointer reference to the animation object of the Animation class can still be used; otherwise, it will be collected as garbage and destroyed.
Basic Animation
The matplotlib.animation is at the heart of the animation tools. Animation class offers a framework on top of which the animation functionality is developed. TimedAnimation and FuncAnimation are the two primary interfaces.
How to Create an Animated Line Plot
The animated line plot will be produced using the FuncAnimation class from the Matplotlib.animation library.
Output:
The function that creates the plot should, at the very least, accept one input representing the animation’s frame number. A simple parameter like 'i' can be provided for this frame number argument. Add it to the function definition. The figure window is cleared by the line ax.clear() in the function’s middle, allowing the next frame of the matplotlib animation to be rendered. Towards the end of the script, plt.show() will be called from outside the function. To start the animation, we must call the animate() function we just defined.
At the very least, we must pass the figure object fig and our matplotlib animation function, which draws the plot animate, to the FuncAnimation class. Additionally, we will add the frames= keyword parameter, which controls how frequently the matplotlib animation function is invoked and how often the plot is redrawn. Finally, the interval parameter defines the milliseconds between frames.
Continuous Sine Wave
Here also, we will use FuncAnimation to do a basic matplotlib animation of a continuous sine wave.
Output:

Let’s proceed and examine what is happening. After importing the necessary parts of Numpy and Matplotlib, we establish a figure window, a single axis in the figure, and then our line object that will be updated during the animation.
We will then develop the programs that enable the matplotlib animation. The procedure used to produce the initial base frame for the animation is called init(). The init function determines the axis limits, which initializes the data. The blit parameter ensures that only the plot's modified parts are redrawn. The animation object is the last thing we construct. We have settled on an animation with 220 frames and a 20 ms gap between each frame. Lastly, we have a save command that is optional.
Build a Live Plot
Static 2D graphs can be produced using Python and Matplotlib. However, animated plots with dynamic auto-updating can also be made with Matplotlib.
Turn Learning into Career Growth
Based on User Input
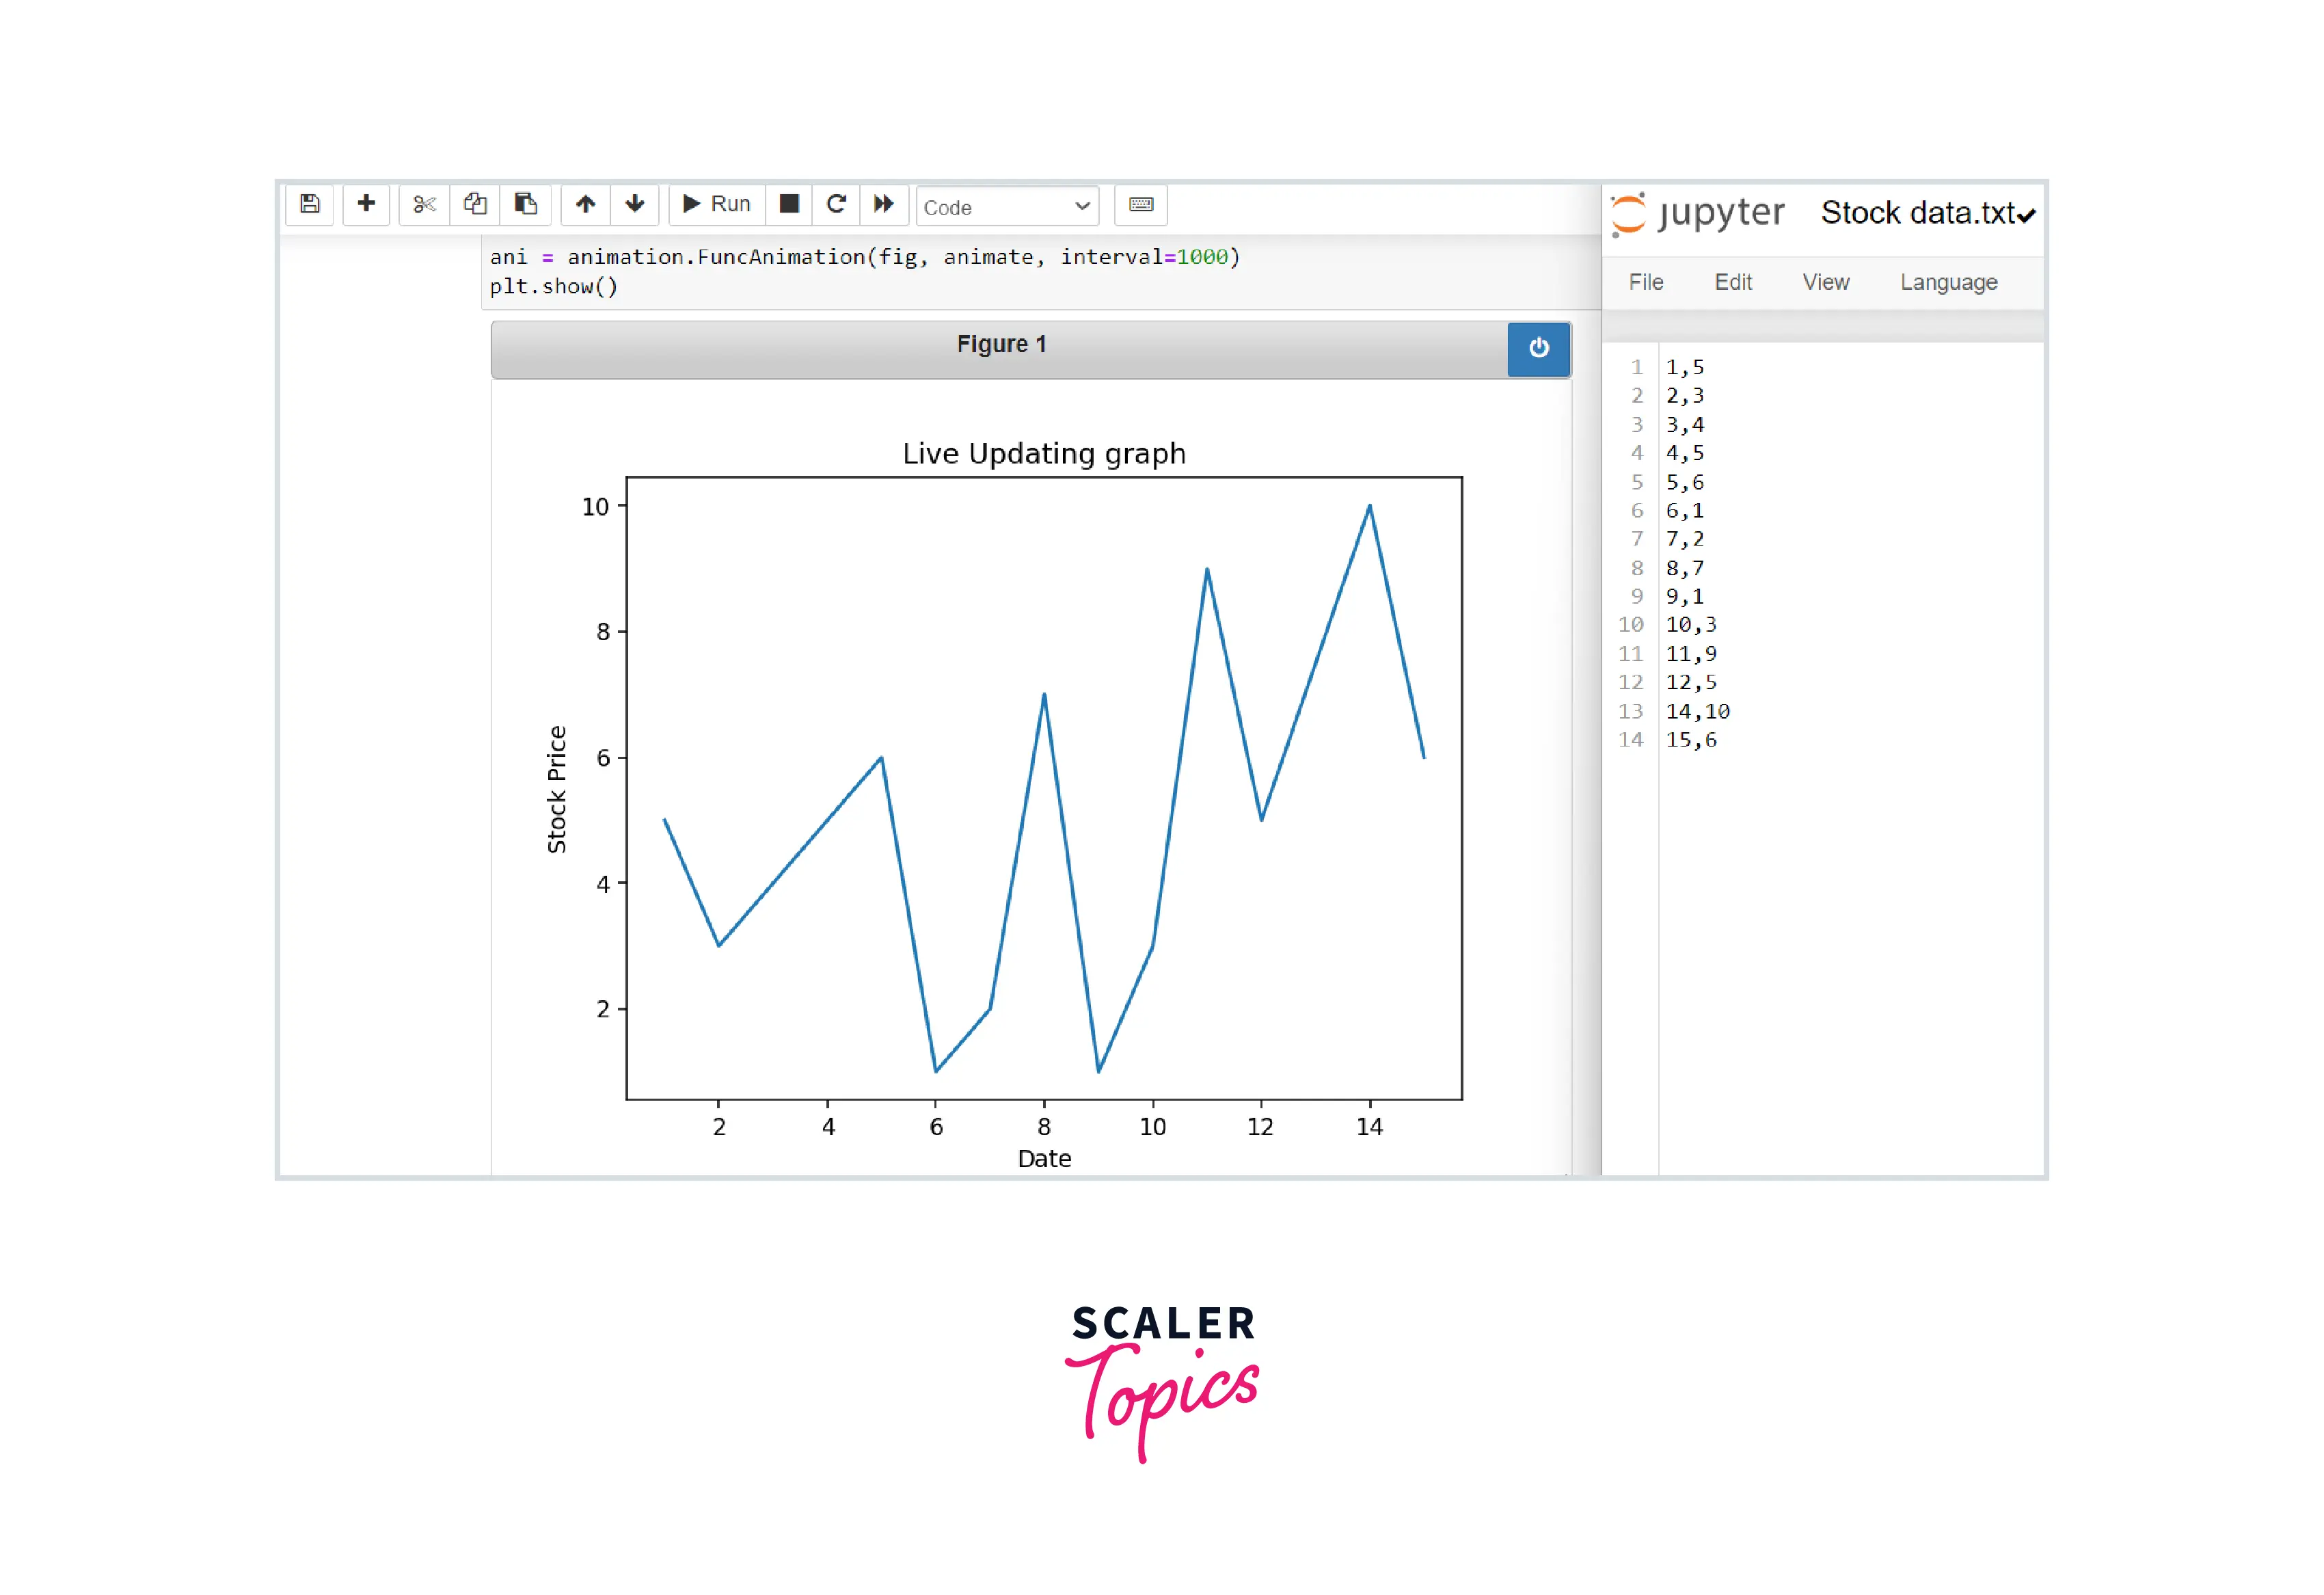
When plotting dynamic quantities like stock price, sensor data, or any other time-dependent data, live updating graphs come in handy. We create a base graph continuously updated, as new data is added to the system. For example, let’s chart the stock prices of an imaginary company over one month.
The FuncAnimation class of Matplotlib is imported from matplotlib.animation library, while the Matplotlib pyplot library is imported as plt. The FuncAnimation class will generate our live, automatically updated plot, and an animation() function will be created to draw the plot. Create a new file called Stock data.txt in the live plot directory next to our live plot script before running the script. Then, add a few numbers to the file, one per line. Stock data.txt should be saved and left open. We will add numbers to this file as we update the plot in real-time. Launch the Python file in the terminal now. We will receive an animated graph similar to the one below, which changes automatically as follows:
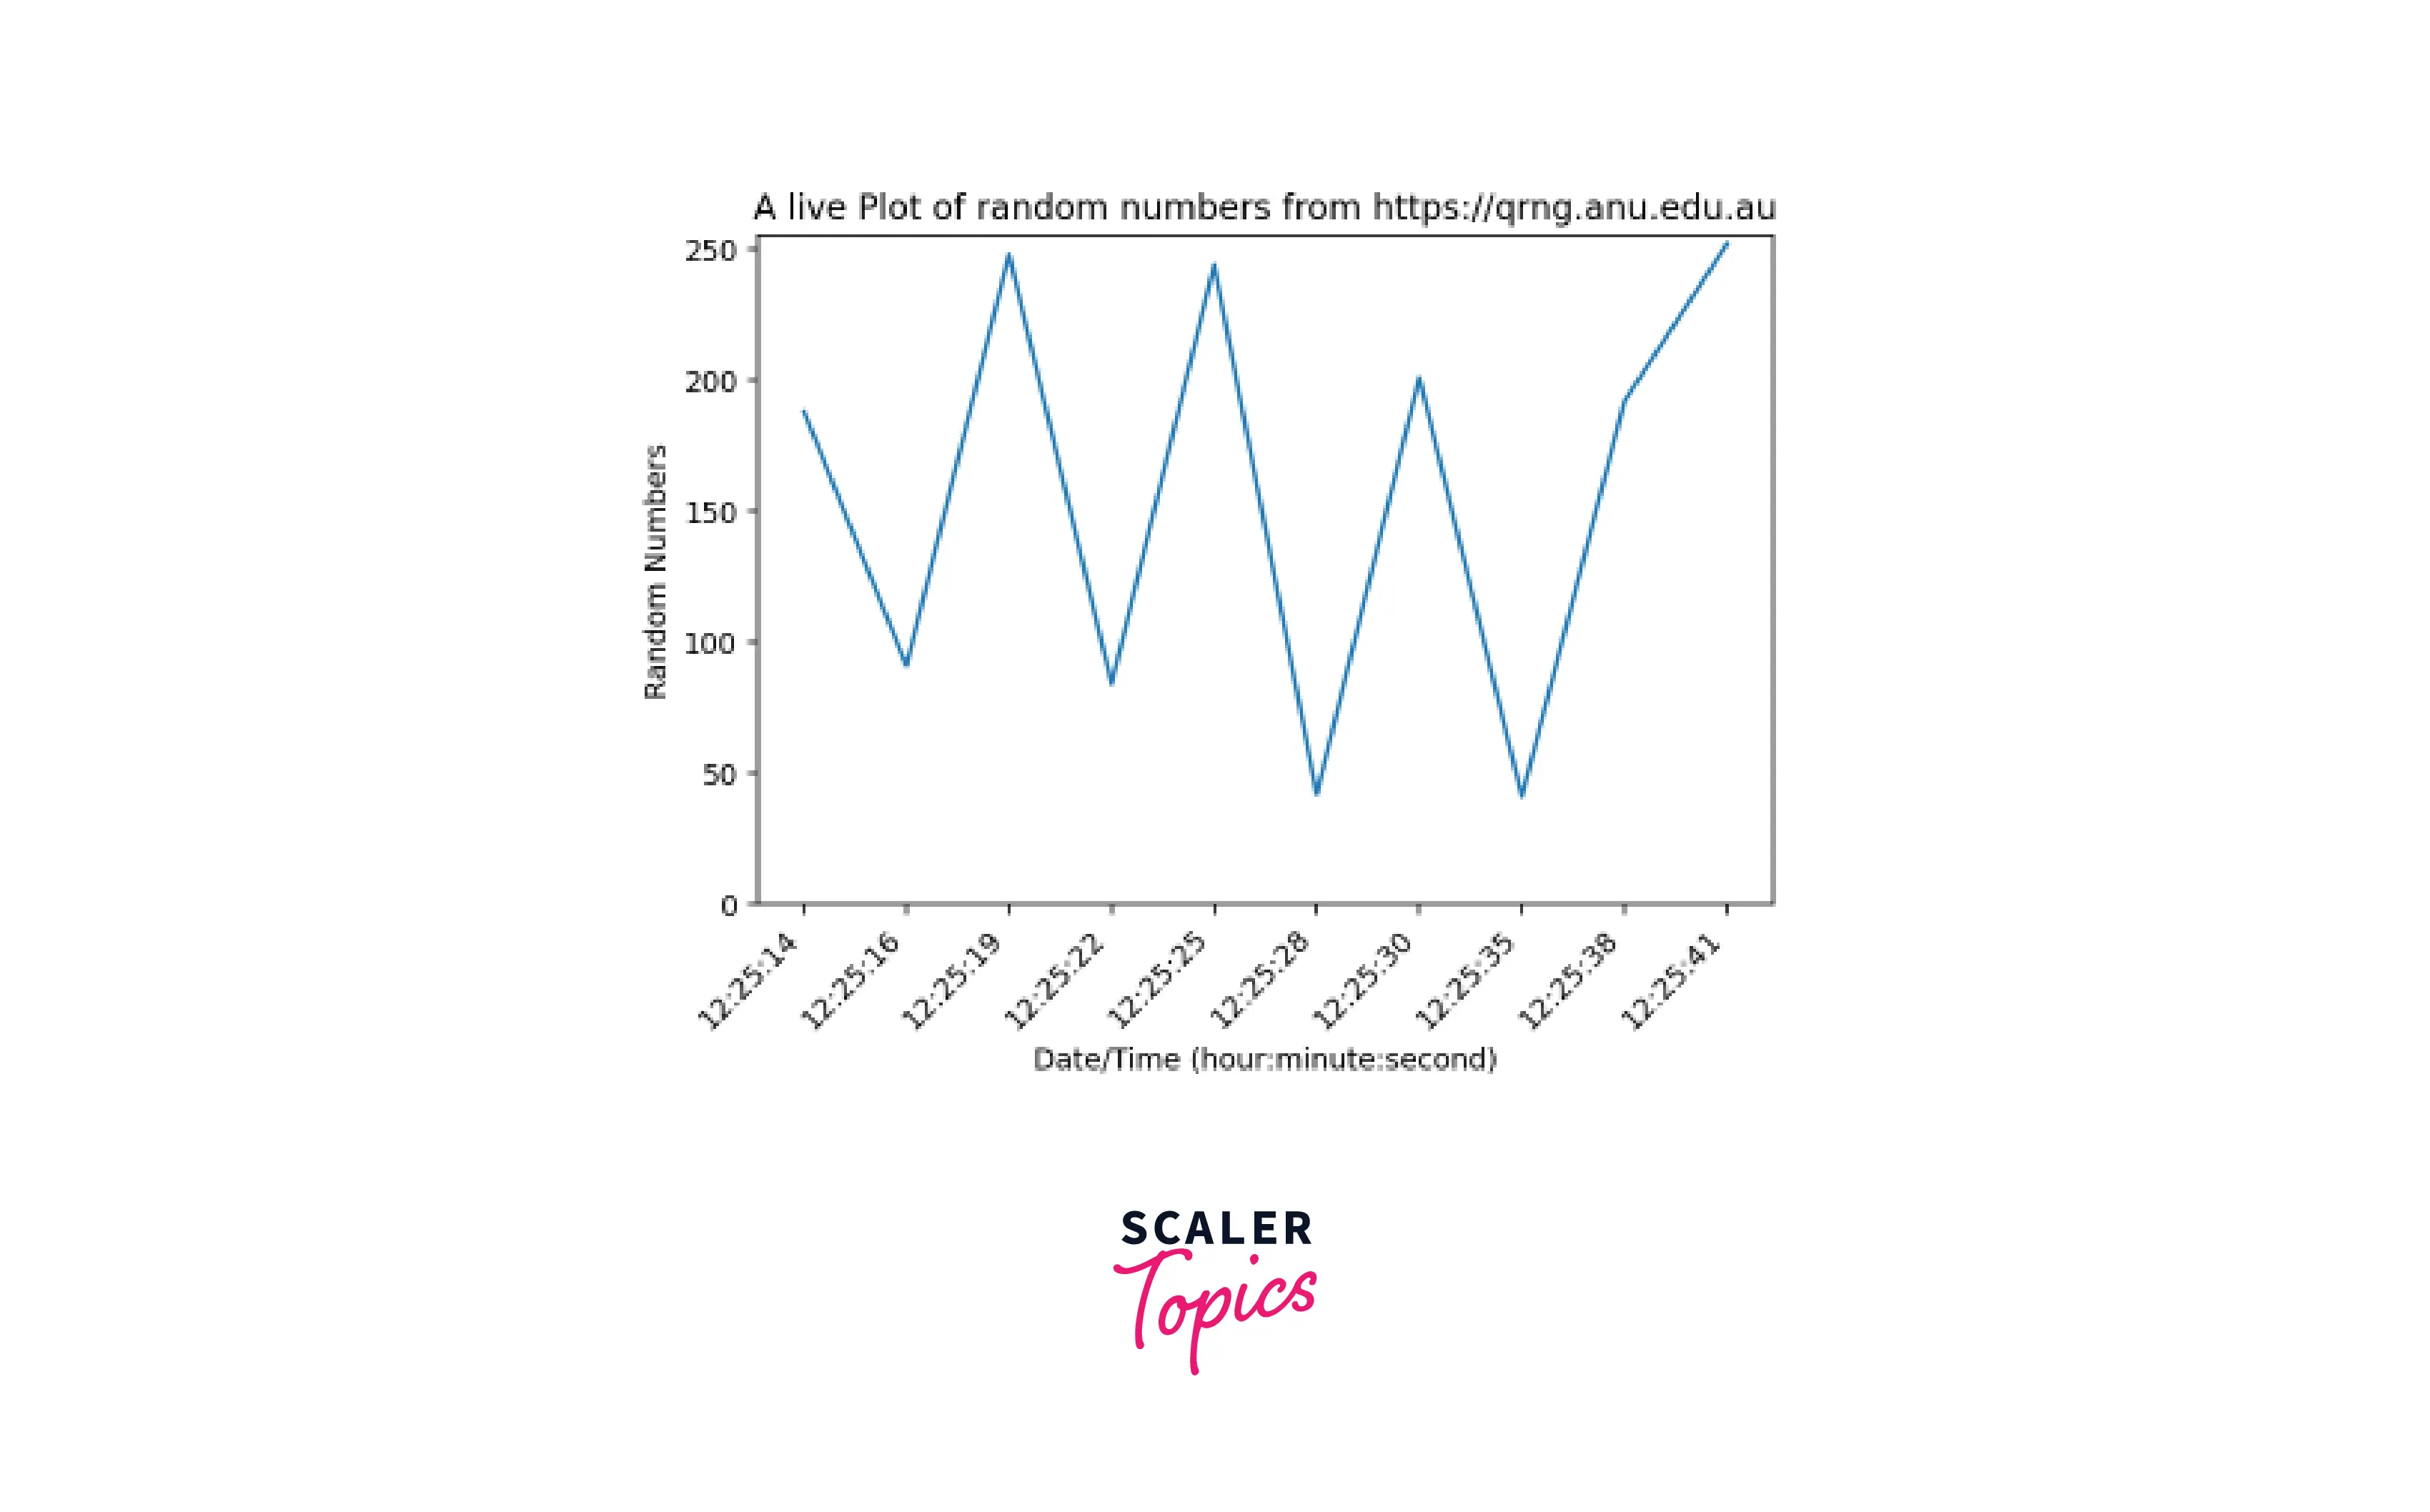
Using Data From The Web
We are going to build an animation with matplotlib that pulls data from the web. API-Demo: This website offers true random numbers to anyone on the internet. The random numbers are generated in real-time. An example of the resulting plot is below.
Output:
Examples
The possibilities are unlimited if we incorporate some physics into the animate function. Matplotlib framework is quite solid and adaptable for creating and preserving animation. Here are a few illustrations of physics animations with matplotlib.
Double Pendulum
In this example, the pendulum position is precalculated over ten seconds, and the results are animated.
In this case, we have developed a class that holds the state of the double pendulum (encoded in the angle of each arm + the angular velocity of each arm) and supports some functions for computing the dynamics. The matplotlib animation functions are the same, but the update function only modifies the text and point positions to keep track of time and energy. Here is the resulting animation of the double pendulum,
Particles in a Box
The elastic collisions of a set of particles in a box under the influence of gravity is another animation with matplotlib that can be produced.
The collisions are elastic, preserving both energy and 2D momentum, and the particles accurately bounce off the box’s walls before falling under a steady gravitational force. Here is the output
Animations using Celluloid Module
In matplotlib, the process of making animations is made easier using the Python module called Celluloid. This package generates a Camera from a Matplotlib figure; that is, we “photograph” our visualization using celluloid to make a frame at each iteration. Then, once all the frames have been recorded, we can make one call to generate an animation. Creating Matplotlib Animations is simple using the Celluloid module.
Installation : pip install celluloid
Here is an example,
Output:

Saving an Animation
We will likely want to save the animation we create using Matplotlib’s amazing matplotlib.animation object.
Depending on the intended usage, we can save the Matplotlib animation in the gif, mp4, avi, or mov file formats. When storing an animation as a.gif file, the writer option frequently causes the greatest confusion.
The two most popular choices are PillowWriter and ImageMagick.
Even though ImageMagick is advised as the preferred Writer Instance for saving in the .gif format, using it might be challenging, particularly for Windows users. You can use PillowWriter if you use Windows. You can still use ImageMagick by installing it. Both ways, PillowWriter is a fantastic, hassle-free choice.
While creating a video file using Python or its libraries, problems can arise since the user may need the ffmpeg packages installed on their computer. This is a problem that many people encounter frequently. It’s easy to set up ffmpeg: Navigate to the official download page. Then, ensure the OS you choose is the right one for your computer (Linux-Windows-Mac available).
Conclusion
- We discussed the key features of Matplotlib's Animation class.
- The matplotlib.animation module and the FuncAnimation class are used to create animated plots.
- The Animation class in Matplotlib can be used by calling a function over and over as well as by calling fixed objects.
- TimedAnimation and FuncAnimation are the two primary interfaces of the Matplotlib Animation class.
- We have to define the animate() function and call it inorder to start the matplotlib animation.
- init method can be used to produce the initial base frame for the animation
- We can also produce live plots using data collected from the web and sensors, and also User Input.
- The Celluloid package generates a Camera from a Matplotlib figure.