How to Add Text on a Figure in Matplotlib?
Overview
Making our plots and visualizations presentable is one of Python's critical aspects of data visualizations. One of the most prominent ways to make your plots informative is to add text in the right places. Suppose we have to plot the prices of houses in a particular year. To represent the house with the highest price, we can either fill the bar for that house, or we can use text to indicate the prices of the houses. In this way, we can explain our data better. This article will cover various ways to add texts to our plots, along with some examples.
Transform Your Career
Choose from our industry-leading programs designed for career success
Modern Software and AI Engineering Program
Master full-stack development with AI integration

Modern Data Science and ML with specialisation in AI
Advanced data science techniques with AI specialization
Advanced AIML with Specialisation in Agentic AI
Deep dive into AIML with focus on Agentic systems
DevOps, Cloud & AI Platform Engineering
Build and manage AI-powered cloud infrastructure
AI Engineering Advanced Certification by IIT-Roorkee
Premier AI engineering certification from IIT-Roorkee
How to Add Text to a Plot?
In matplotlib, there are many ways to add texts to a plot. The easiest and most feasible way is using the plt.text() function.
plt.text() function is widely preferred when putting texts on plots, as it is highly customizable and very easy to understand.
In matplotlib, we have total control over every text property (font size, weight, location, colour, and so on).
Some pyplot functions that can be used to insert text in our plots are: text(), xlabel(), ylabel(), title() etc. All these commands return a matplotlib.text.Text instance.
We can customize the matplotlib text properties by passing keyword arguments to the functions or using matplotlib.artist.setp().
Syntax
Where:
- x_c: x-coordinate where we want our text to be.
- y_c: y-coordinate where we want our text to be.
- s: String that we want to be displayed.
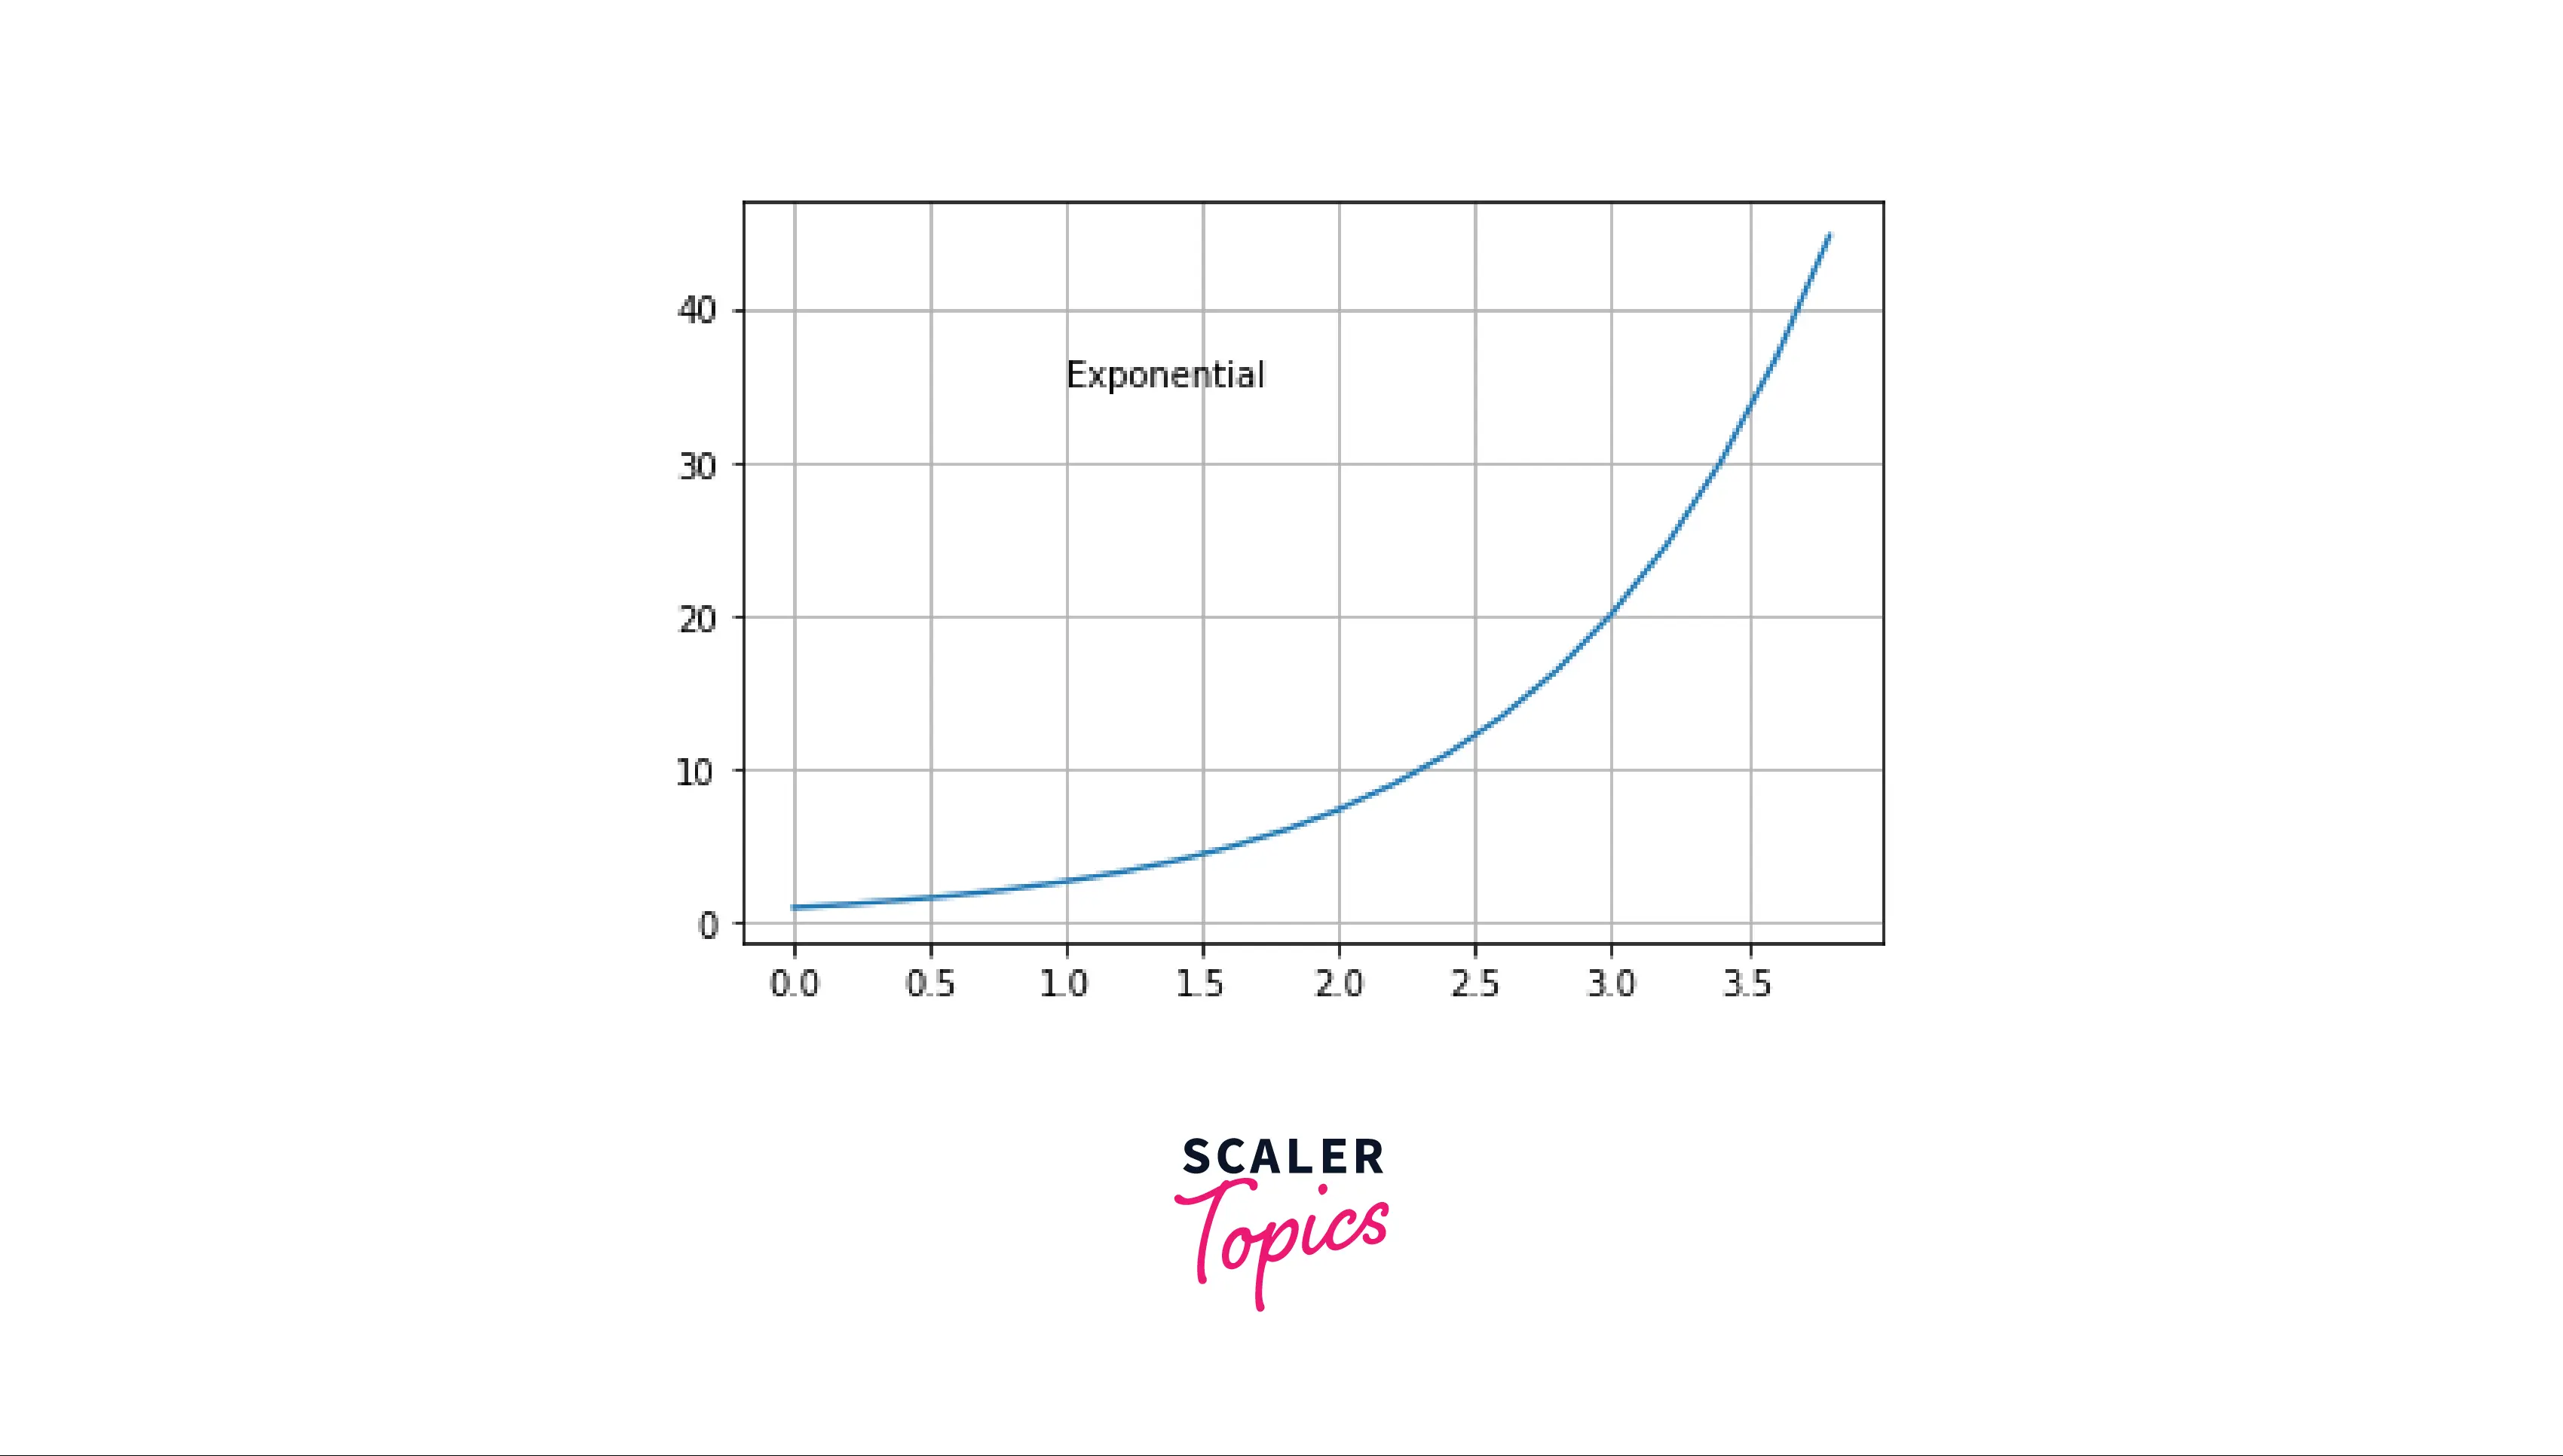
Here's an example to start with plt.text()!
Output:
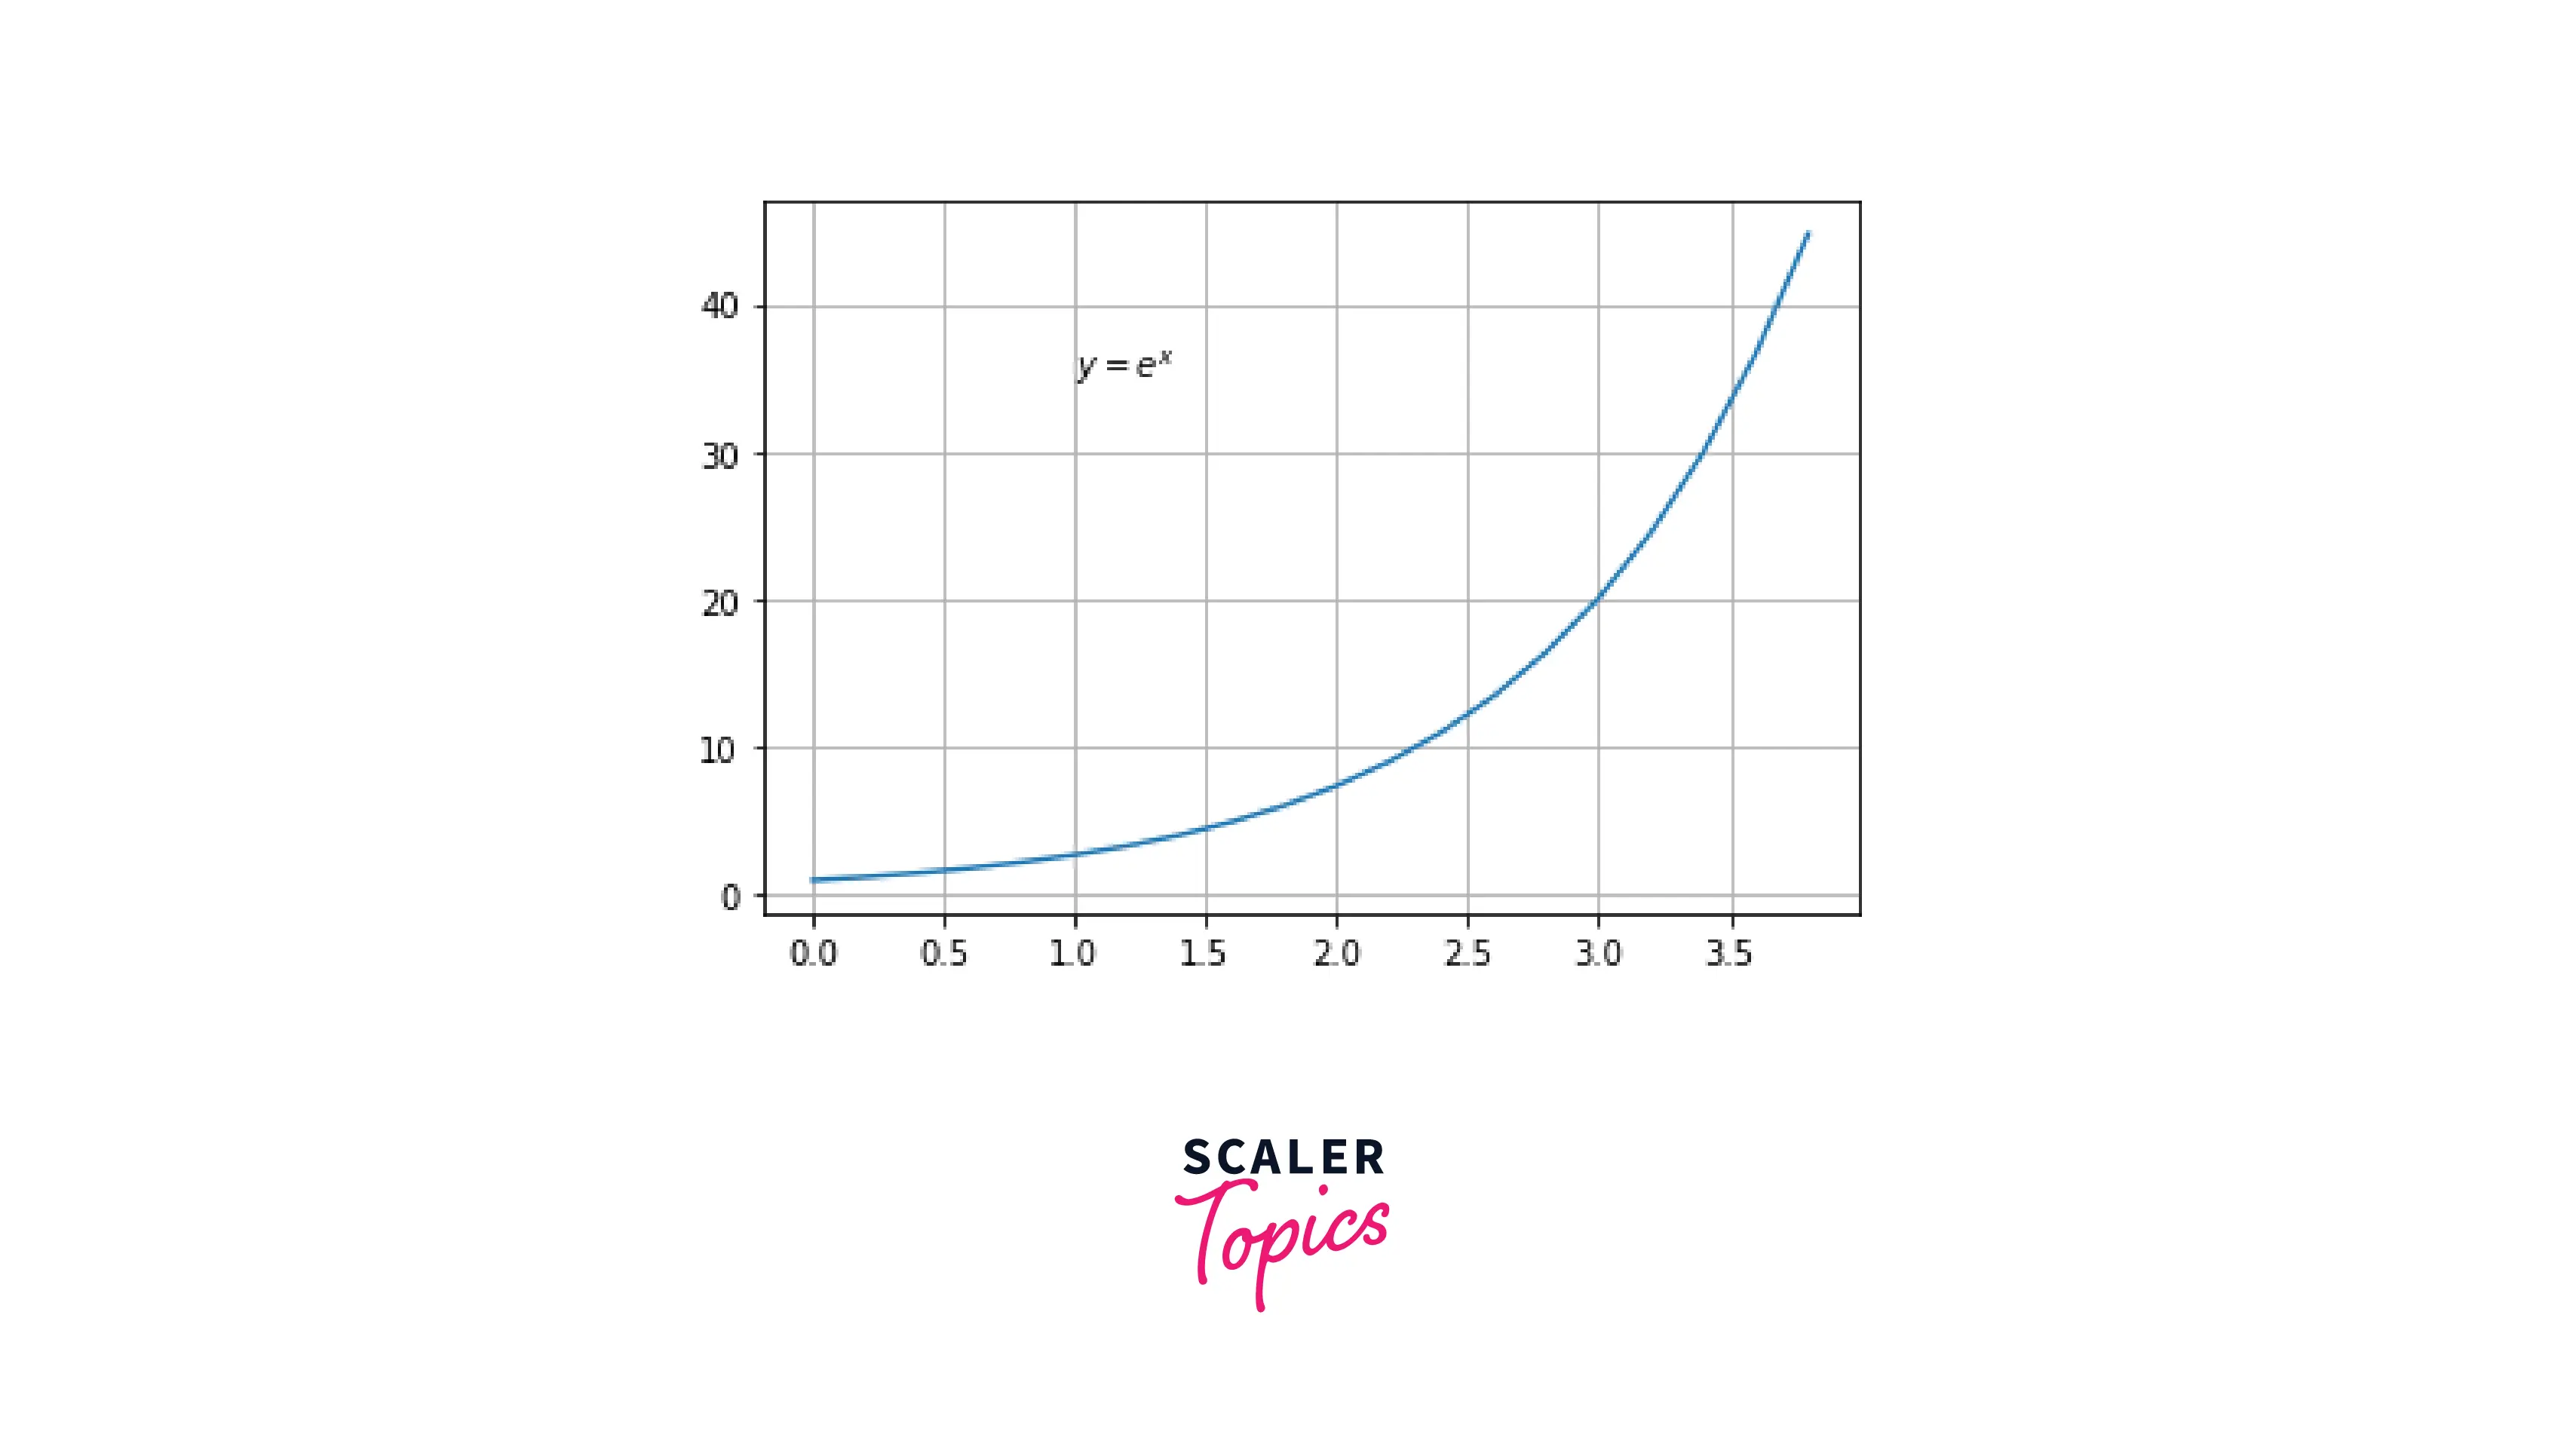
Alternatively, we can also use the LaTex syntax. What is a LaTex syntax? Don't worry, we've got you covered!
LaTex is a system used to produce documents with a professional appearance. Based on the WYSIWYM (what you see is what you mean) principle, you only need to concentrate on the content of your matplotlib text; the computer will handle the formatting.
Output:
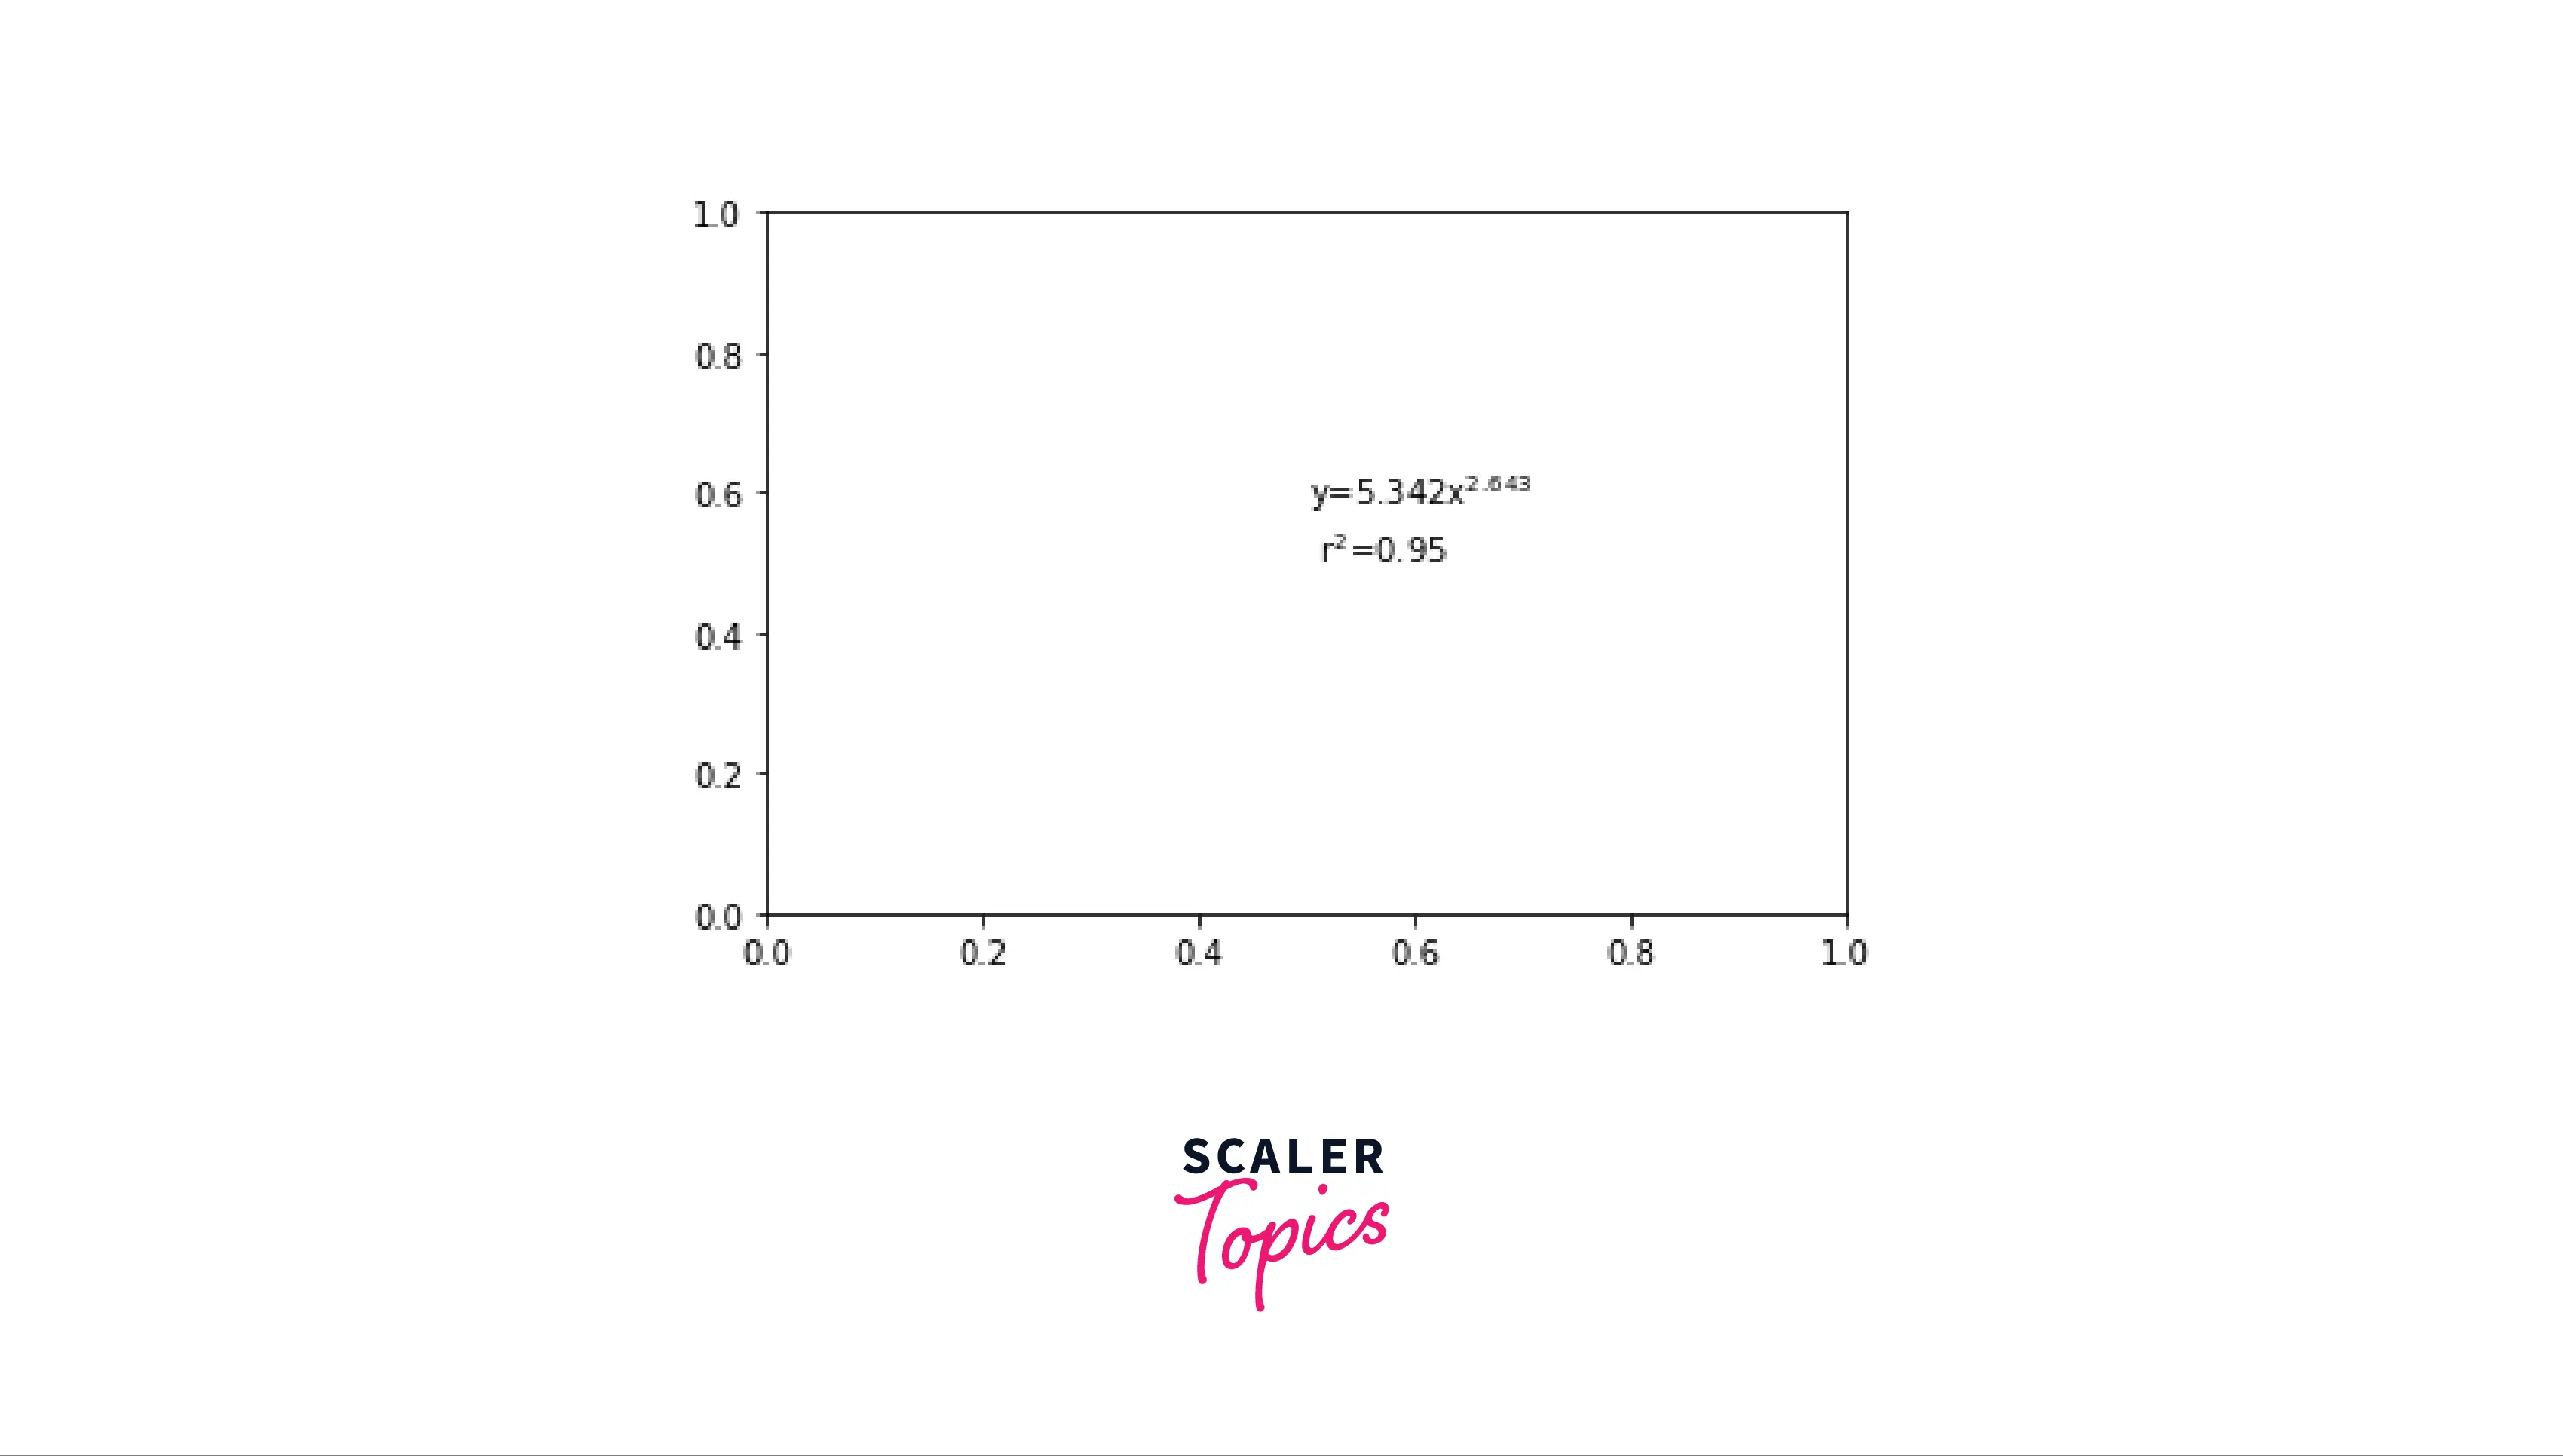
Adding multi-line Text to a Plot
We need to use the '\n' keyword to add multi-line text to a plot. '\n' in Python adds a new line to our string. We require multi-line text to a plot when we want to label a data point in a detailed manner. We will use it similar way in our plot.
Output:
Turn Learning into Career Growth
How to Change the Style of a Text?
Changing the style of texts in a plot is important because not every text can be visible in a plot. Using a large font will be insignificant if our plot is of high density. Inversely, using a small font would be meaningless if our plot is of low density.
In matplotlib, there are many options for studying our texts. For example, we could increase the font size and the style of the font. We could also increase the intensity of the font.
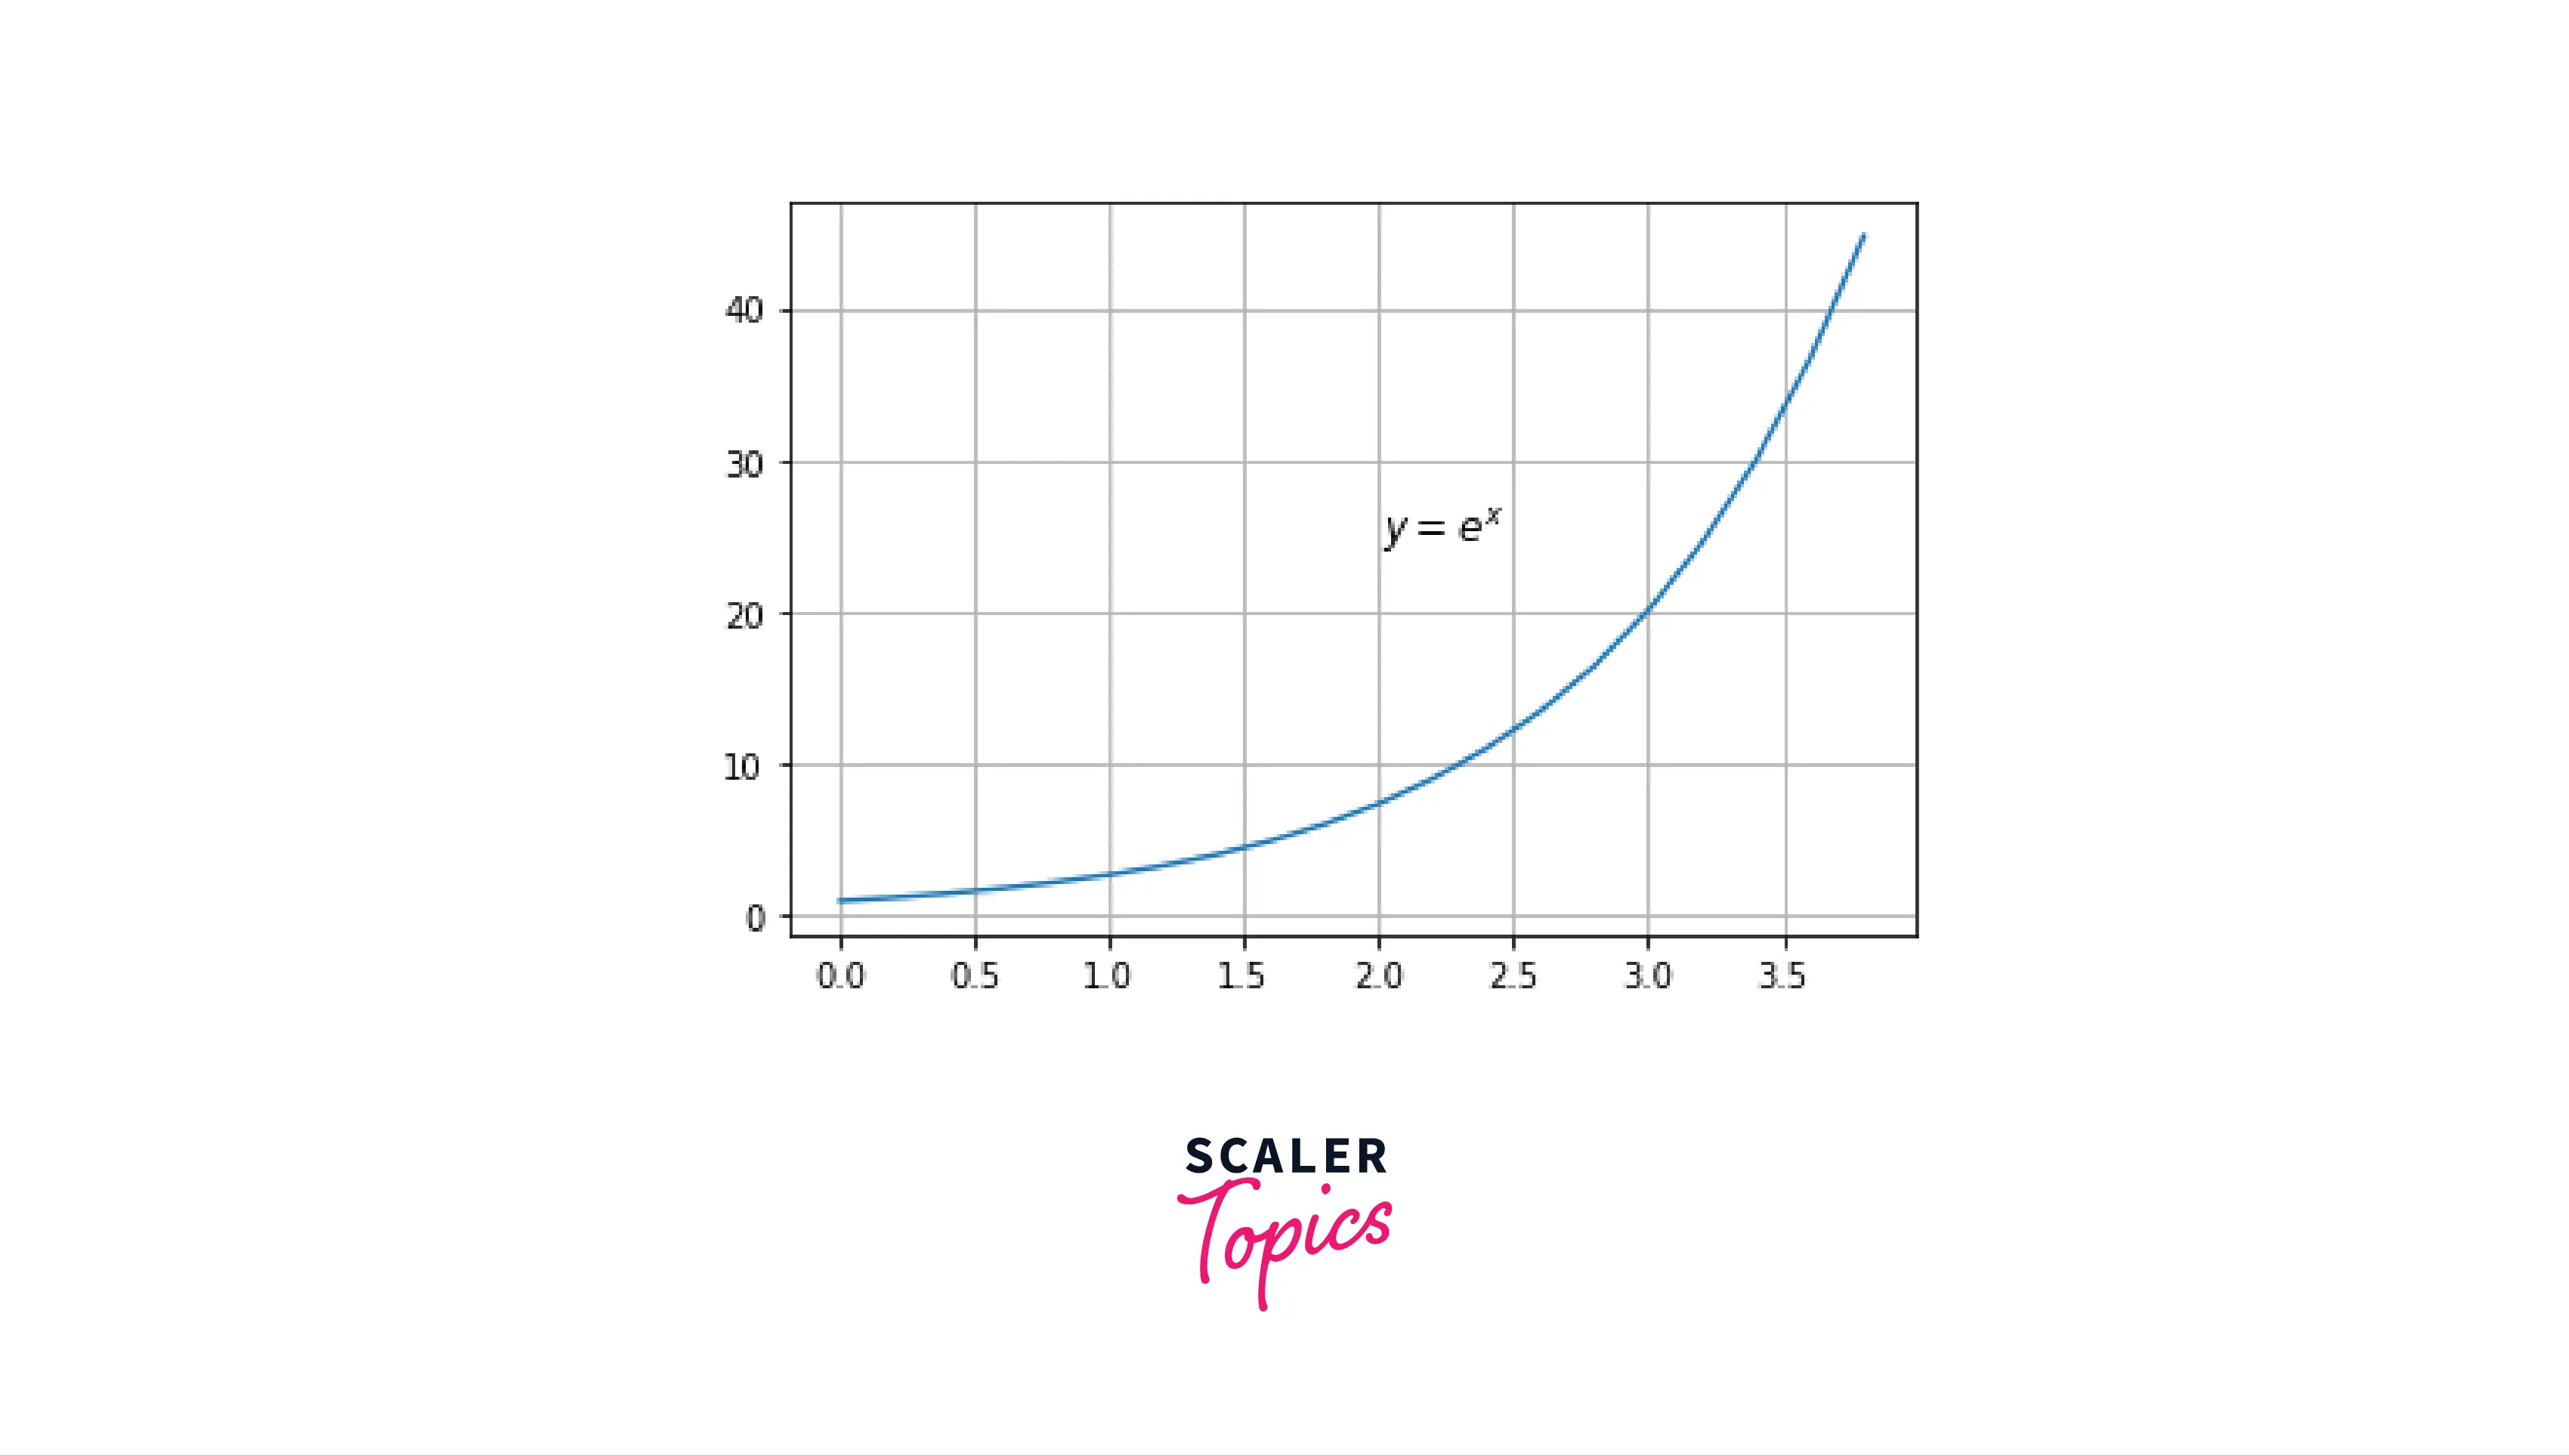
In this example, we will try to centre our text to the centre, using the horizontal and vertical arguments.
Output:
To change the colour of our text in matplotlib, we use color parameter in plt.text()
Output:

Scaler Placement Report and Statistics
Scaler learners achieved 2.5x salary growth with average post-Scaler CTC reaching ₹23L.
Examples
Here are additional examples to strengthen your hold on matplotlib text.
Setting text on the top-left corner:
Output:
Similarly, we can move our matplotlib text anywhere in our plot!
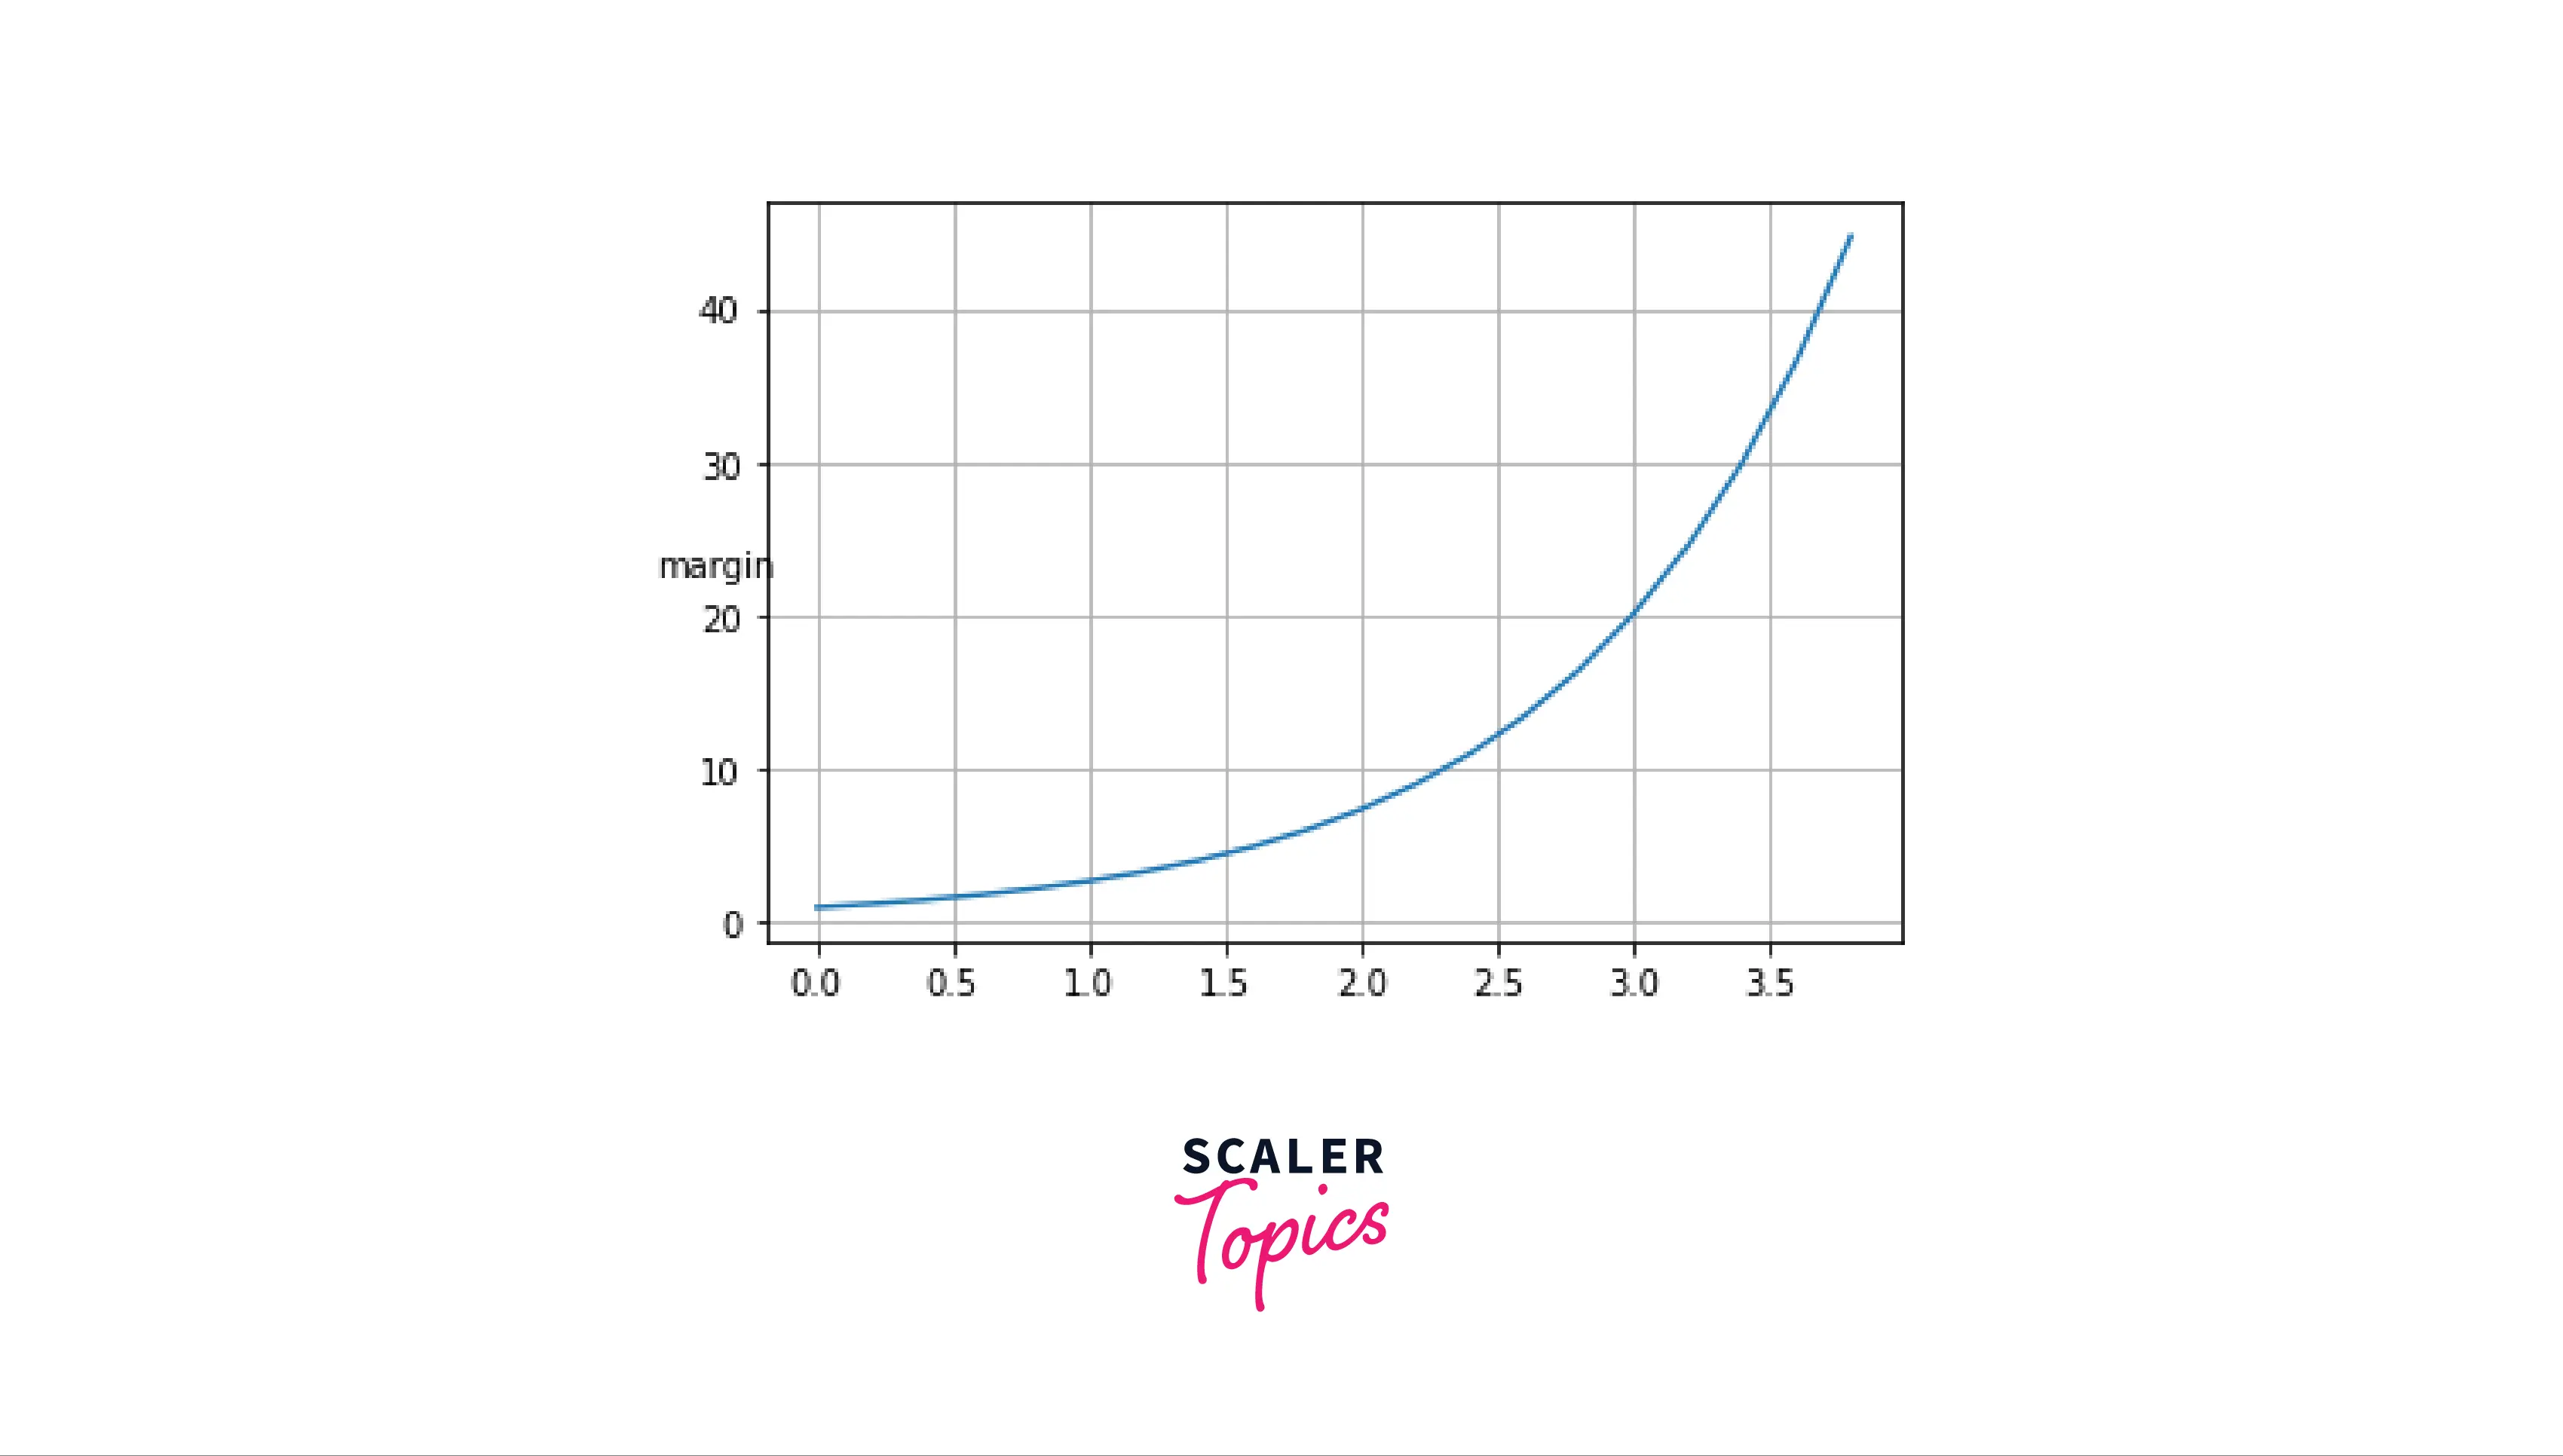
Setting texts in the margin
Output:
Scaler Placement Report and Statistics
Scaler learners achieved 2.5x salary growth with average post-Scaler CTC reaching ₹23L.
Conclusion
- This article covered different ways to write texts on our plots.
- Apart from that, we understood various methods to change the style of our matplotlib text in the plot.
- We learned how to create multi-line texts in our plots.
- We also looked at examples in which we wrote a text on the margins of our plots, etc.