How to add Arrows on a Figure in Matplotlib
Overview
Matplotlib provides the modules and function to add an arrow on a figure. There are two ways to do it: using the matplotlib.pyplot.arrow() function and the matplotlib.pyplot annotate() function. In both functions, we can change the appearance of the arrow like color, size, width, etc. The annotate() function has two types of arrows: simple and fancy. We will discuss examples to get a better understanding of the topic.
Introduction
Arrows and annotations are the best tools to point out things on a graph.matplotlib.pyplot.arrow() and matplotlib.pyplot.annotate function creates an arrow from one point to another in a graph. We can pinpoint the coordinates in the graph to make it more engaging. We can also customize the properties of an arrow, like color, width, etc.
Example: How arrow look in a plot
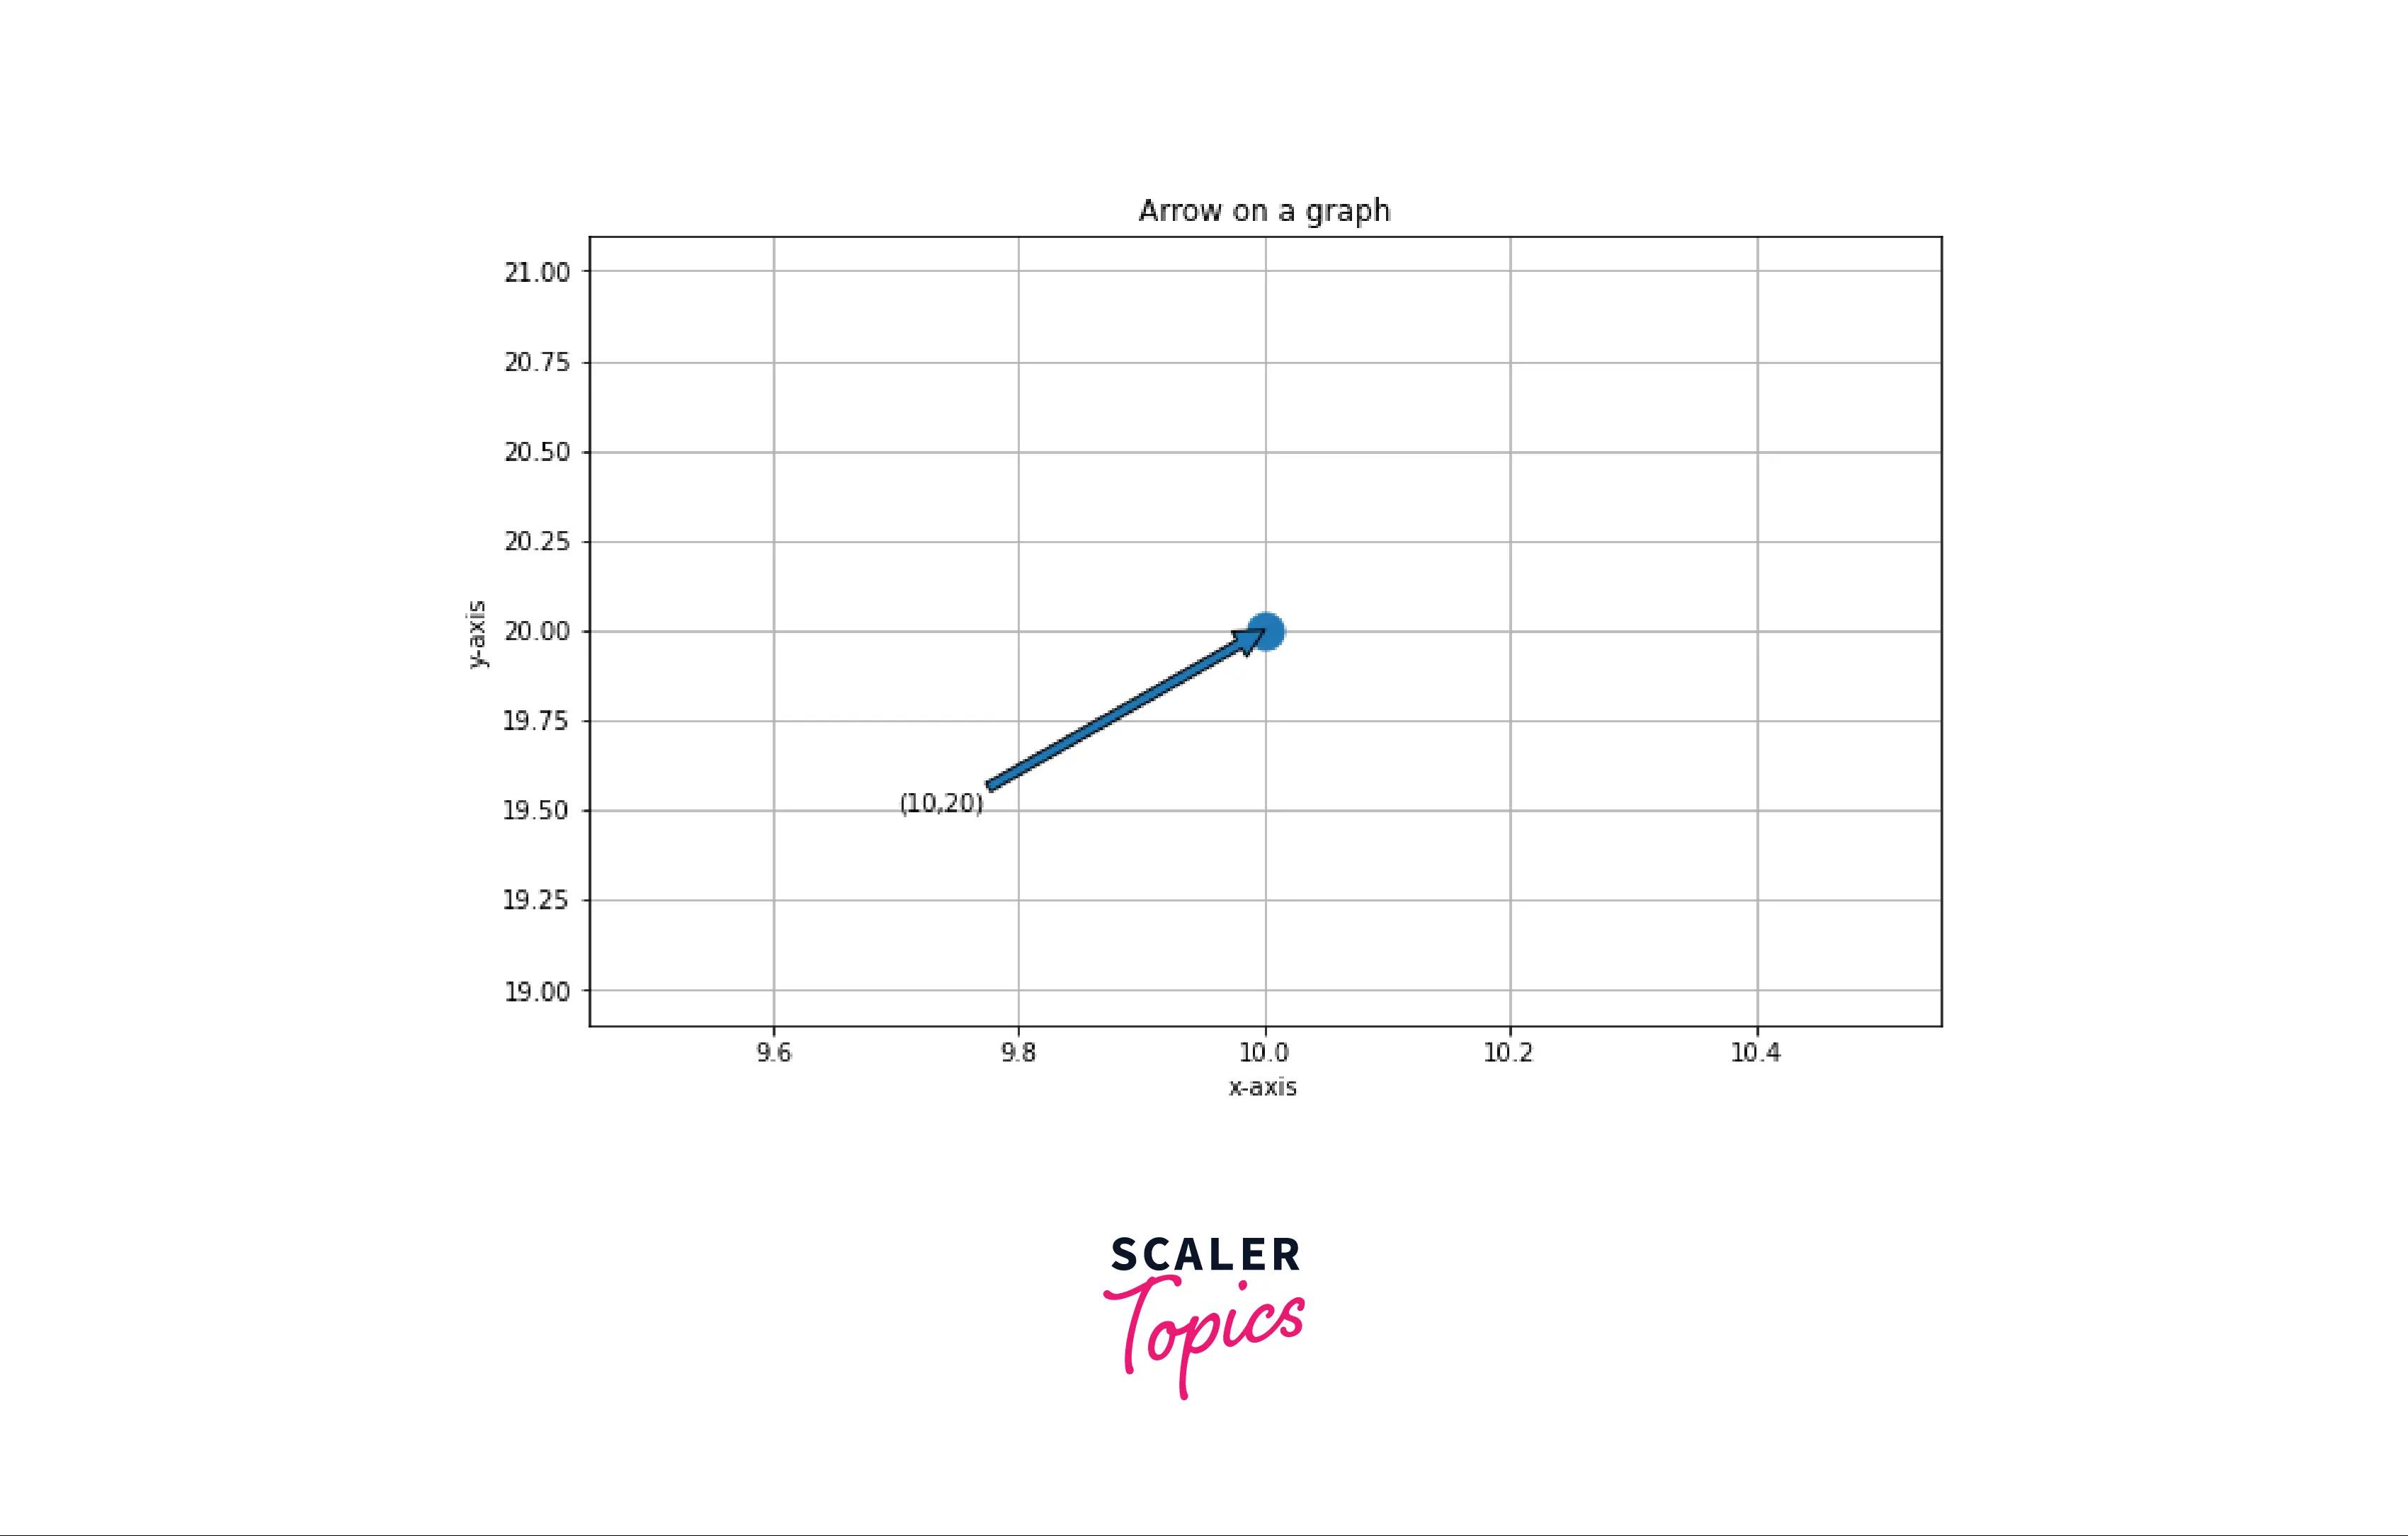
How to Add an Arrow in Matplotlib?
Arrow can be drawn on a graph either by using matplotlib.pyplot.arrow() function or by using matplotlib.pyplot.annotate() function. In the arrow function, we need at least four parameters x,y, dx, and dy to plot an arrow on a graph. In annotate function, we need the xy and xytext parameter to draw arrow in between them, the arrow tail is at xytext point along with the annotation, and the arrowhead is at xy point.
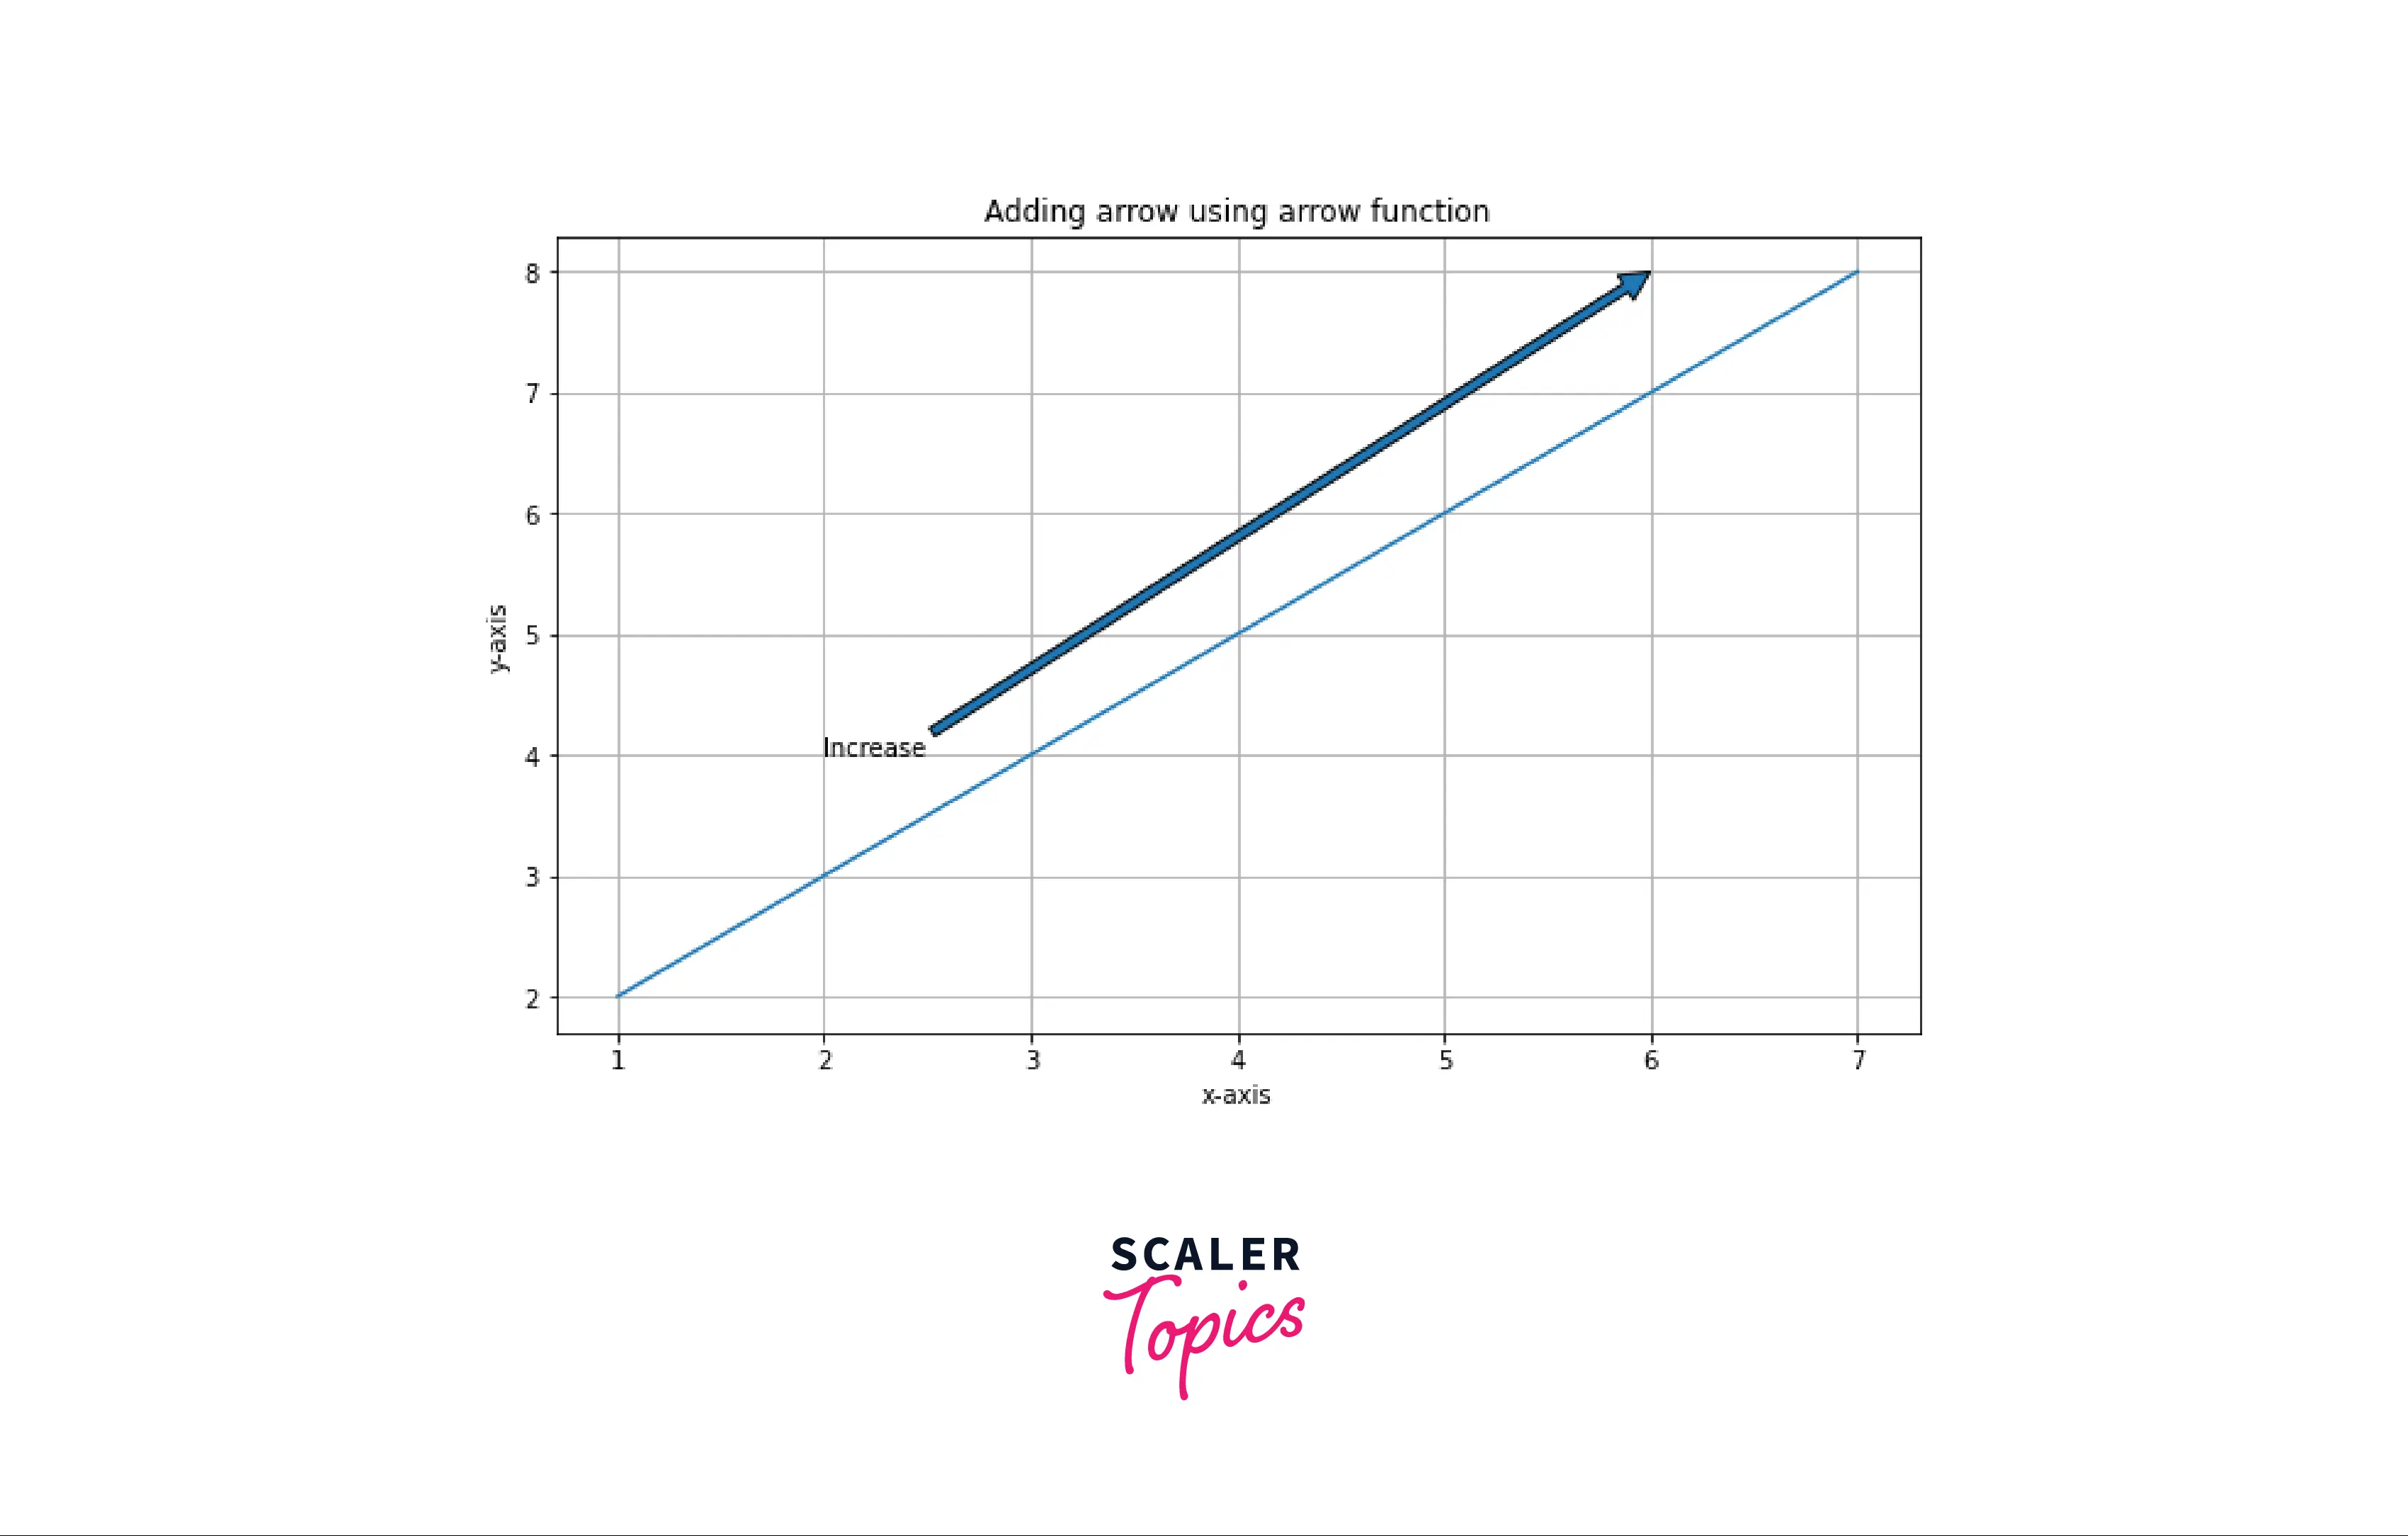
Example: Adding arrow in matplotlib using arrow function
Output:
![]()
Example: Adding arrow using annotate function
Output:
What is Arrow() Function in Matplotlib?
Arrow function in matplotlib returns an arrow from one point to another on a graph.
Transform Your Career
Choose from our industry-leading programs designed for career success
Modern Software and AI Engineering Program
Master full-stack development with AI integration

Modern Data Science and ML with specialisation in AI
Advanced data science techniques with AI specialization
Advanced AIML with Specialisation in Agentic AI
Deep dive into AIML with focus on Agentic systems
DevOps, Cloud & AI Platform Engineering
Build and manage AI-powered cloud infrastructure
AI Engineering Advanced Certification by IIT-Roorkee
Premier AI engineering certification from IIT-Roorkee
Syntax of Matplotlib Arrow() in Python
matplotlib.pyplot.arrow(x, y, dx, dy, kwargs)
Parameters:
| Parameters | Datatype and default value | Description |
|---|---|---|
| x, y | float | coordinates of the arrow base |
| dx, dy | float | Length of arrow along x and y direction |
| width | float, default: 0.001 | width of full arrow tail |
| length_includes_head | bool, default: False | True if head is to be counted in calculating the length. |
| head_width | float or none, default: 3 * witdth | total width of the full arrow head |
| head_length | float or none, default: 1.5 * head_width | lenght of arrow head |
| shape | {'full', 'left', 'right'}, default: 'full' | Draw the left-half, right-half or full arrow |
| overhang | float, default: 0 | fraction that the arrow is swept back. Can be negative or greater than one |
| head_starts_at zero | bool, default: False | If True, the arrow head starts being drawn at coordinate 0 instead of ending at coordinate 0. |
Arrow Styling Using Matplotlib Arrow()
We can also change the visual properties of the arrow like color, width, edgecolor, etc.
Example: Changing arrow properties We can also change Arrow properties like color, width, and edgewidth.
Output:
![]()
What is Annotate() Function in Matplotlib?
Annotate means to mark or label something. When we plot a graph in matplotlib, to make the graph more engaging, we need to annotate the graph with text and arrows. This can be done using the function matplotlib.pyplot.annotate(). We will discuss how to add an arrow to a graph using annotate function.
Turn Learning into Career Growth
Syntax of Matplotlib Annotate() in Python
matplotlib.pyplot.annotate(text, xy, *args, kwargs)
Parameters:
| Parameters | Datatype and default value | Description |
|---|---|---|
| text | string | text of the annotation |
| xy | tuple (float, float) | the point (x,y) to annotate. ** xycoords determine the coordinate system** |
| xytext | tuple (float,float), defaul: xy | position of the text. The coordinate system is determind by textcoords |
| xycoords: | str or Artist or Transform or callable or (float, float), default: 'data'. | Desciption: The coordinate system that xy is given in. The following types of values are supported: {'figure points','figure pixels','figure fraction','subfigure points','subfigure pixels','subfigure fraction','axes pixels','axes fraction','data','polar'} |
| textcoords | str or Artist or Transform or callable or (float, float), default: value of xycoords | The coordinate system that xytext is given in. All xycoords values are valid as well as the following strings: {'offset points','offset pixels',} |
| annotation_clip | bool or None, default: none | whether to draw the annotation when the annotation point xy is outside the axes area |
| kwargs | N/A | additional keyword arguments are passed to text |
| arrowprops | dict | it is used to draw a FancyArrowPatch betweeen xy and xytext |
Adding a Simple Arrow
If arrowprops does not contain the key 'arrowstyle', then the allowed keys are:
- width: width of the arrow
- headwidth: width of the arrow head
- headlength: length of the arrow head
- shrink: fraction of total length to shrink from both ends
Example: Simple arrow
Output:
![]()
Adding Arrow Using Fancy Arrow Patch
This is used when the 'arrowstyle' key is passed in the arrowprops. Parameters in FancyArrowPatch.
- posA, posB: arrow tail and head position, respectively.
- path: Arrow drawn along the path and shrinkA, shrinkB, patchA, and patchB are ignored.
- arrowstyle: It is used for the arrow type like curve '-', curveA '<-', curveB '->', curveAB '<->', curveFilledA '<|-', curveFilledB '-|>', curveFilledAB '<|-|>', BracketA ']-', BracketB '-[', BracketAB ']-[', etc.
- Connectionstyle: It changes how the arrow is connected like Arc3, Angle3, Angle, Arc, etc.
- ShrinkA, shrinkB: Shrinking factor of head and tail(fraction of total length to shrink from both ends).
Example: Arrow using Fancy Arrow Patch
Output:
![]()
Adding Annotations to Arrows
To annotate an arrow means adding text with the arrow at the specified coordinate. Therefore, we can either use annotate() to add arrow with annotation or arrow() function along with annotate() function for adding the annotation to arrows.
Example: Adding an annotation to arrows
Output:
![]()
Examples
Example: Draw a single arrow
Output:
![]()
Example: Horizontal arrow A horizontal arrow can be plotted by passing the parameter dy=0.
Output:
![]()
Example: Vertical arrow A vertical arrow can be plotted by passing the parameter dx=0.
Output:
![]()
Example: Multiple arrows on the same plot We can also add multiple arrow on the same plot by calling the arrow() function multiple times.
Output:
![]()
Example: Plot with annotate function
Output:

Conclusion
- Arrow in matplotlib can be drawn using two functions: matplotlib.pyplot.arrow() and second by using matplotlib.pyplot.annotate() function.
- Both functions provide a wide variety of parameters to change the visual properties of the arrow.
- In the arrow() function, we can change an arrow's properties like color, size, width, etc.
- In the annotate() function, we can change an arrow's shape, head, color, path, etc.