Colormaps in Matplotlib
Overview
One of the most popular Python packages for data visualization is Matplotlib. There are a lot of features in matplotlib that catch our eye, but when it comes to visualizing data, colormaps have to be at the top of the list.
With the help of colormaps, we can categorize and segregate data in a much more efficient manner. This allows us to make informed decisions easily.
Introduction
We require different colormaps to visualize the 3D plot and develop certain 3D parameter intuitions. According to science, the human brain derives diverse intuitions from the varied colors it sees.
Sequential colormaps, Diverging colormaps, Cyclic colormaps, and Qualitative colormaps are just a few of the wonderful colormaps offered by Matplotlib.
In this article, we will go over the basics of colormaps, accessing and retrieving data from colormaps, and different types and ways of adding colormaps to our plots.
Need for Colormaps
For any type of plot or visualization, colormaps are helpful. For example, we will can a hex bin plot or scatter plot to display the various distributions as distinct matrices to personalize the colormap. Colormaps allow us to diversify our data, allowing us to make more informed decisions.
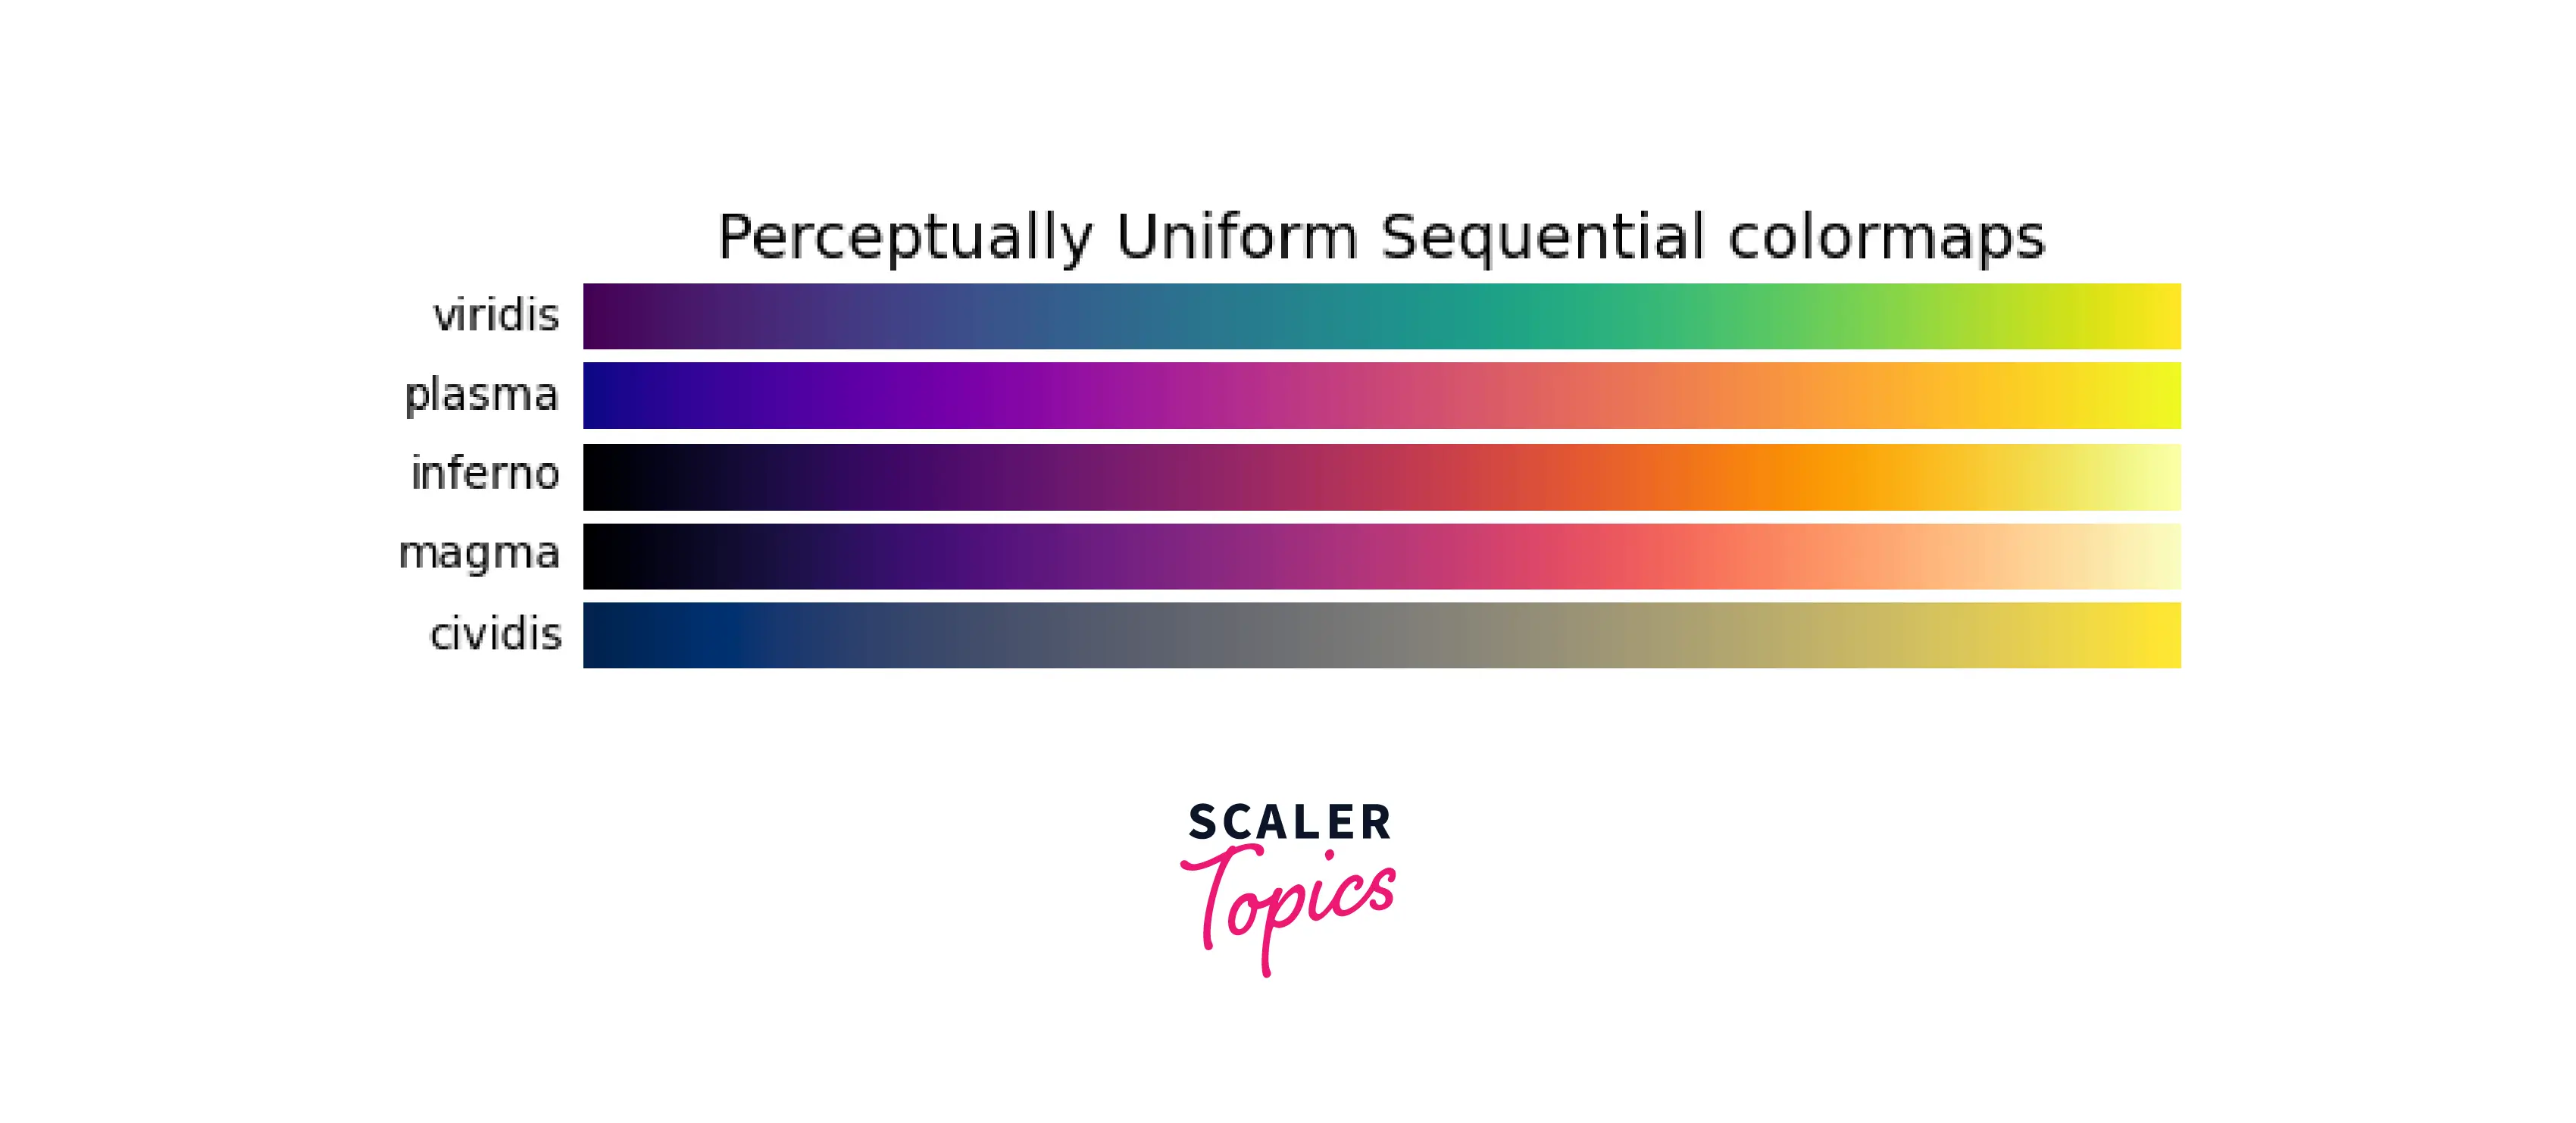
Here's a sample colormap that Matplotlib provides:

We can also create our own colormaps in matplotlib. We can achieve this in two ways: combining two Sequential colormaps, or we can choose and combine our favorite color in RGB (Red, Blue, Green) to create colormaps.
Because the human mind represents colors differently, choosing the appropriate hue for your colormaps is crucial. Color is a way to convey thoughts, concepts, and feelings. If someone wants to use their own color combinations as colormaps, they can also do that. Hence, colormaps open a plethora of options for its users in Matplotlib.
Getting and Accessing the values from Colormaps
Matplotlib contains definitions for several colormaps. In addition, a distinctive name has been given to each colormap. We can access these distinctive names using the get_cmap() function in matplotlib.
Syntax
Parameters
name: The name of the colormap in a string format. Its default value is "viridis". lut: If lut isn’t None, it should be an integer that specifies the number of colors in the list used to define the colormap.
Output:

As you can see, we can display the default value for color maps; (Viridis). There are several colormaps in matplotlib such as florescent, lime, etc.
Different Types of Colormaps
In this article, we will cover the two most popular types of color maps: Listed Colormaps and Linearly Segmented Colormaps
Listed Colormaps
To create simple colormaps, we pass a NumPy array in the cmap() function as an argument and then use a type like Viridis. However, in Listed Colormaps, we do the opposite. Instead, we provide an Nx4 numpy array with all the values between 0 and 1.
This makes building new colormaps from existing colormaps relatively simple as we can perform any NumPy operations on an Nx4 array. We'll understand this in a better way with an example:
Explanation
To create our colormap, we need to define its properties first. Hence, we create arrays that define a color scheme, and we implement that in our Viridis colormap. After setting up our parameters, we will create a function called plot_examples(), which will help us to create subplots, in which we will implement our newly created ListedColorMaps
Output:

Linear Segmented Colormaps
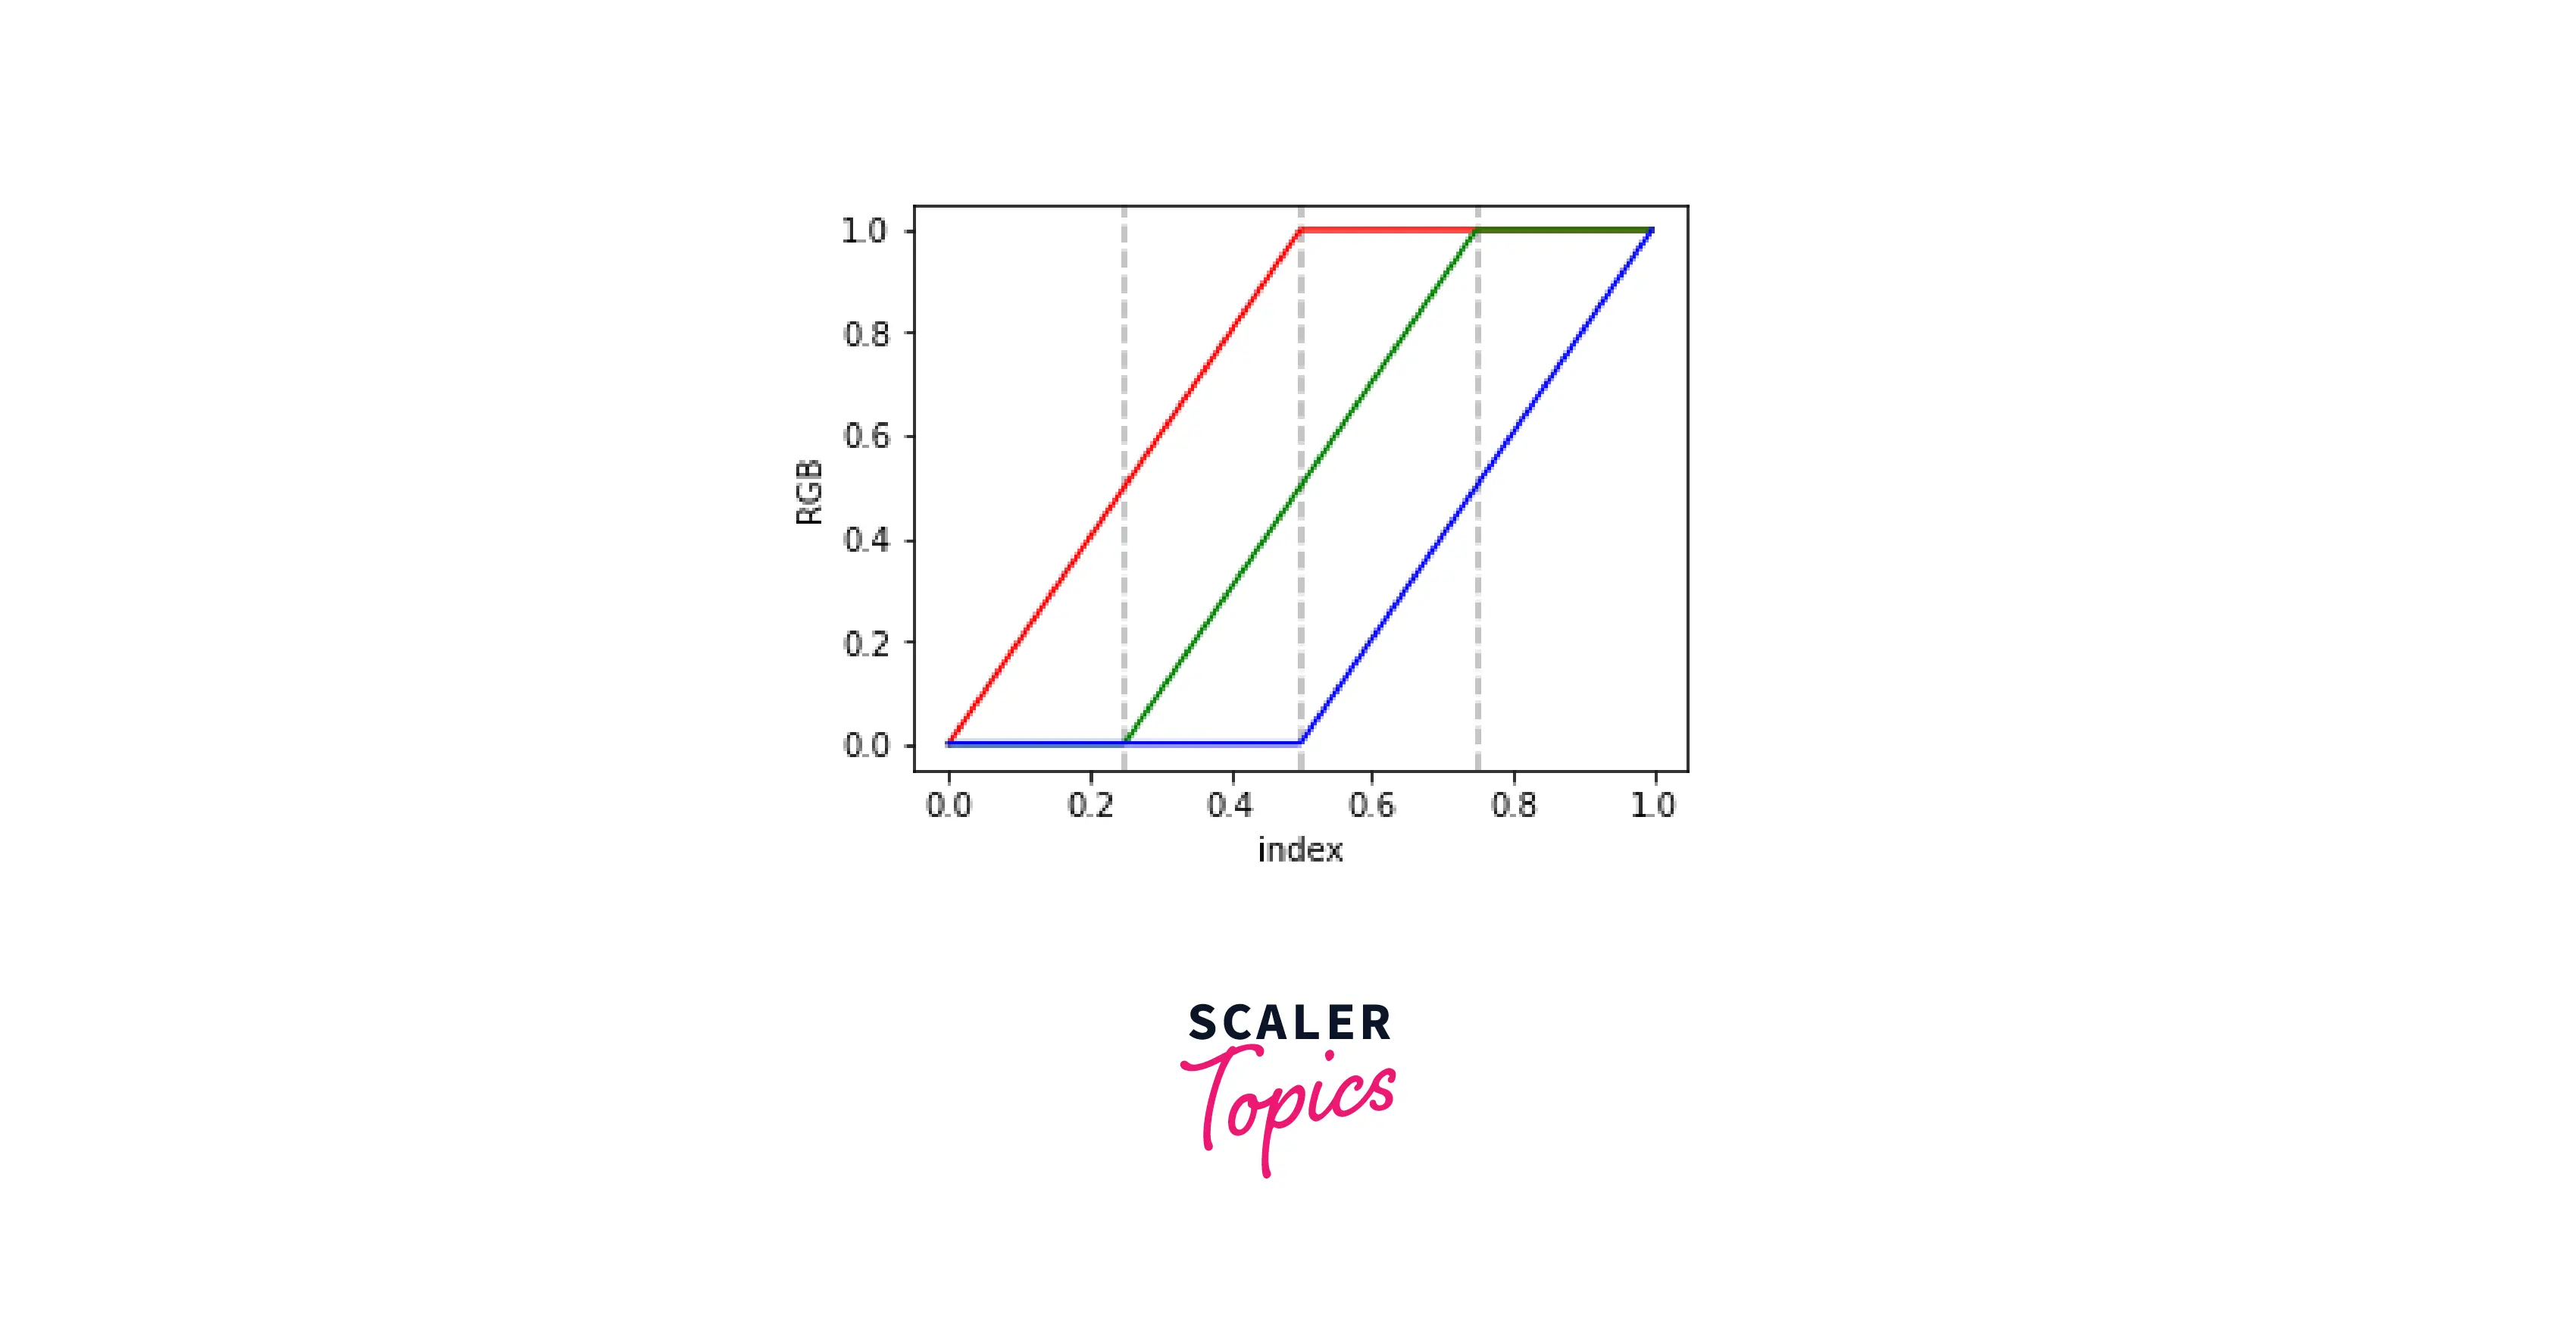
Linear Segmented Colormaps is a class in the matplotlib.colors library that uses anchor points (specific points in a dictionary format) that range the RGB values. These values are later interpolated(estimated).
The format used to express these colormaps allows discontinuities at the anchor points. Each anchor point is listed as a row in a matrix of the form [a[i] aleft[i] aright[i]] where a[i] is the anchor (reference point) and aleft[i] and aright[i] are the colors on either side of the anchor point.
Explanation
After importing the necessary libraries, we create the dictionary that will be used later to create our Linear Segmented Colormap. You can notice that the pattern of our dictionary is something like this:
This is done to achieve the plot's different red, blue and green lines. After creating the dictionary, we create a function plot_linearmap() that helps us to use the dictionary as a parameter to plot our graph.
Output:

How to Add Color Maps in Matplotlib
There are many built-in colormaps available in the matplotlib package. Imagine that you want to modify colormaps or make your own. If so, you can use either the LinearSegmentedColormap class or the ListedColormap class from the matplotlib library. There are many built-in colormaps available in the matplotlib package. Again, imagine that you want to modify colormaps or make your own. If so, you can use either the LinearSegmentedColormap class or the ListedColormap class from the matplotlib library.
There are two ways of adding colormaps to our plots in matplotlib: using the get_cmap() function and the colors attribute of the ListedColorMap object.
get_cmap() function
In matplotlib, various colormaps are defined and can be accessed using a unique name. These names can be accessed using the get_cmap() function in the colormaps module in matplotlib.
Syntax
Parameters
name: Accepts the name of the colormap that we want to use. Its default value is None.
lut: The number of colors in the list used to define the colormap is indicated by an integer.
Explanation
After importing the important libraries, we use the get_cmap() function to get the type of colormap we want (plasma in this example). The parameter 8 shows the number of colormap's divisions based on under, bad, and over.
Output:

Using 'colors' Attribute of ListedColorMap Object
To create a custom version of the Listed Color Map, we can use the colors attribute of the ListedColorMap object.
Syntax
Parameters
name: Accepts the name of the colormap that we want to use. Its default value is None. lut: The number of colors in the list used to define the colormap is indicated by an integer.
Explanation
After importing the important libraries, we use the get_cmap() function to get the type of colormap we want (plasma in this example). After getting our color map, we will print the values set in the colors attribute.
Output:
Conclusion
- In this article, we understood what colormaps are; a feature in matplotlib that allows us to diversify our data regarding patterns and color schemes.
- Apart from this, we understood the need for colormaps, and how they help us make informed decisions.
- We understood different ways of accessing and getting values from colormaps using the get_cmap()
- Two types of colormaps were discussed in detail: Listed Colormaps and Linear Segmented Colormaps.
- To conclude, we learned different ways of adding colormaps: using the get_cmap() function and the colors attribute of the ListedColorMap Object.
