What are | Contour Plots?
Overview
Matplotlib provides the module and functions to create a contour plot. For 2D contour plot in matplotlib we can use matplotlib.pyplot.contour() and matplotlib.pyplot.contourf() (filled contour) and function for 3D contour plot is matplotlib.pyplot.contour3D(). There are various arguments in the function to change the visual appearance of the contour plot in matplotlib, like levels, colors, line width, blending value, etc.
Introduction
A contour plot is a graphical technique for representing a 3-D surface by plotting constant slices, called contour, in a 2-D format. For example, contours in matplotlib are represented by a contour plot which consists of an X-Y plane and matrix Z as height to the plane. In addition, a contour plot displays the matrix's isoline. Isolines are curves where a function of two variables has the same value or lines that connect points of equal elevation.
Need for Contour Plots
Contour plots are widely used in cartography, where contour lines on a topological map indicate the same elevations. Isolines (contour lines) represent a region's shape on a two-dimensional map. The contour lines are joined at equal elevation, which helps us visualize elevation on the ground. Contour plots can also be used to study the terrain's geography, which helps show the elevations.
Different Types of Contour Plots
In matplotlib, we can visualize the contour plots in 2D and 3D. In 2D, we cannot comprehend the height. To visualize the contour plot in the 2D plane, the third dimension or height is converted to contours of colors and lines. In 3D contour plot can be easily visualized because of the third dimension (Z)
Transform Your Career
Choose from our industry-leading programs designed for career success
Modern Software and AI Engineering Program
Master full-stack development with AI integration

Modern Data Science and ML with specialisation in AI
Advanced data science techniques with AI specialization
Advanced AIML with Specialisation in Agentic AI
Deep dive into AIML with focus on Agentic systems
DevOps, Cloud & AI Platform Engineering
Build and manage AI-powered cloud infrastructure
AI Engineering Advanced Certification by IIT-Roorkee
Premier AI engineering certification from IIT-Roorkee
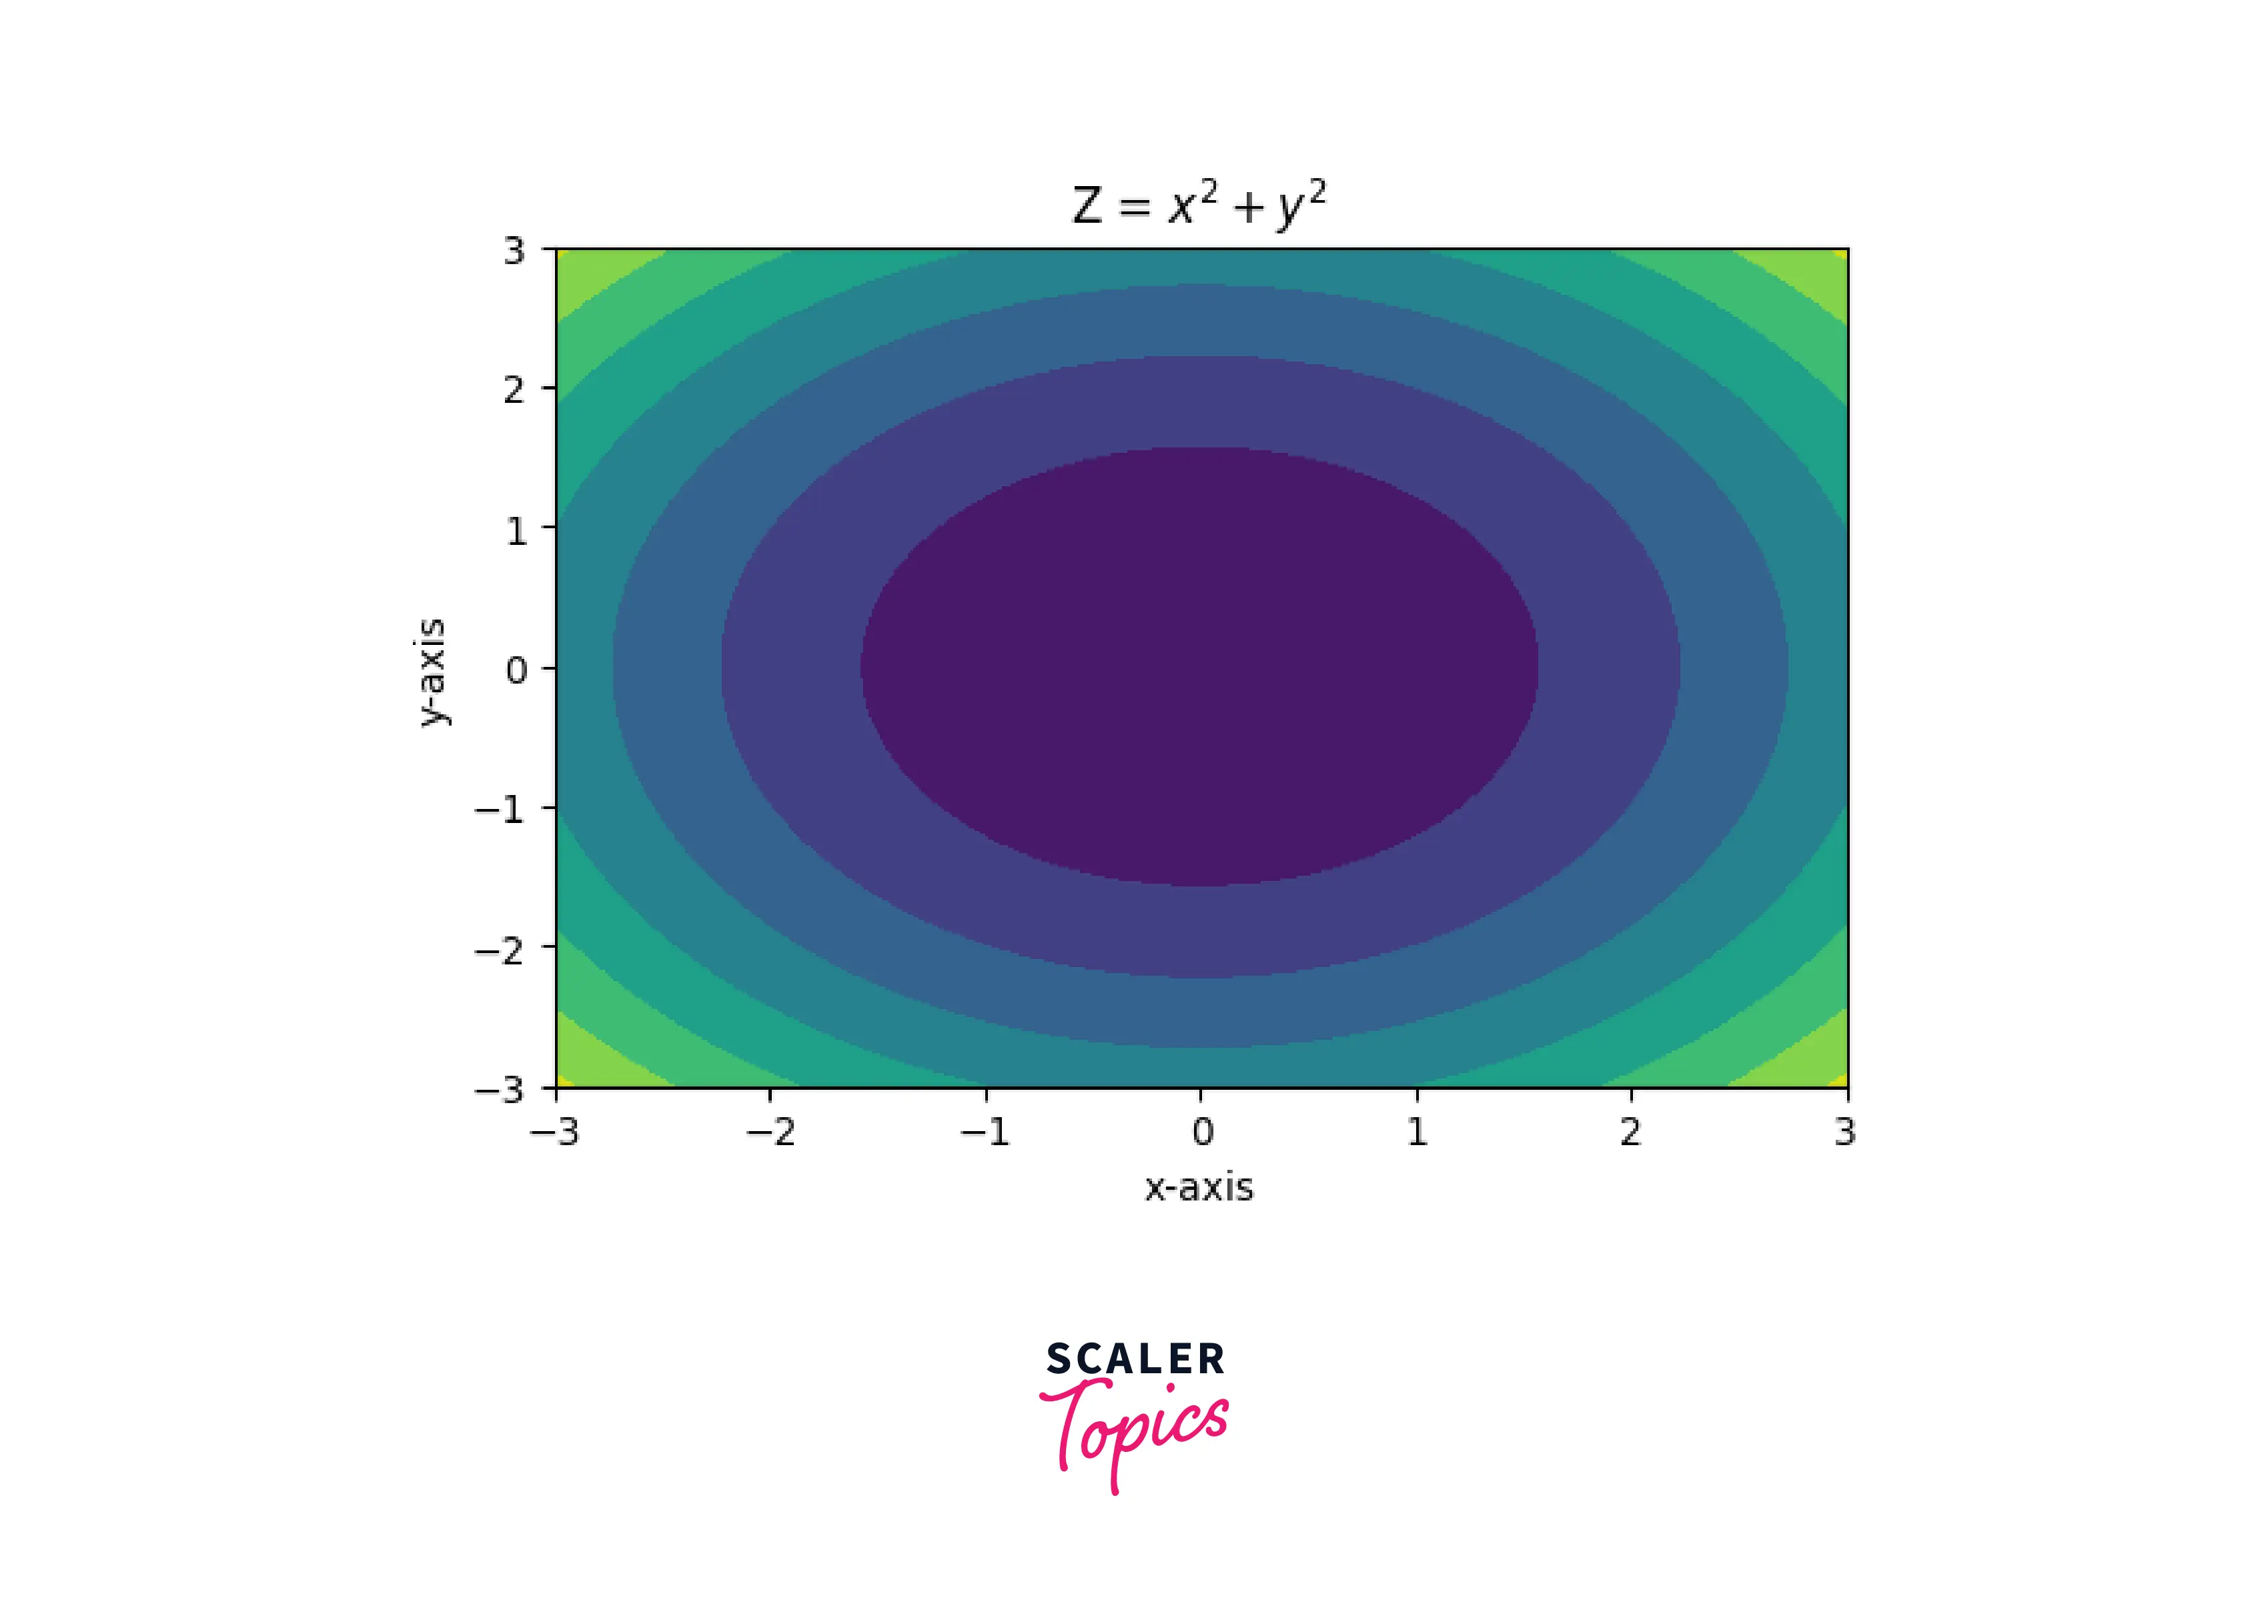
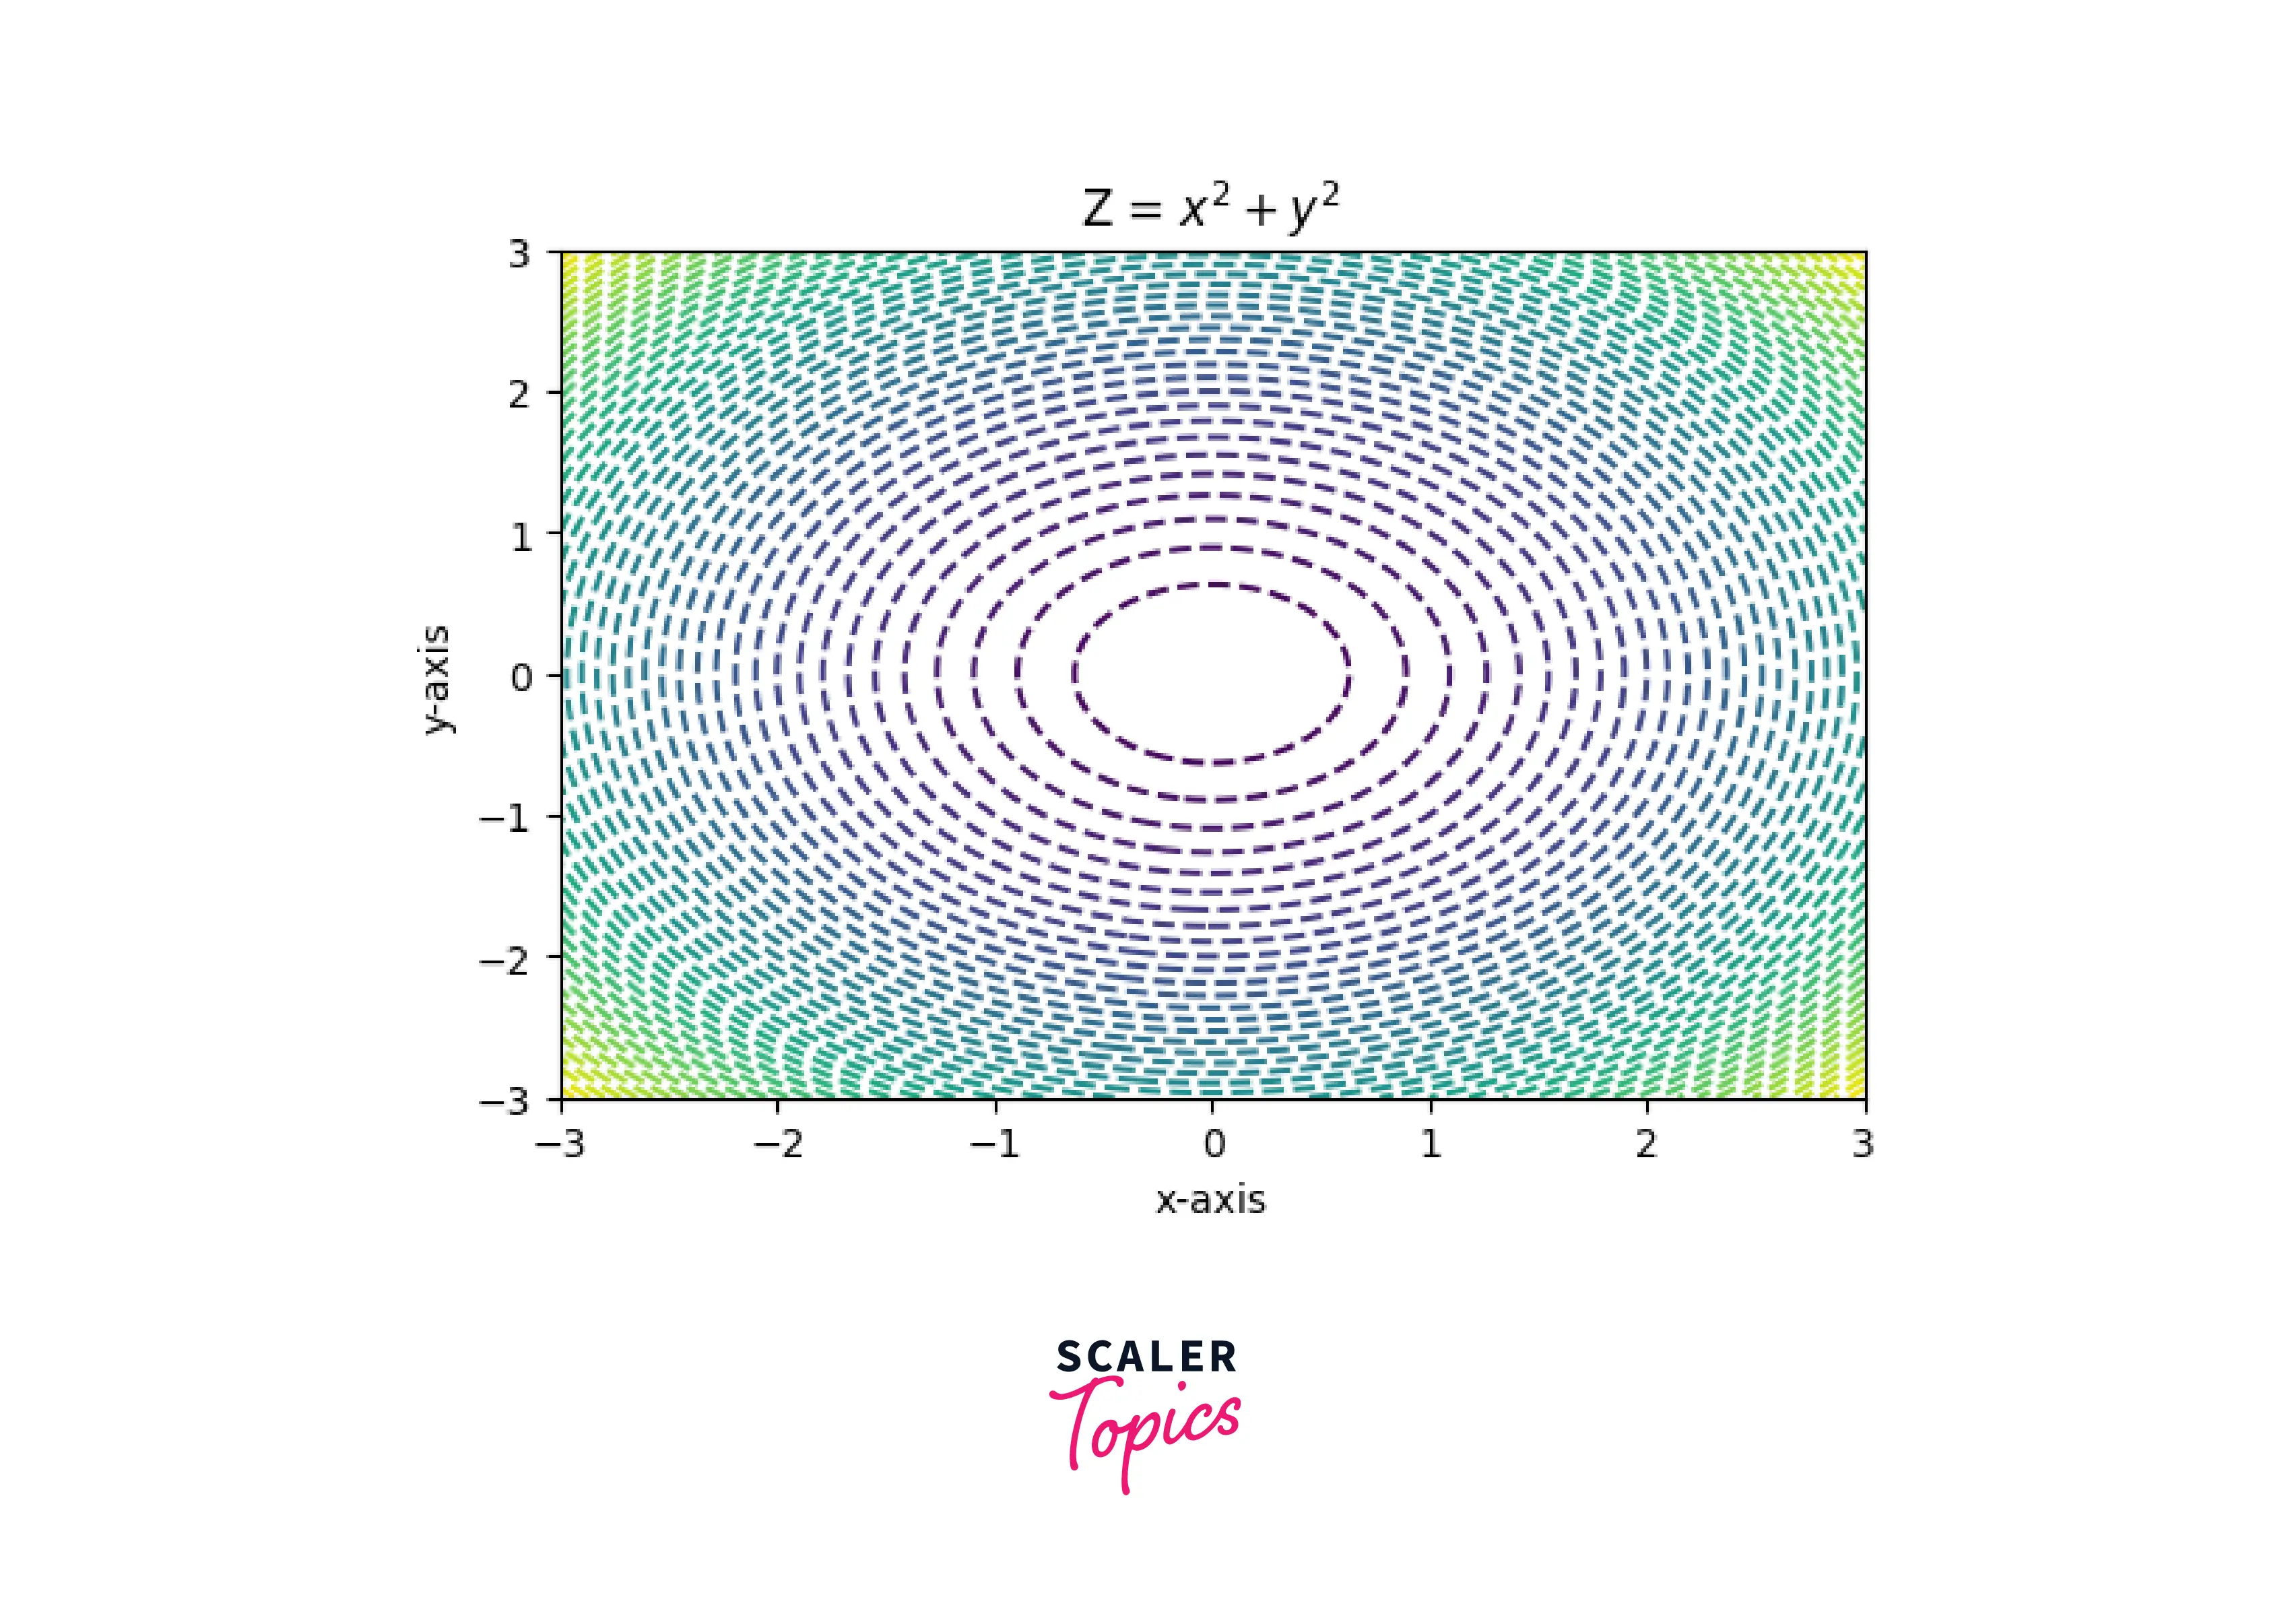
2D
Here is the plot of the function Z= x^2 + y^2 on the plane. We can see that color lines represent the elevation (3rd dimension).
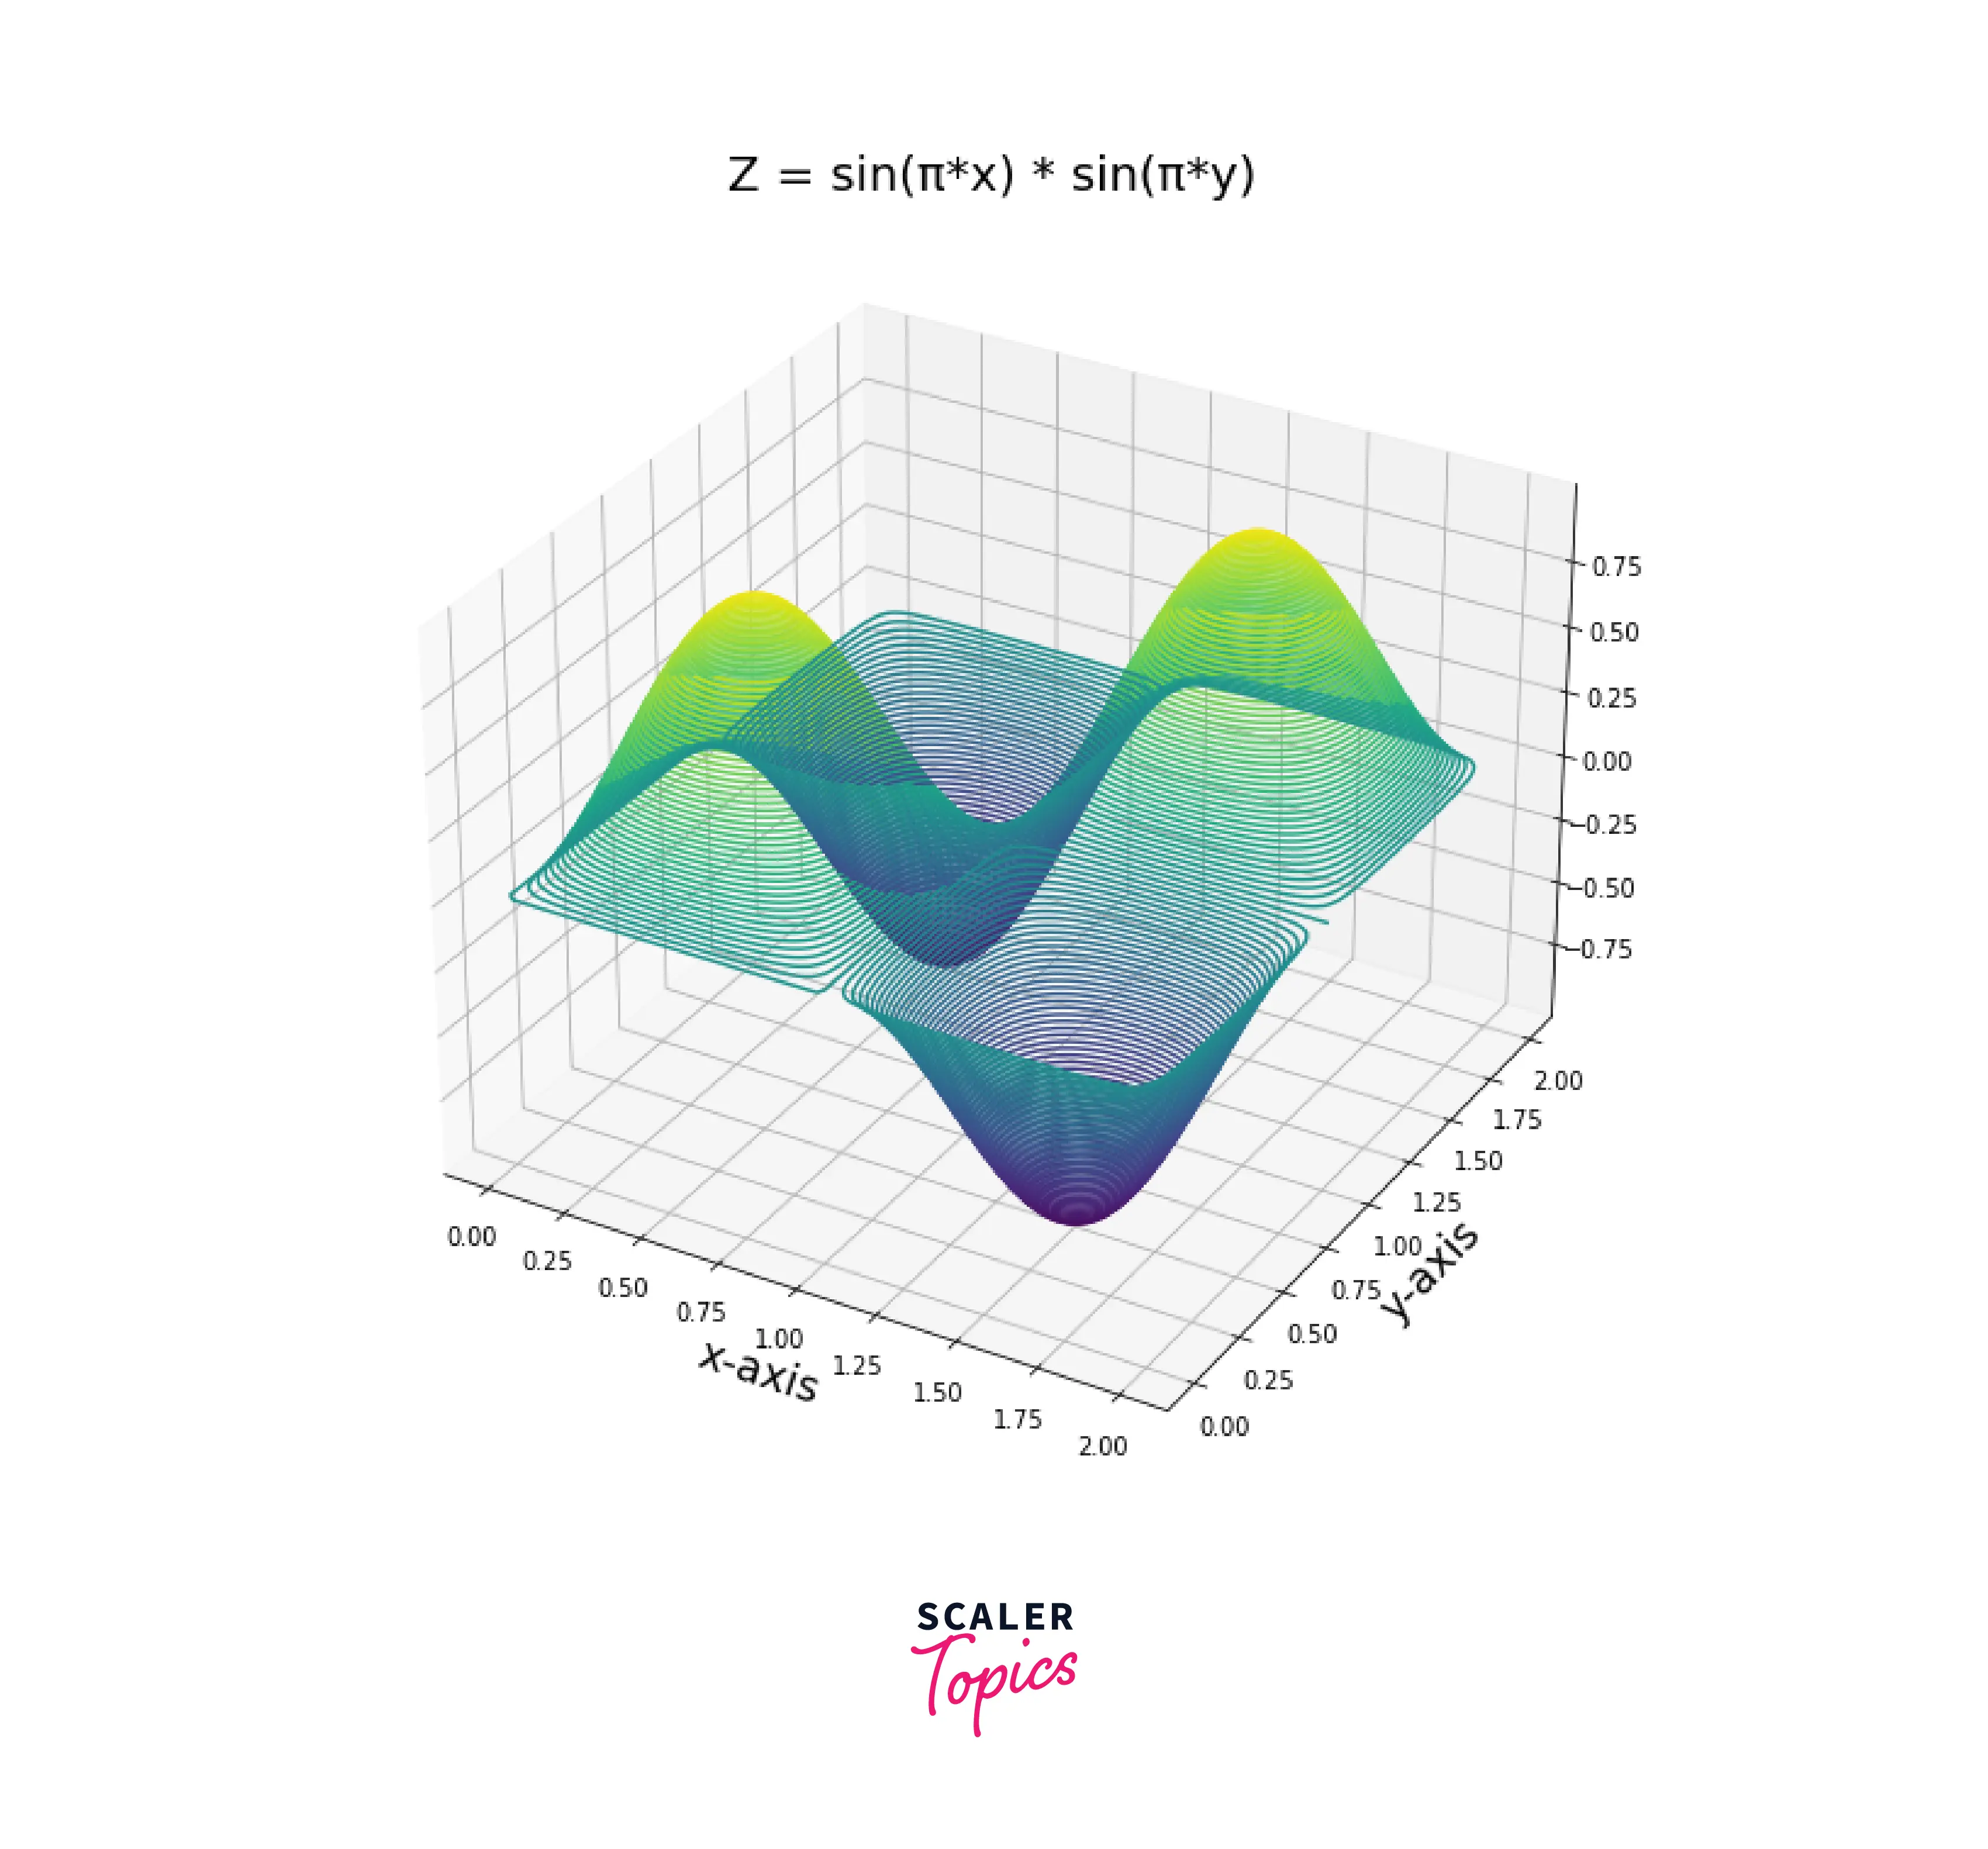
3D
Here is the plot of the function Z= x^2 + y^2 in 3D. We can see that the contour lines represent the elevation in the plot.

How to Use Contour Plot in Matplotlib
Syntax
Parameters
| Parameters | Description |
|---|---|
| X, Y: | Datatype: array, optional parameter. The coordinates of the values in Z. X and Y must be 2D with the same shape as Z (created via numpy.meshgrid() |
| Z: | Datatype: array. The height values over which the contour is drawn. |
| levels: | Datatype: int or array, optional parameter. Determines the number and position of the contour lines and regions. |
| alpha: | Datatype: float, default value is 1. It controls the transparency of the contour plot. |
| cmap: | Datatype: string, the default value 'viridis'. The colormap maps the level values to color. |
| norm: | Optional parameter.If a colormap is used, the Normalize instance scales the level values to the canonical colormap range [0, 1] for mapping to colors. If not given, the default linear scaling is used. |
| origin: | {None, 'upper', 'lower', 'image'}, the default value is none. It determines the orientation and exact position of Z by specifying the position Z[0,0]. |
| linewidths: | Datatype: float or array, the default value is none. It controls the linewidth of contour lines. |
| linestyle: | {None,'solid', 'dashed','dashdot','dotted'}, optional parameter. It changes the linestyle of the contour lines |
| colors: | color string or sequence of colors. The colors of the levels. The sequence is cycled for the levels in ascending order. If the sequence is shorter than the number of levels, it's repeated. |
Turn Learning into Career Growth
Customizing Contour Plots in Matplotlb
We can customize the contour plots in matplotlib. For example, we can change its visual properties like linestyle, line or filled contour, individual colors to color maps and increase the level in the contour plot, etc.
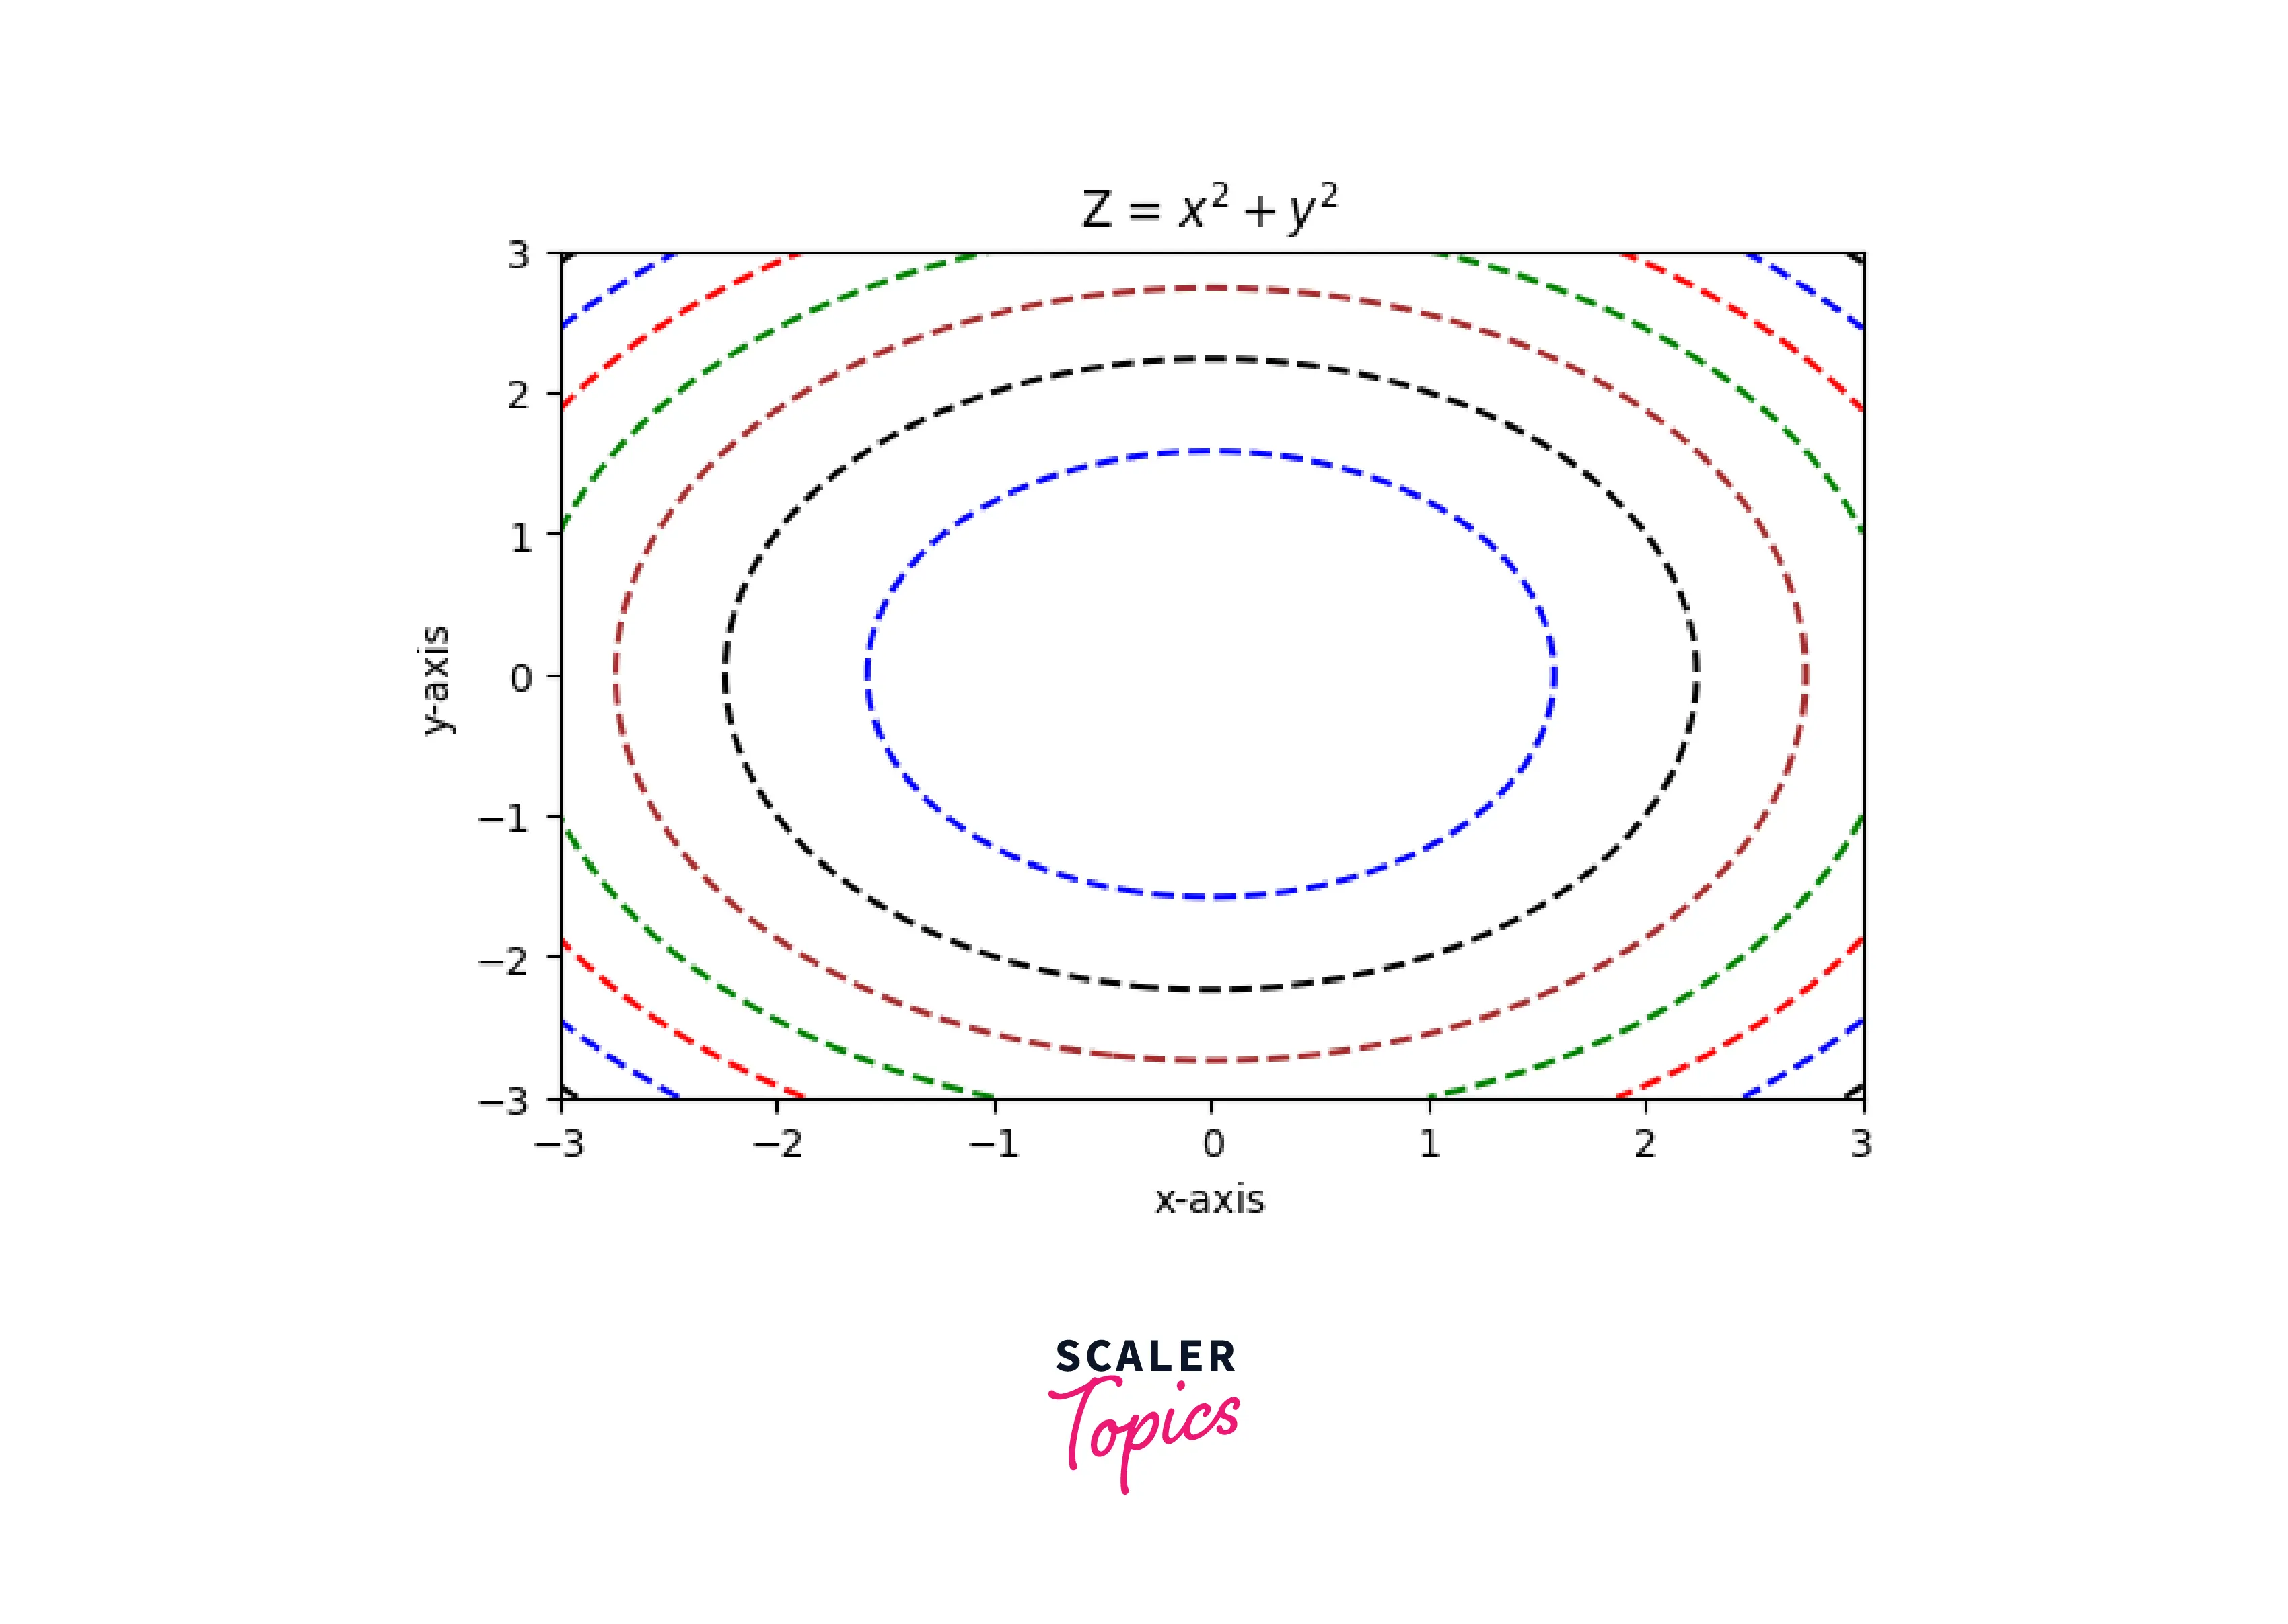
Changing the Colours and the Line Style
Using line styles parameter in the function matplotlib.pyplot.contour() we can change the line style of the contour lines and using the colors parameter in the same function, we can change the color of the contour line. Example: Contour plot in matplotlib with line style
Output:

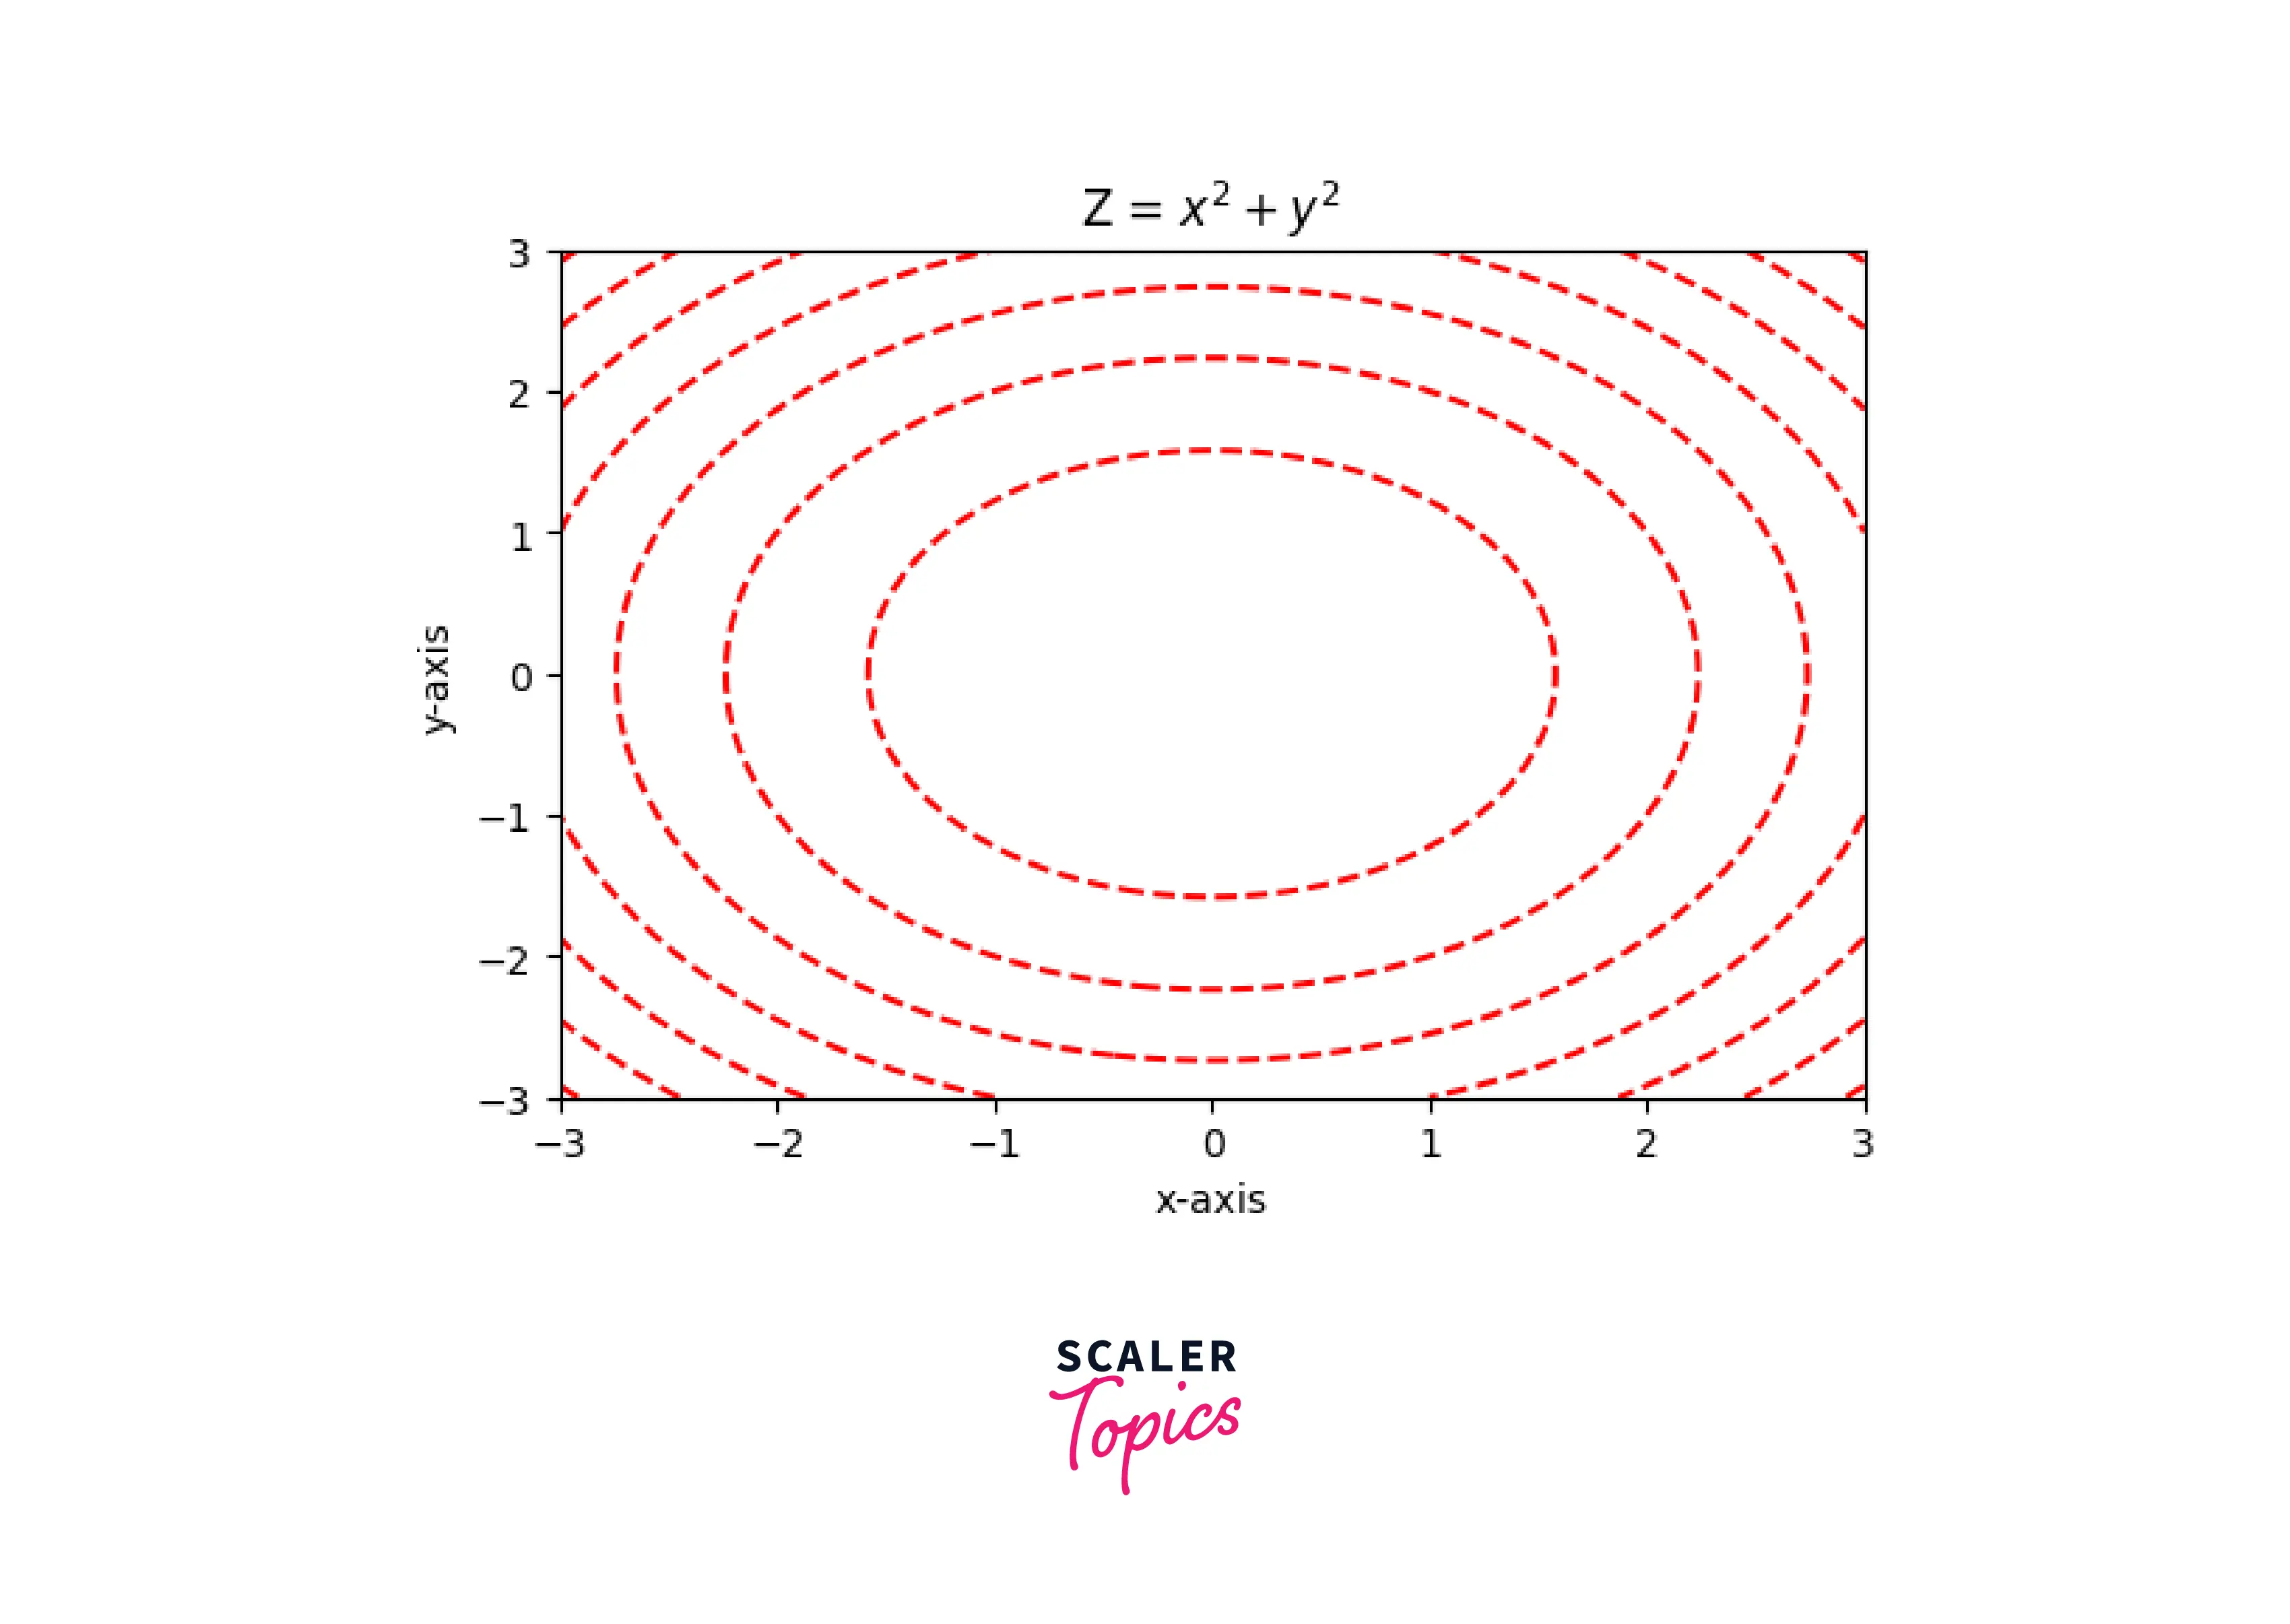
Example2: Coloring contour plot in matplotlib We can set a single color for the whole plot or pass an array of colors as a parameter in the function by which each contour line gets colored differently in ascending order of the colors.
Output:
Filled Contours
The function matplotlib.pyplot.contourf() is used to plot the filled contour plot in matplotlib. It has the same parameter as the contour() function, but it gives the filled contour plot
Output:

Individual Colours
To set the individual color of the contour plot in matplotlib, we must pass a single color as a parameter in the function.
Output:
Levels
This parameter determines the number of contour lines in a plot higher the value means greater the number of contour lines.
Example: Contour plot without levels parameter
Output:
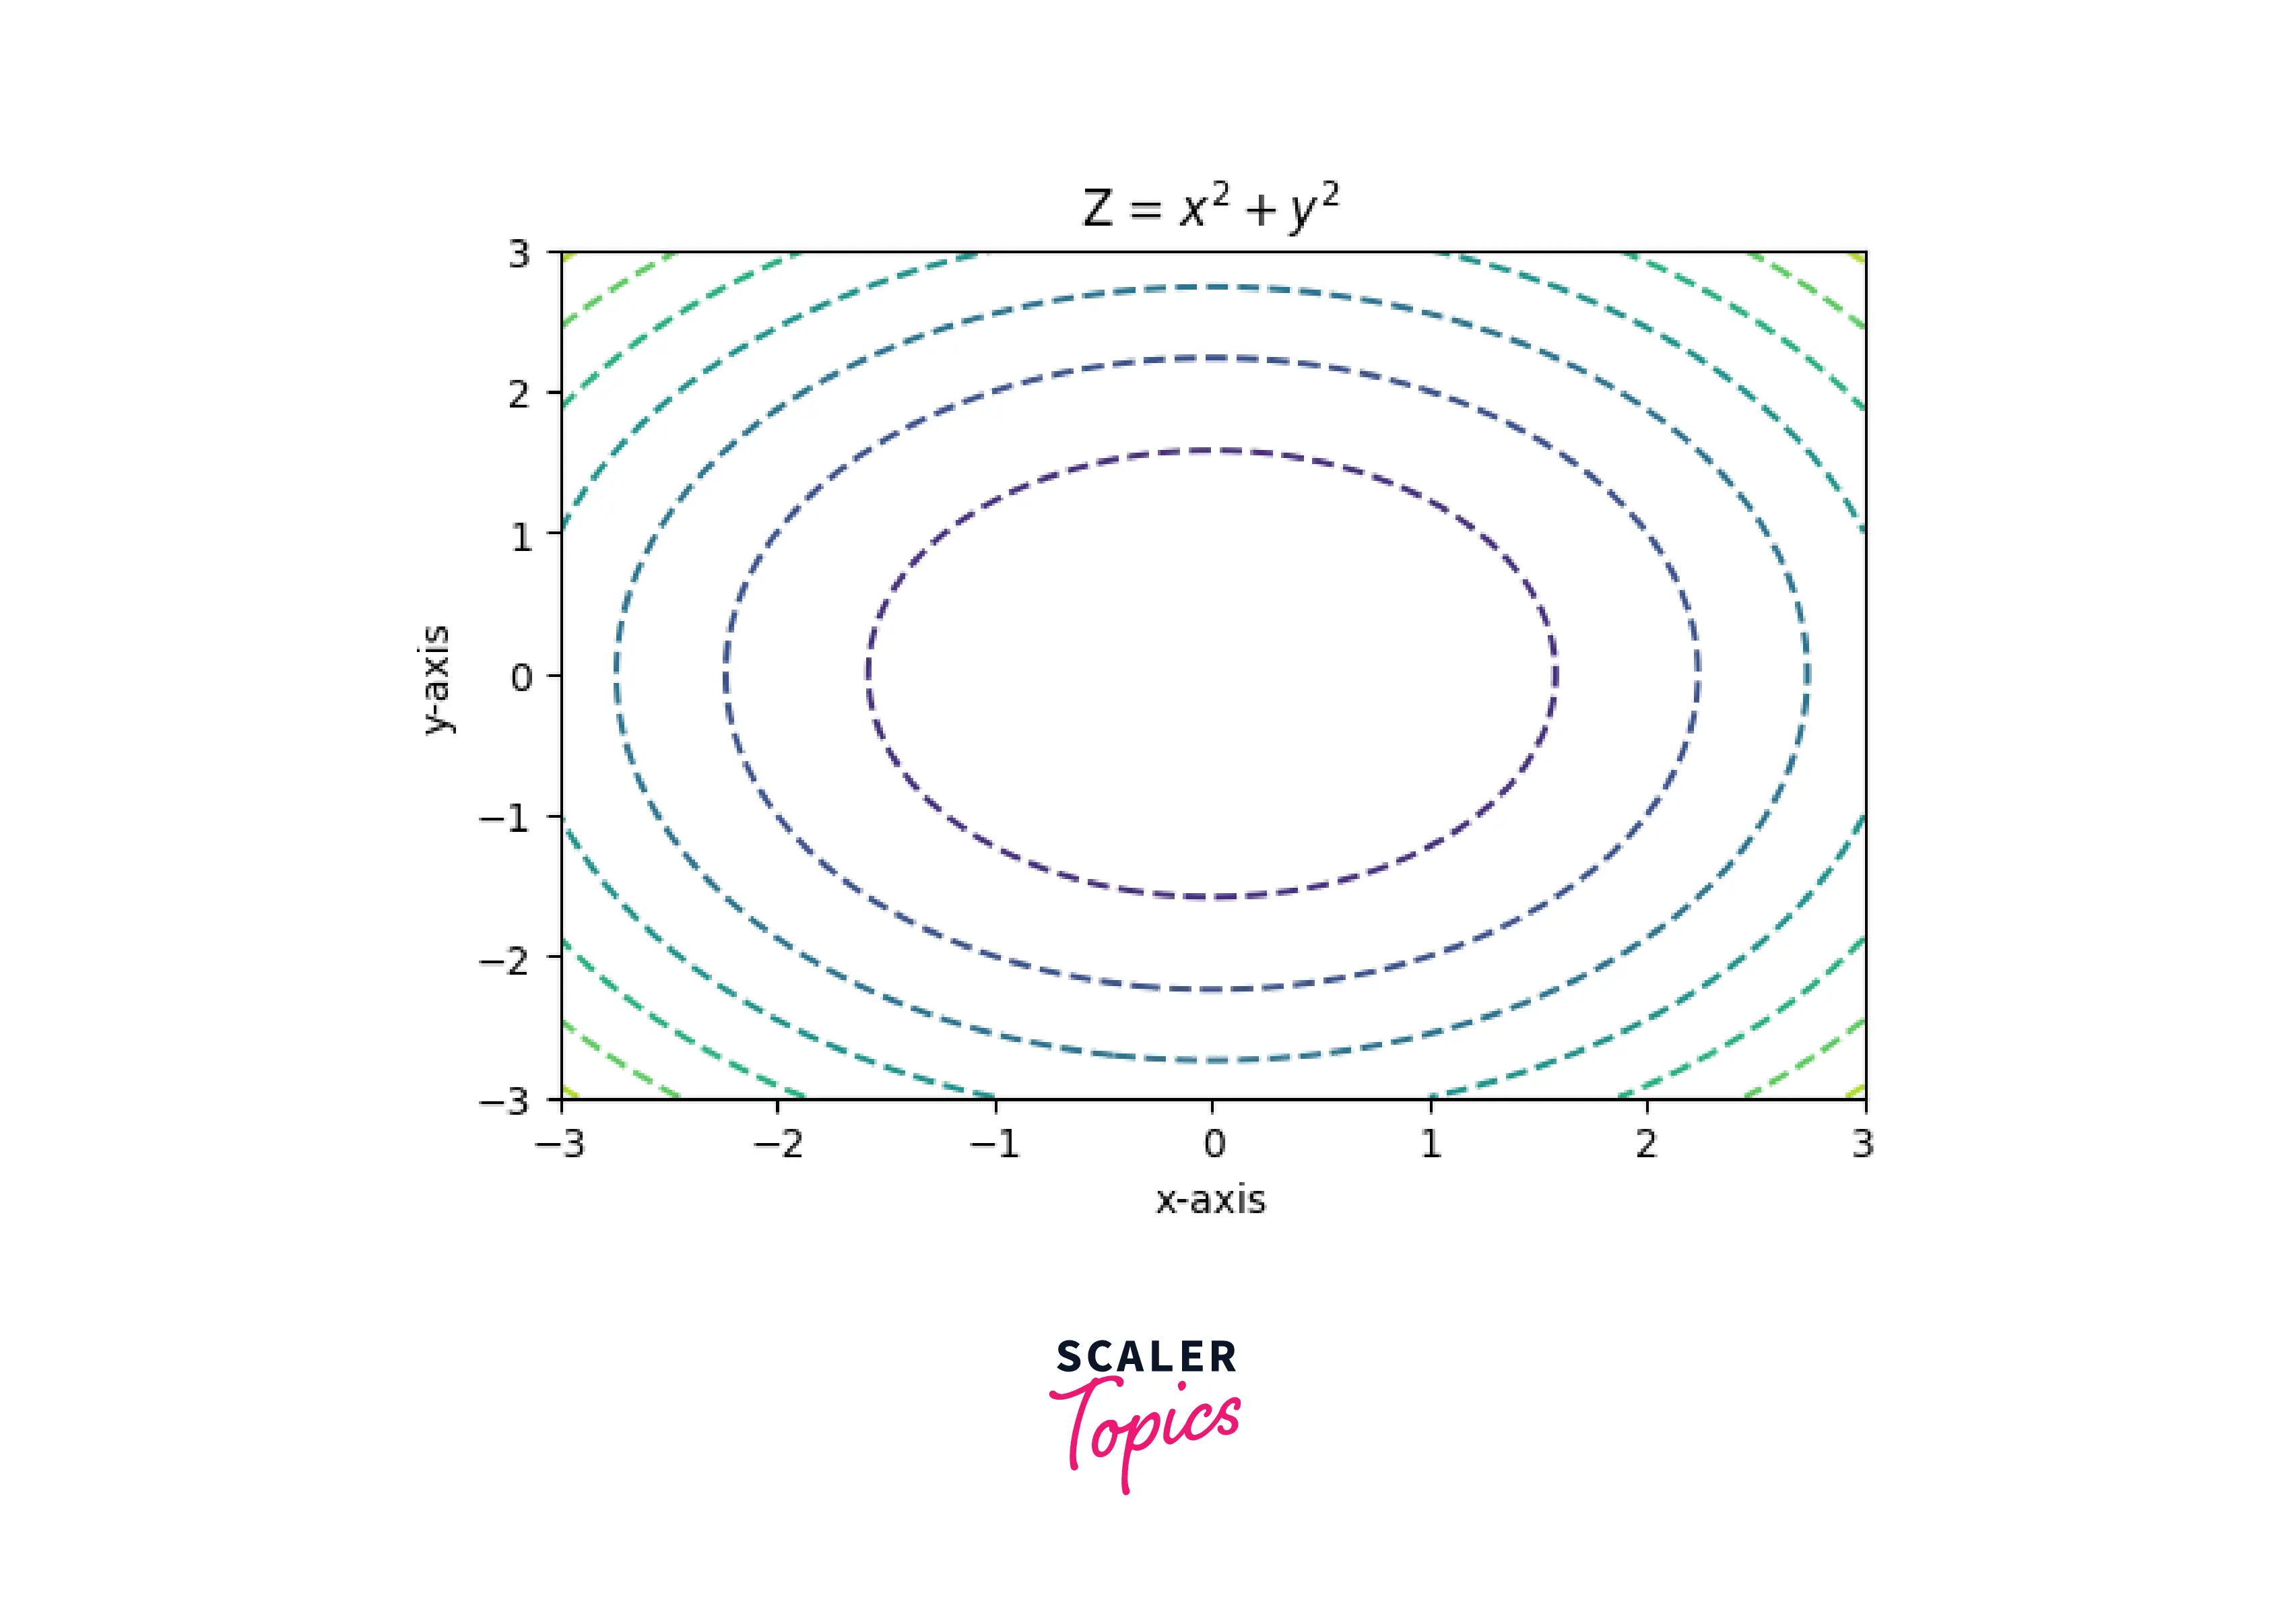
Example2: Contour plot with levels parameter
Output:
Code Examples
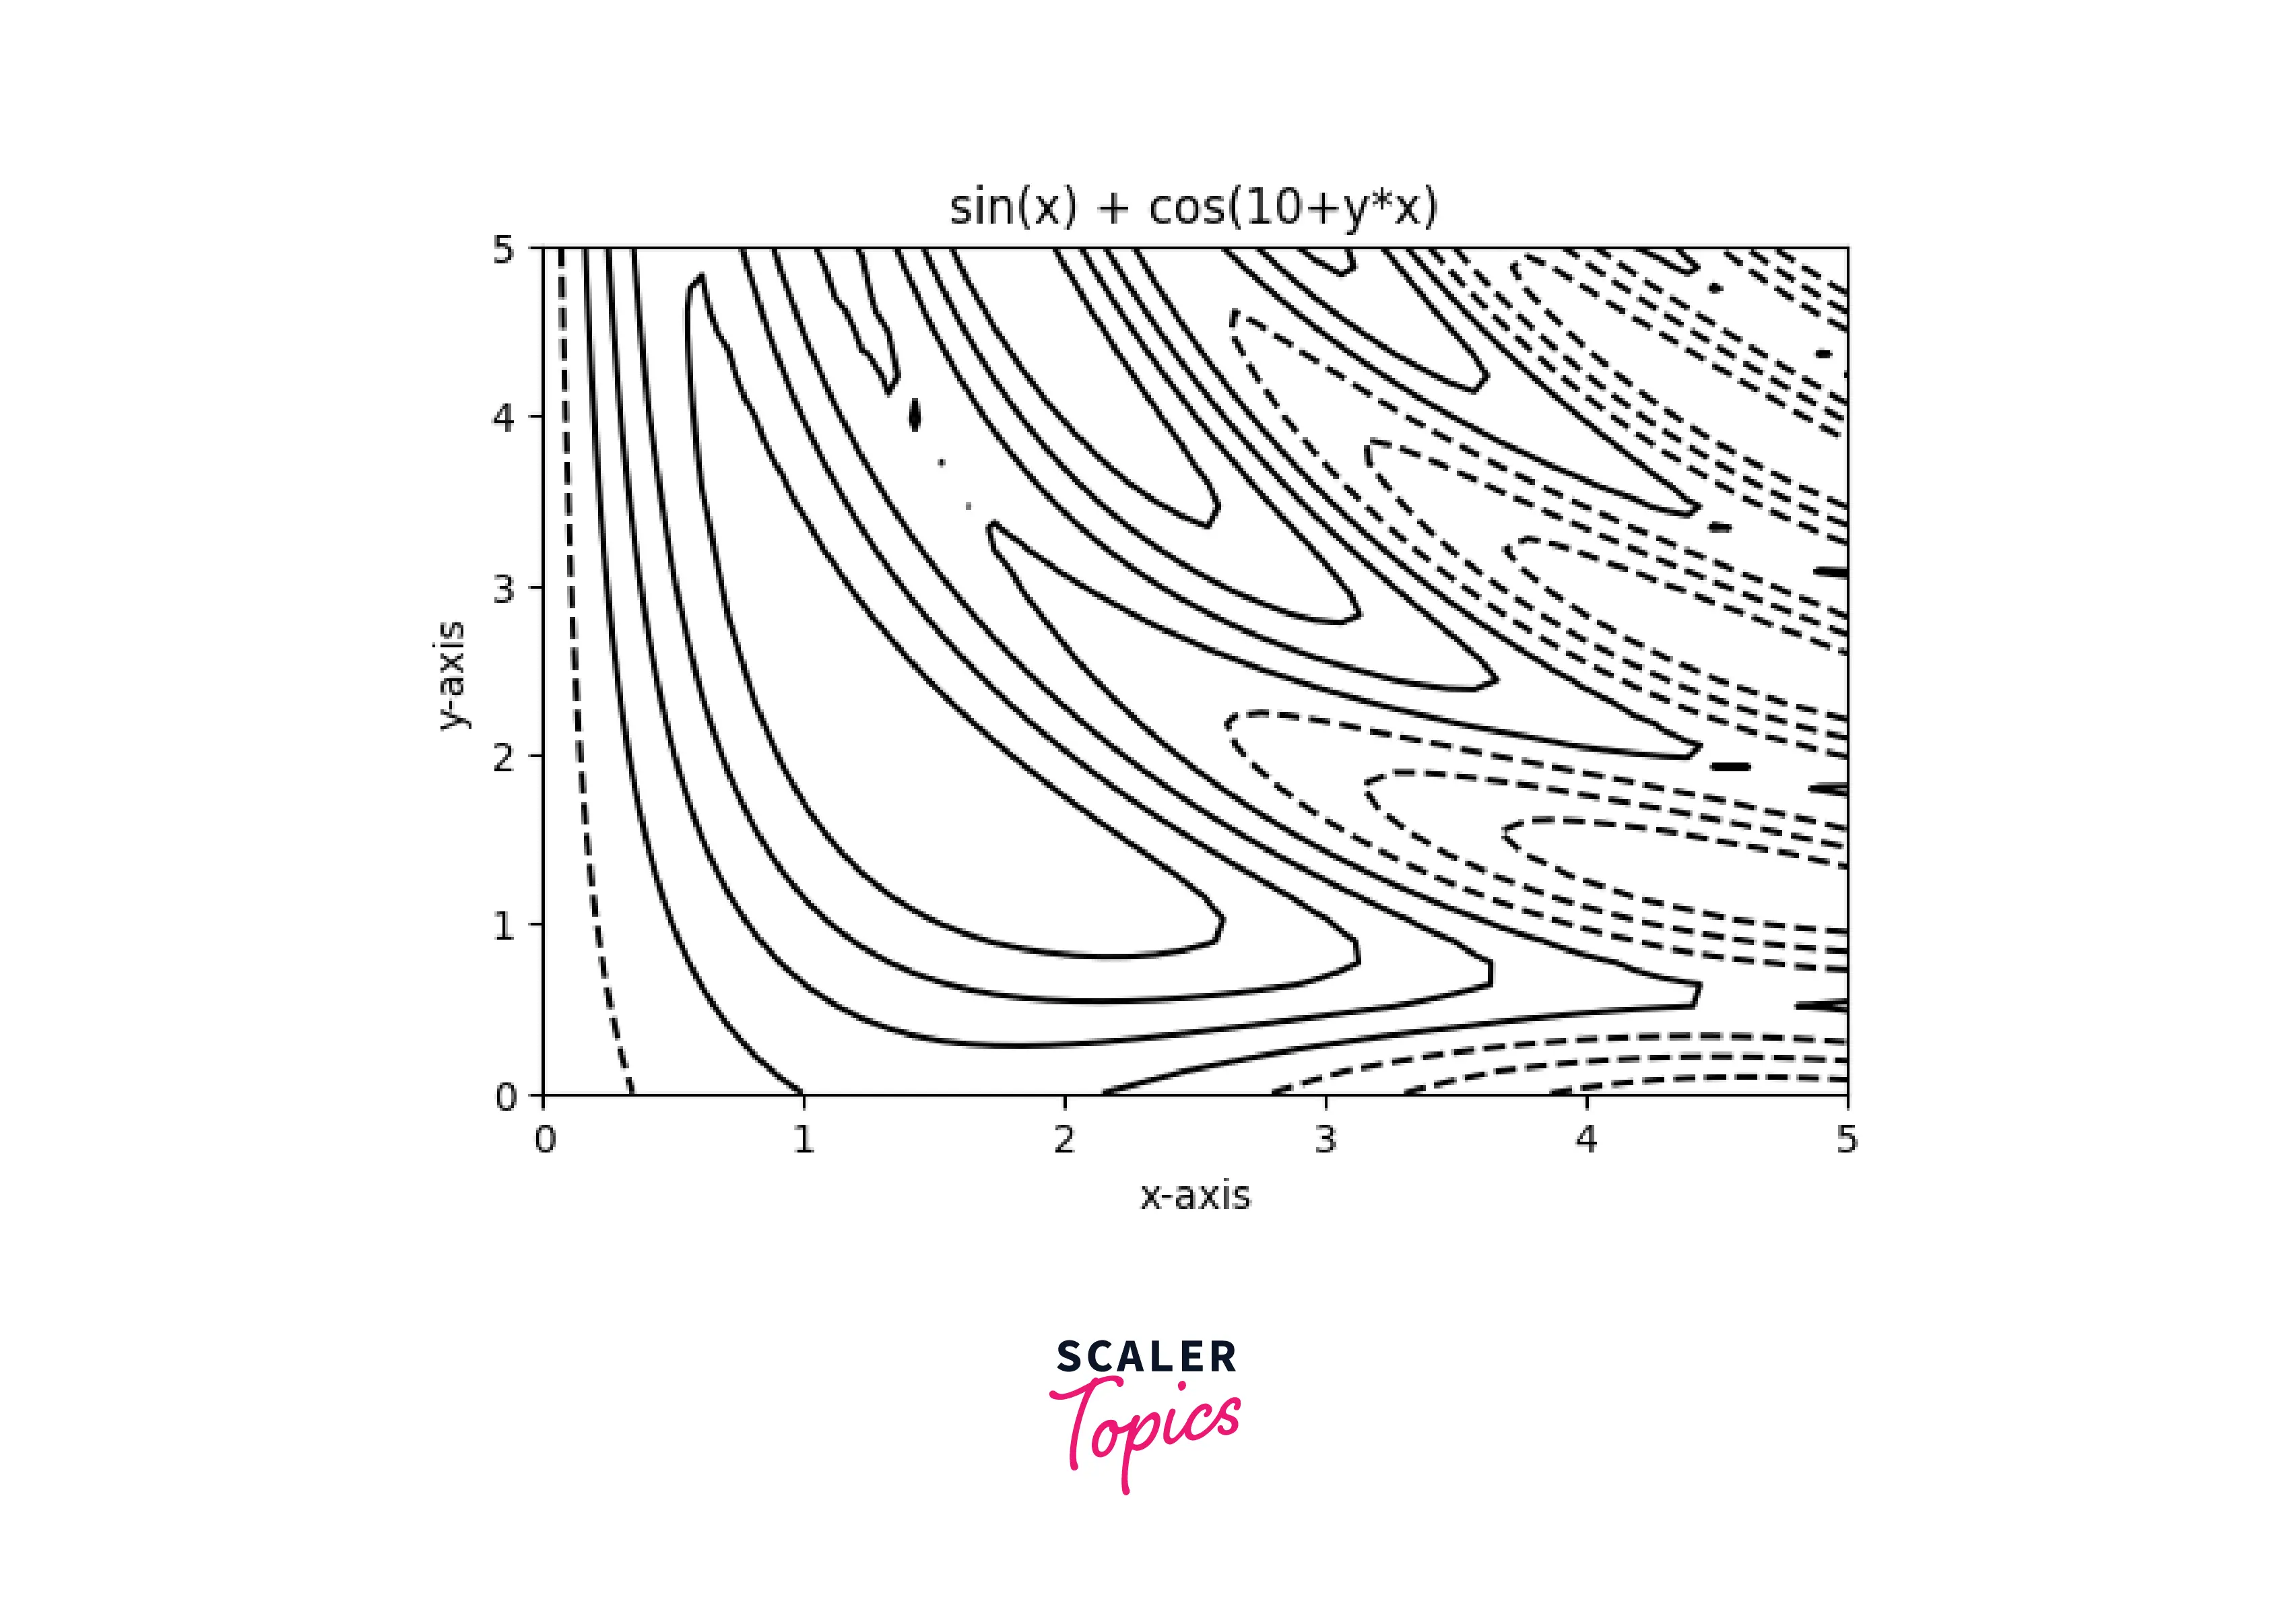
Example1: In this example, the whole plot is in single color where the dashed line represents the negative values.
Output:
Example2:
Output:
Conclusion
- First, we must create a meshgrid to calculate the contour plot's elevation (Z-axis values) by specifying the function z= f(x,y).
- Contour plots are very useful in topography, where we can represent the elevation from the ground.
- matplotlib.pyplot.contour() and matplotlib.pyplot.contourf() are the function to plot 2D contour plots and matplotlib.pyplot.contour3D() function to plot 3D contour plot.