Controlling a Pattern in Matplotlib
Overview
This article will cover a line pattern and how we control it using matplotlib in Python. Controlling patterns is a very important part of plotting in matplotlib, as by doing this, we gain a lot of control over our plots. For example, we can shift the emphasis from one curve to another just by manipulating the patterns of our plots. We will also see and understand how to control a fill pattern with some example plots.
Transform Your Career
Choose from our industry-leading programs designed for career success
Modern Software and AI Engineering Program
Master full-stack development with AI integration

Modern Data Science and ML with specialisation in AI
Advanced data science techniques with AI specialization
Advanced AIML with Specialisation in Agentic AI
Deep dive into AIML with focus on Agentic systems
DevOps, Cloud & AI Platform Engineering
Build and manage AI-powered cloud infrastructure
AI Engineering Advanced Certification by IIT-Roorkee
Premier AI engineering certification from IIT-Roorkee
Introduction
Regarding programming, we always create projects and programs we completely control. Hence, we choose to add different layers of abstraction and encapsulation to our projects.
In creating plots and visualizations, we always want complete control over our plots' attributes and various parameters. Because of this, we need to grasp line patterns well and know how to regulate and manipulate them.
Controlling a Line Pattern and Thickness
We should first comprehend a line pattern before delving into how to control line pattern and thickness.
Line patterns in matplotlib are some manipulations that we can do in our plots so that the lines in our plot are vivid and have some diversity.
To explain this in a better way, let's assume that you've been given a task to plot a graph showing a neighborhood's densities. You make a **standard plot**and don't necessarily differentiate between the highly populated and the sparsely populated areas. This would not be helpful, as we can't differentiate between densely and sparsely populated areas. If we can lighten the sparsely populated areas and darken the densely populated areas, we will solve our problem.
Hence, a need exists to diversify the lines of our plots. This will direct a positive influence on our understanding of plots.
When it comes to controlling a line pattern, there are two parameters for us to manipulate:
- linestyle()
- linewidth()
Linestyle()
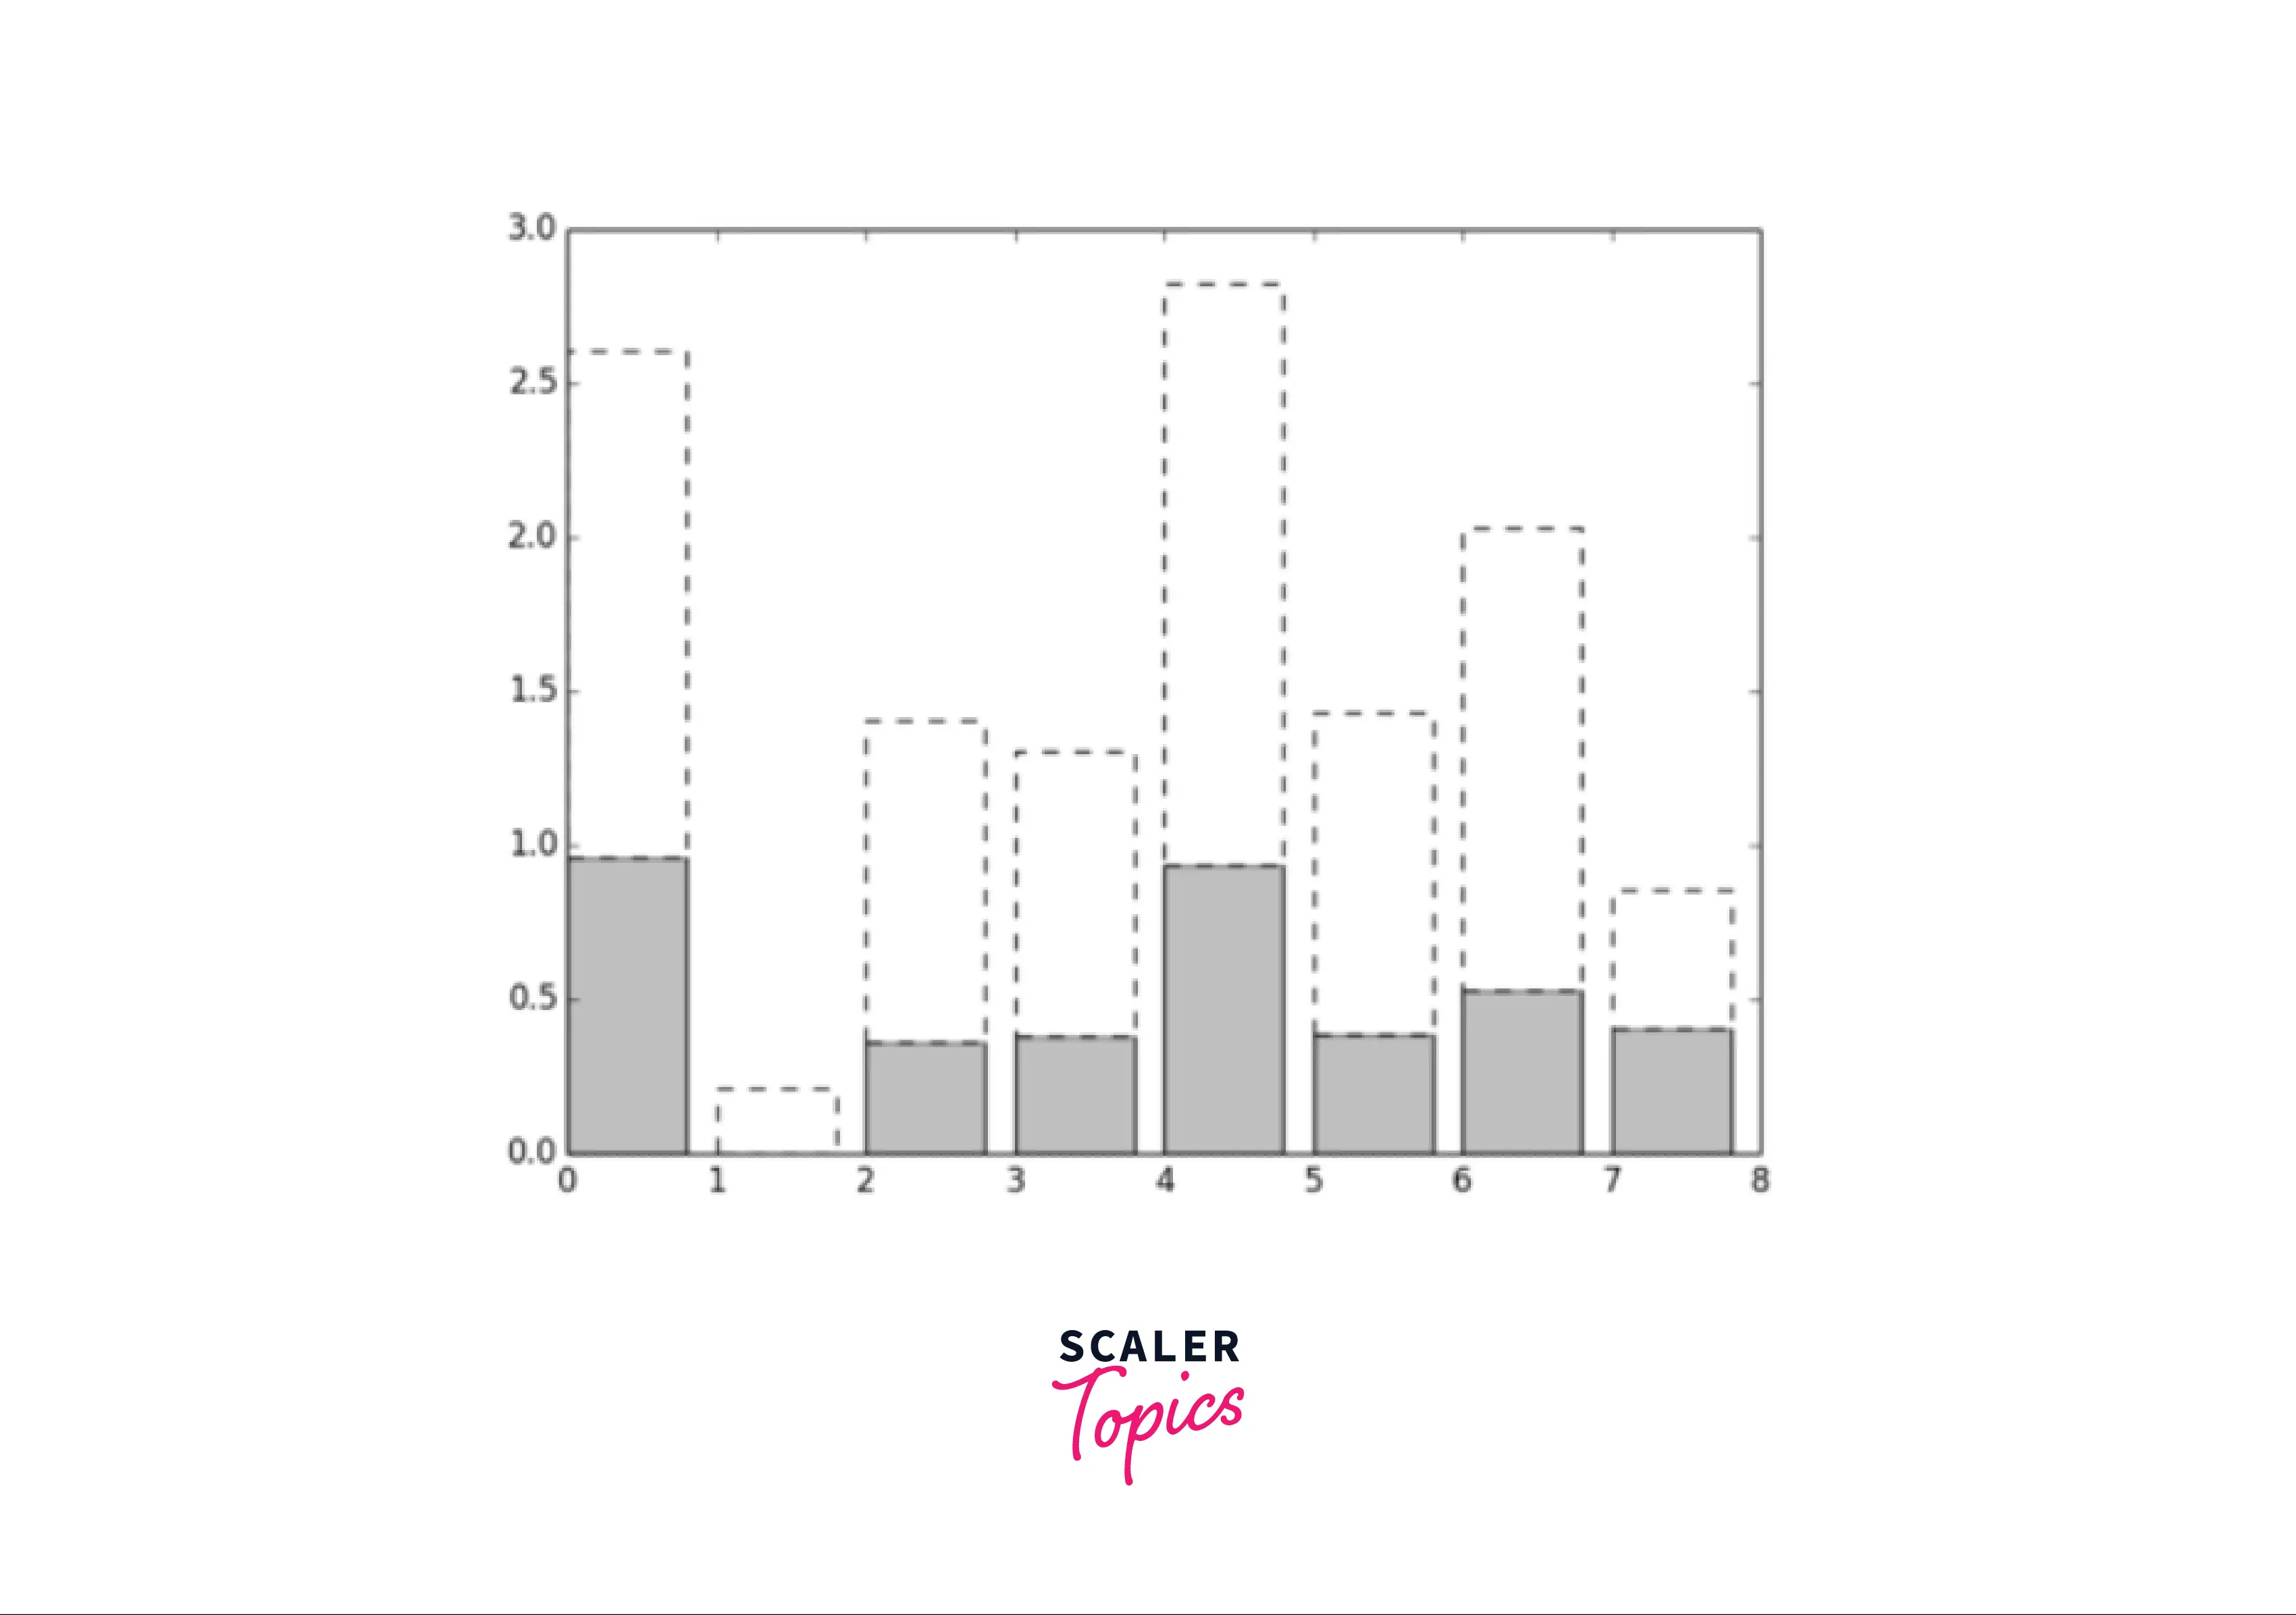
The linestyle parameter will set the style of our plots. For example, suppose we want our plots to indicate some densely populated and sparsely populated areas. In that case, we can change our line style so that the difference in the plots will represent the difference between sparsely and densely populated areas.
In matplotlib, the following attributes are available regarding linestyle(): Solid, Dashed, Dotted and Dash-dot. In the example given below, we will change the pattern for a bar graph:
Turn Learning into Career Growth
Linewidth()
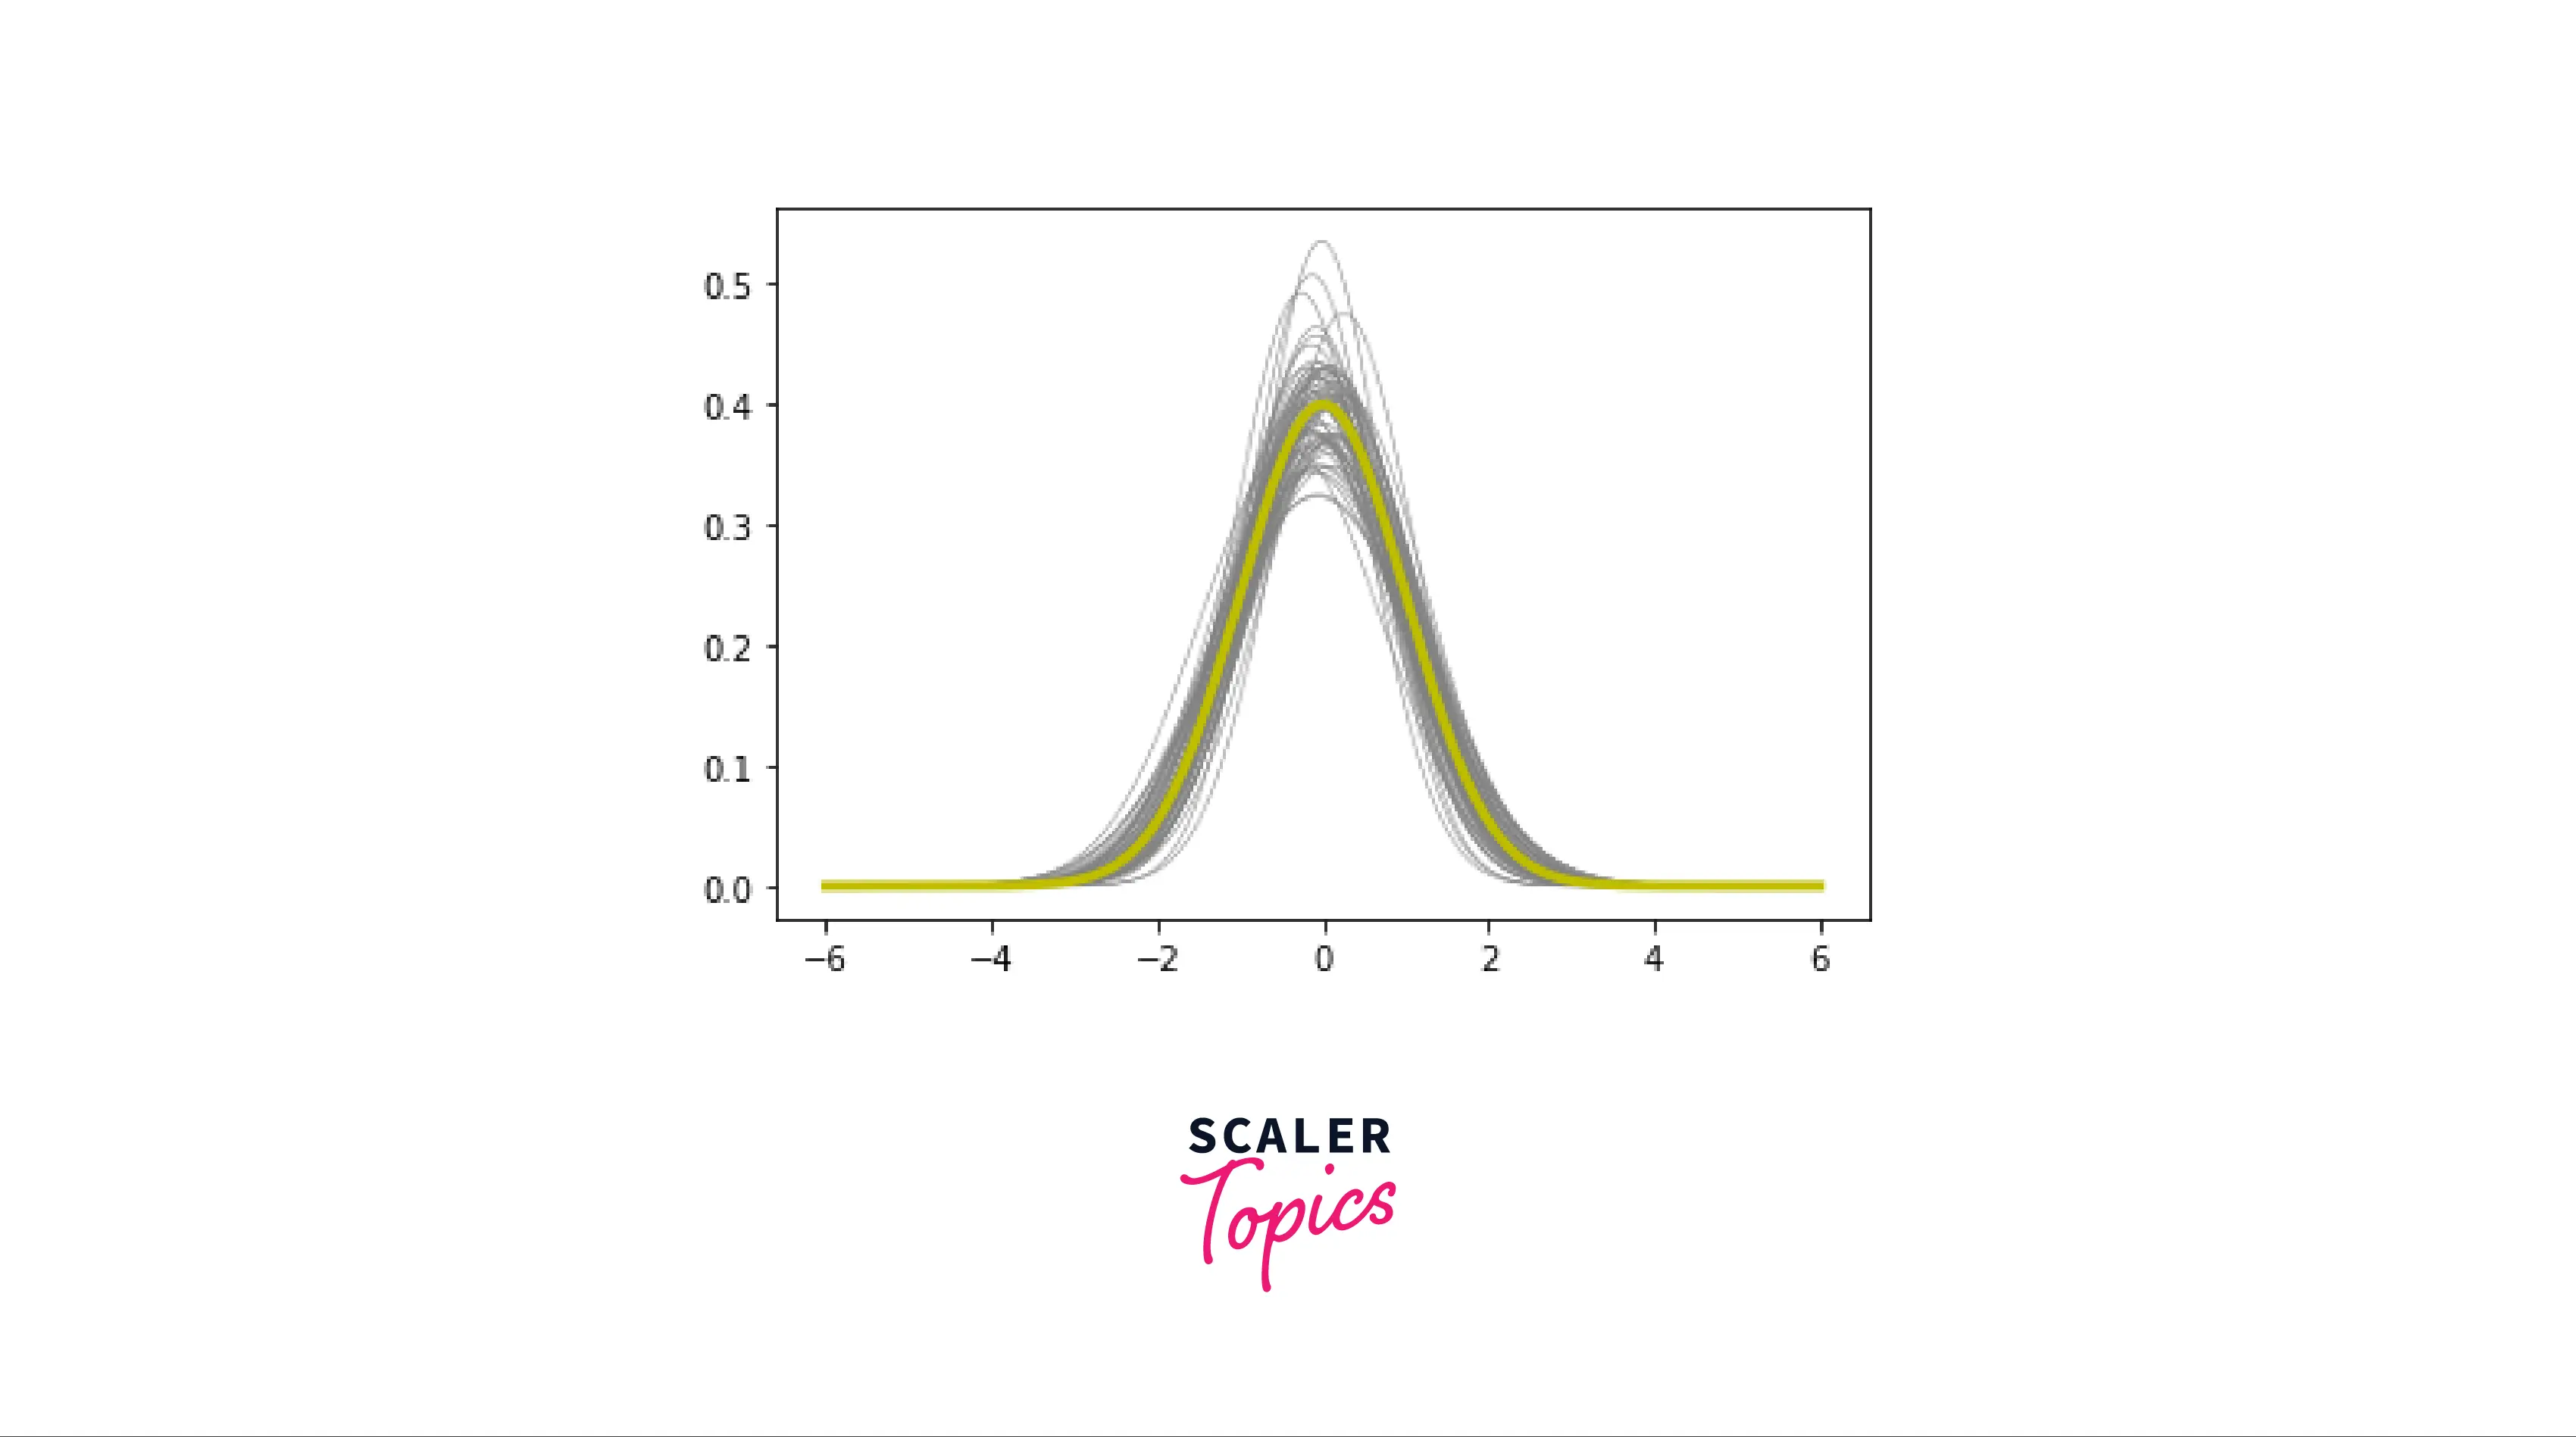
The linewidth() parameter in matplotlib allows us to vary the thickness of our grid lines. Experimentation with line thickness might be useful for emphasizing a specific curve.
In the example below, we will plot the Gaussian Probability Density Function for nearly 50 samples, and with the help of linewidth(), we will display the various samples.
Output:
Scaler Placement Report and Statistics
Scaler learners achieved 2.5x salary growth with average post-Scaler CTC reaching ₹23L.
Controlling a Fill Pattern
- Just as we manipulate lines in our plots, we can also choose to fill our plots.
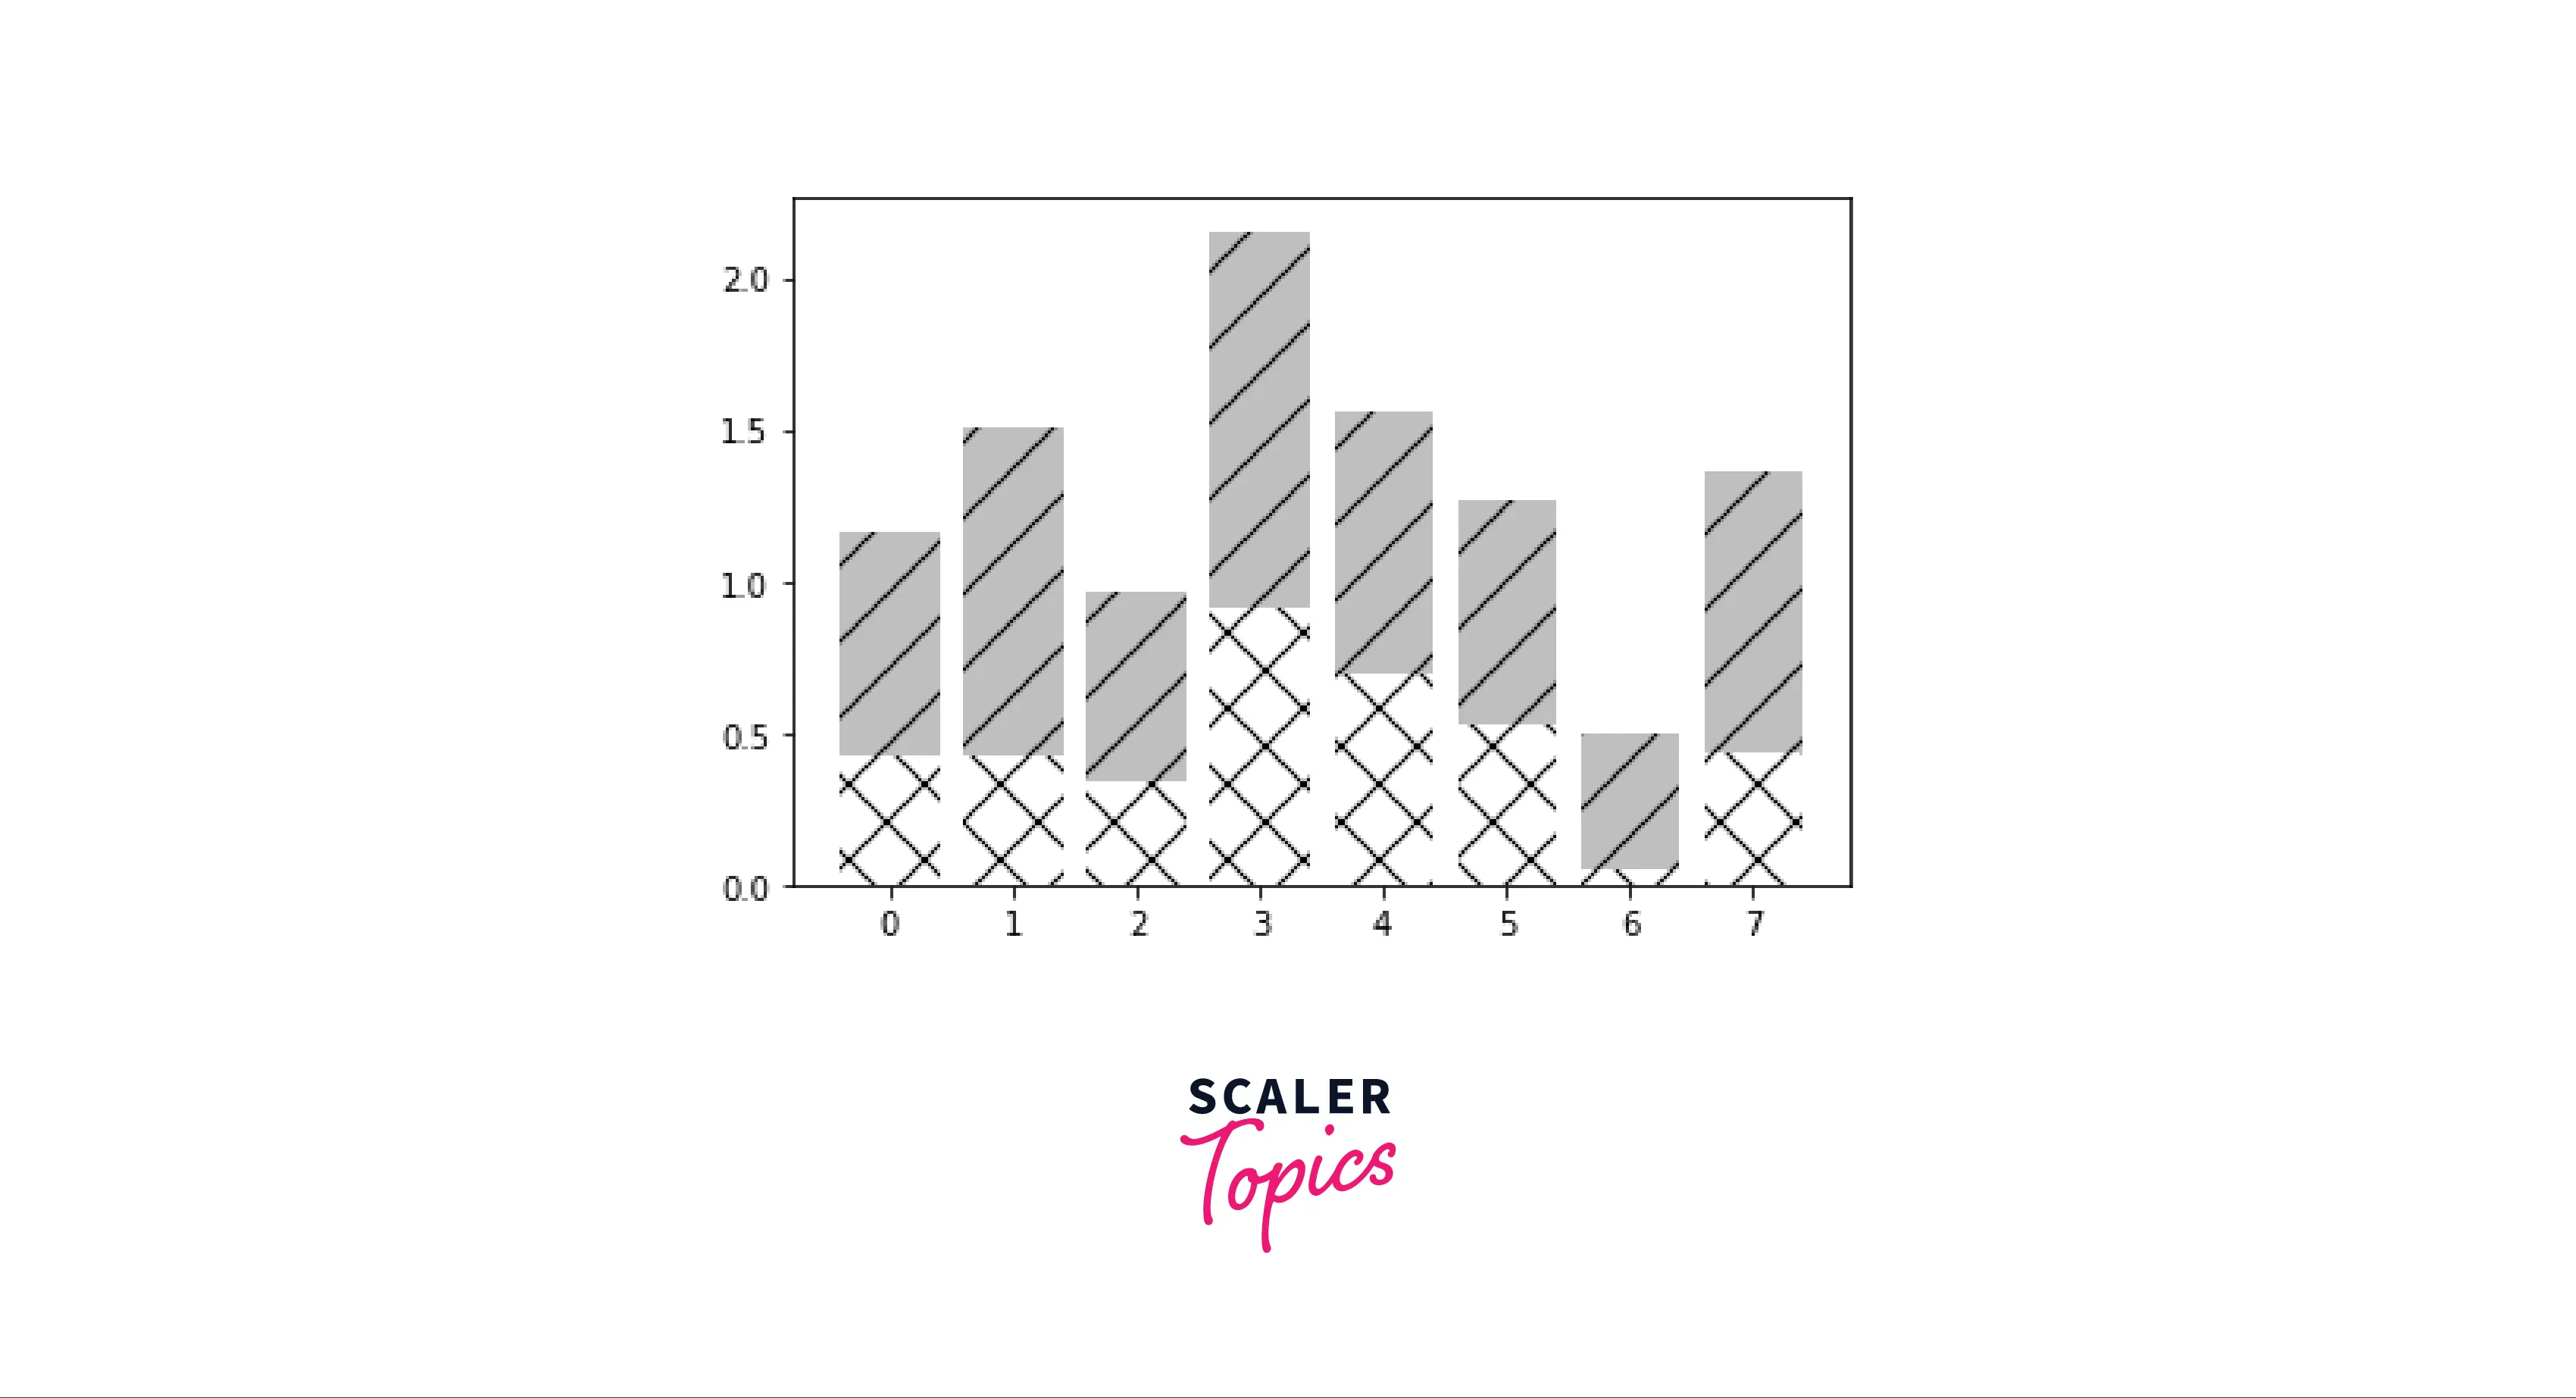
- There are a limited number of hatching patterns that can be used to indicate a fill pattern, and they are "/", "\", "|", "-", "+", "x", "o", "O", "." and "*".
- In the example below, we will use the "/" hatch pattern to fill our plot.
- Each value is associated with a unique hatching pattern. The edgecolor parameter controls the colour of the hatching, while the color parameter determines the colour of the pattern's backdrop.
Output:
Examples
Here are some more examples that will help you understand the concept of controlling any pattern in matplotlib.
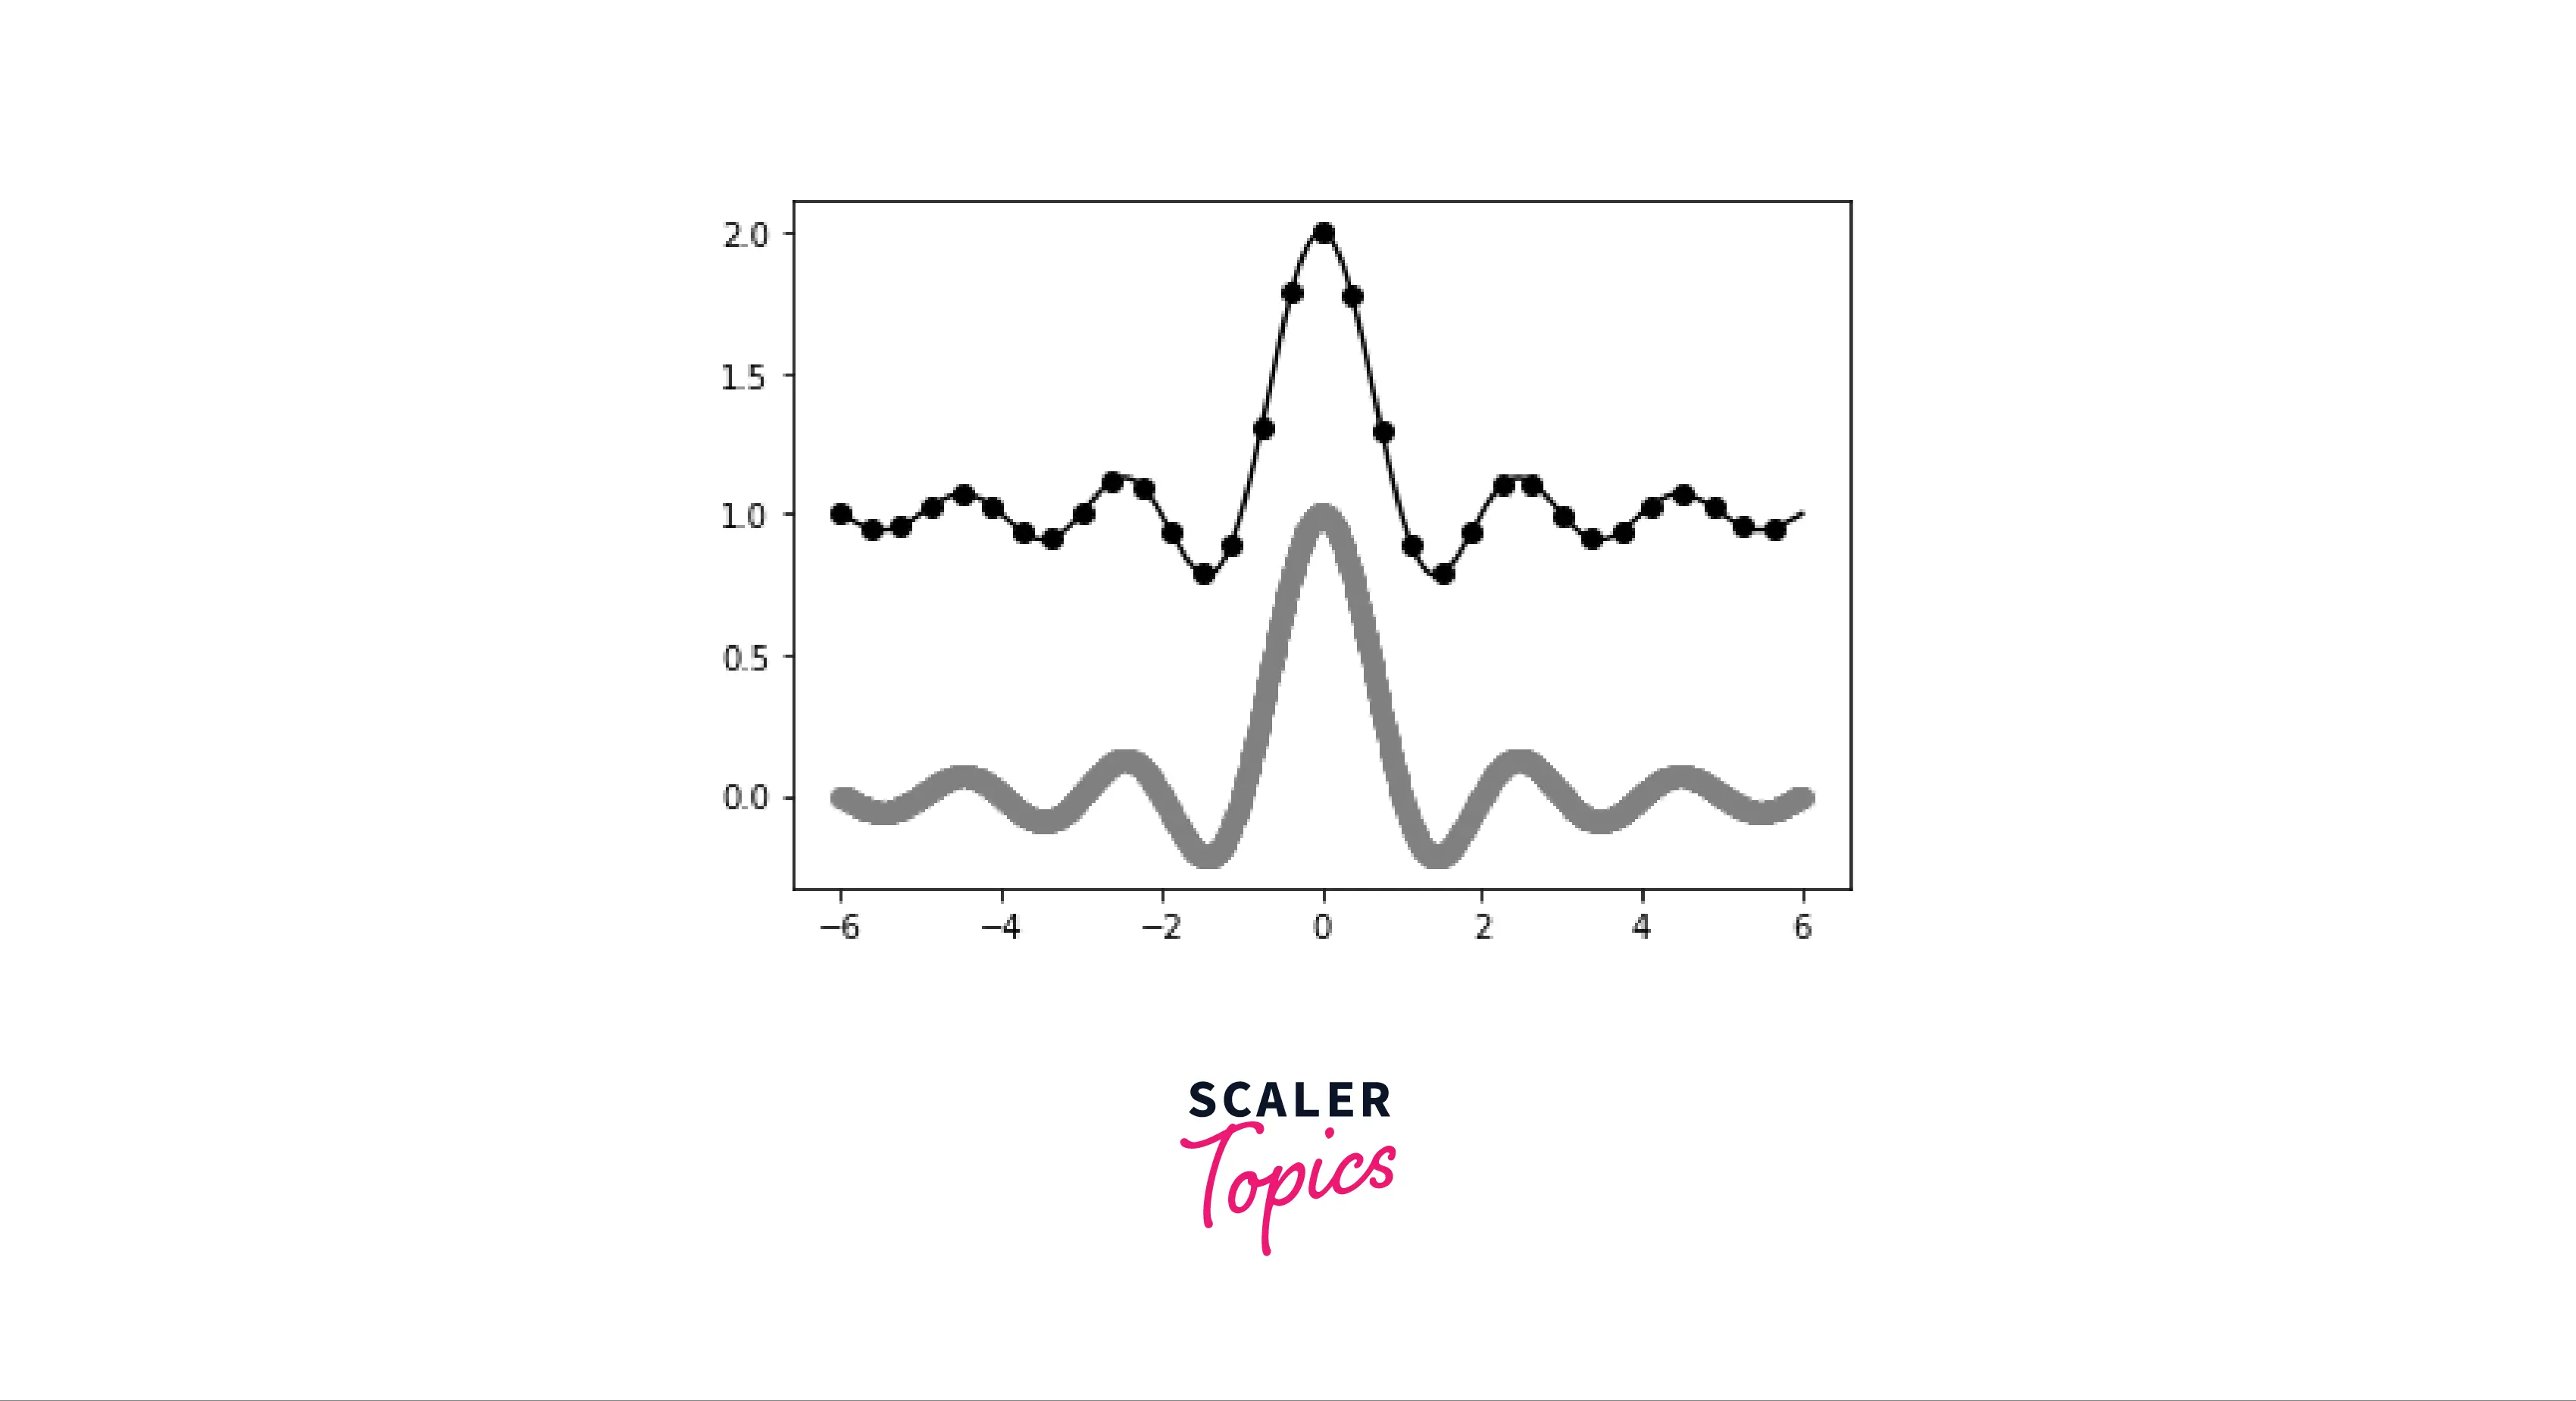
- Using different hatch operators to control a fill pattern. In this example, we will try to plot a bar graph so that up to the point A, we will fill the plot with a marker ('o'). After that, we will fill the plot with another marker ('|') till a point B
Output:
Conclusion
- In this article, we covered various aspects of Controlling a pattern in Matplotlib.
- We understood what a line pattern is and the various methods by which we can control it.
- We learned the importance of controlling patterns and different attributes that we can manipulate according to our needs.
- Apart from this, we also understood how to fill a pattern and how filling a pattern works.
- We also looked at some examples that will help you comprehensively understand the concept of filling patterns.