Embedding 2D Figures in a 3D Figure
Overview
Matplotlib, the data visualization library of Python, was developed with only 2-dimensional plotting in mind. However, the designers of Matplotlib decided to expand its functionality to include 3D visualizing tools; thus, the 3-dimensional utilities were built on top of the 2-dimensional components. Consequently, Matplotlib has another module that can render 3D implementation of data - the mplot3d package. The mplot3D library allows embedding a 2D figure in a 3D figure.
Transform Your Career
Choose from our industry-leading programs designed for career success
Modern Software and AI Engineering Program
Master full-stack development with AI integration

Modern Data Science and ML with specialisation in AI
Advanced data science techniques with AI specialization
Advanced AIML with Specialisation in Agentic AI
Deep dive into AIML with focus on Agentic systems
DevOps, Cloud & AI Platform Engineering
Build and manage AI-powered cloud infrastructure
AI Engineering Advanced Certification by IIT-Roorkee
Premier AI engineering certification from IIT-Roorkee
Introduction
Matplotlib is an excellent 2D and 3D graphics library for data visualization. The best part is that Matplotlib has ever-increasing support for 3D plots. Increasing the dimension of plots can make it easier to visualize and study the data quickly and efficiently. Matplotlib.pyplot, a collection of command-style methods and functions, was created solely to match MATLAB plotting functions.
Calling pyplot.plot() allows us to draw curves in two dimensions. But, first, we must establish an Axes3D instance, as we would with any three-dimensional figure. The call to plot() then operates similarly to its 2D equivalent; we supply one list and the coordinates of each dimension’s points.
Scaler Placement Report and Statistics
Scaler learners achieved 2.5x salary growth with average post-Scaler CTC reaching ₹23L.
How to Embed using mpl_toolkits.mplot3d
The mplot3d toolkit, included in the default Matplotlib installation, is imported to enable 3D visualization in Matplotlib.
Once this submodule is imported, the 3D axes can be created by passing the keyword projection='3d' to normal axes creation routines.
The plot() function of Matplotlib is used to plot both 2D and 3D data.
Syntax
Turn Learning into Career Growth
Parameters
- xs : 1D array-like x coordinates of the vertices.
- ys : 1D array-like y coordinates of the vertices.
- zs : float or 1D array-like z coordinates of the vertices
- zdir : {'x', 'y', 'z'}, the default is 'z' Determines the direction to use as z ('x', 'y', or 'z') when plotting 2D data.
- **kwargs Other arguments
Embedding 2D figures in a 3D figure in Matplotlib
We can embed a 2D figure in a 3D figure in Python’s Matplotlib.
An example will help us understand this method better. First, we will plot a simple 3D surface with two 2D curves.
Output:
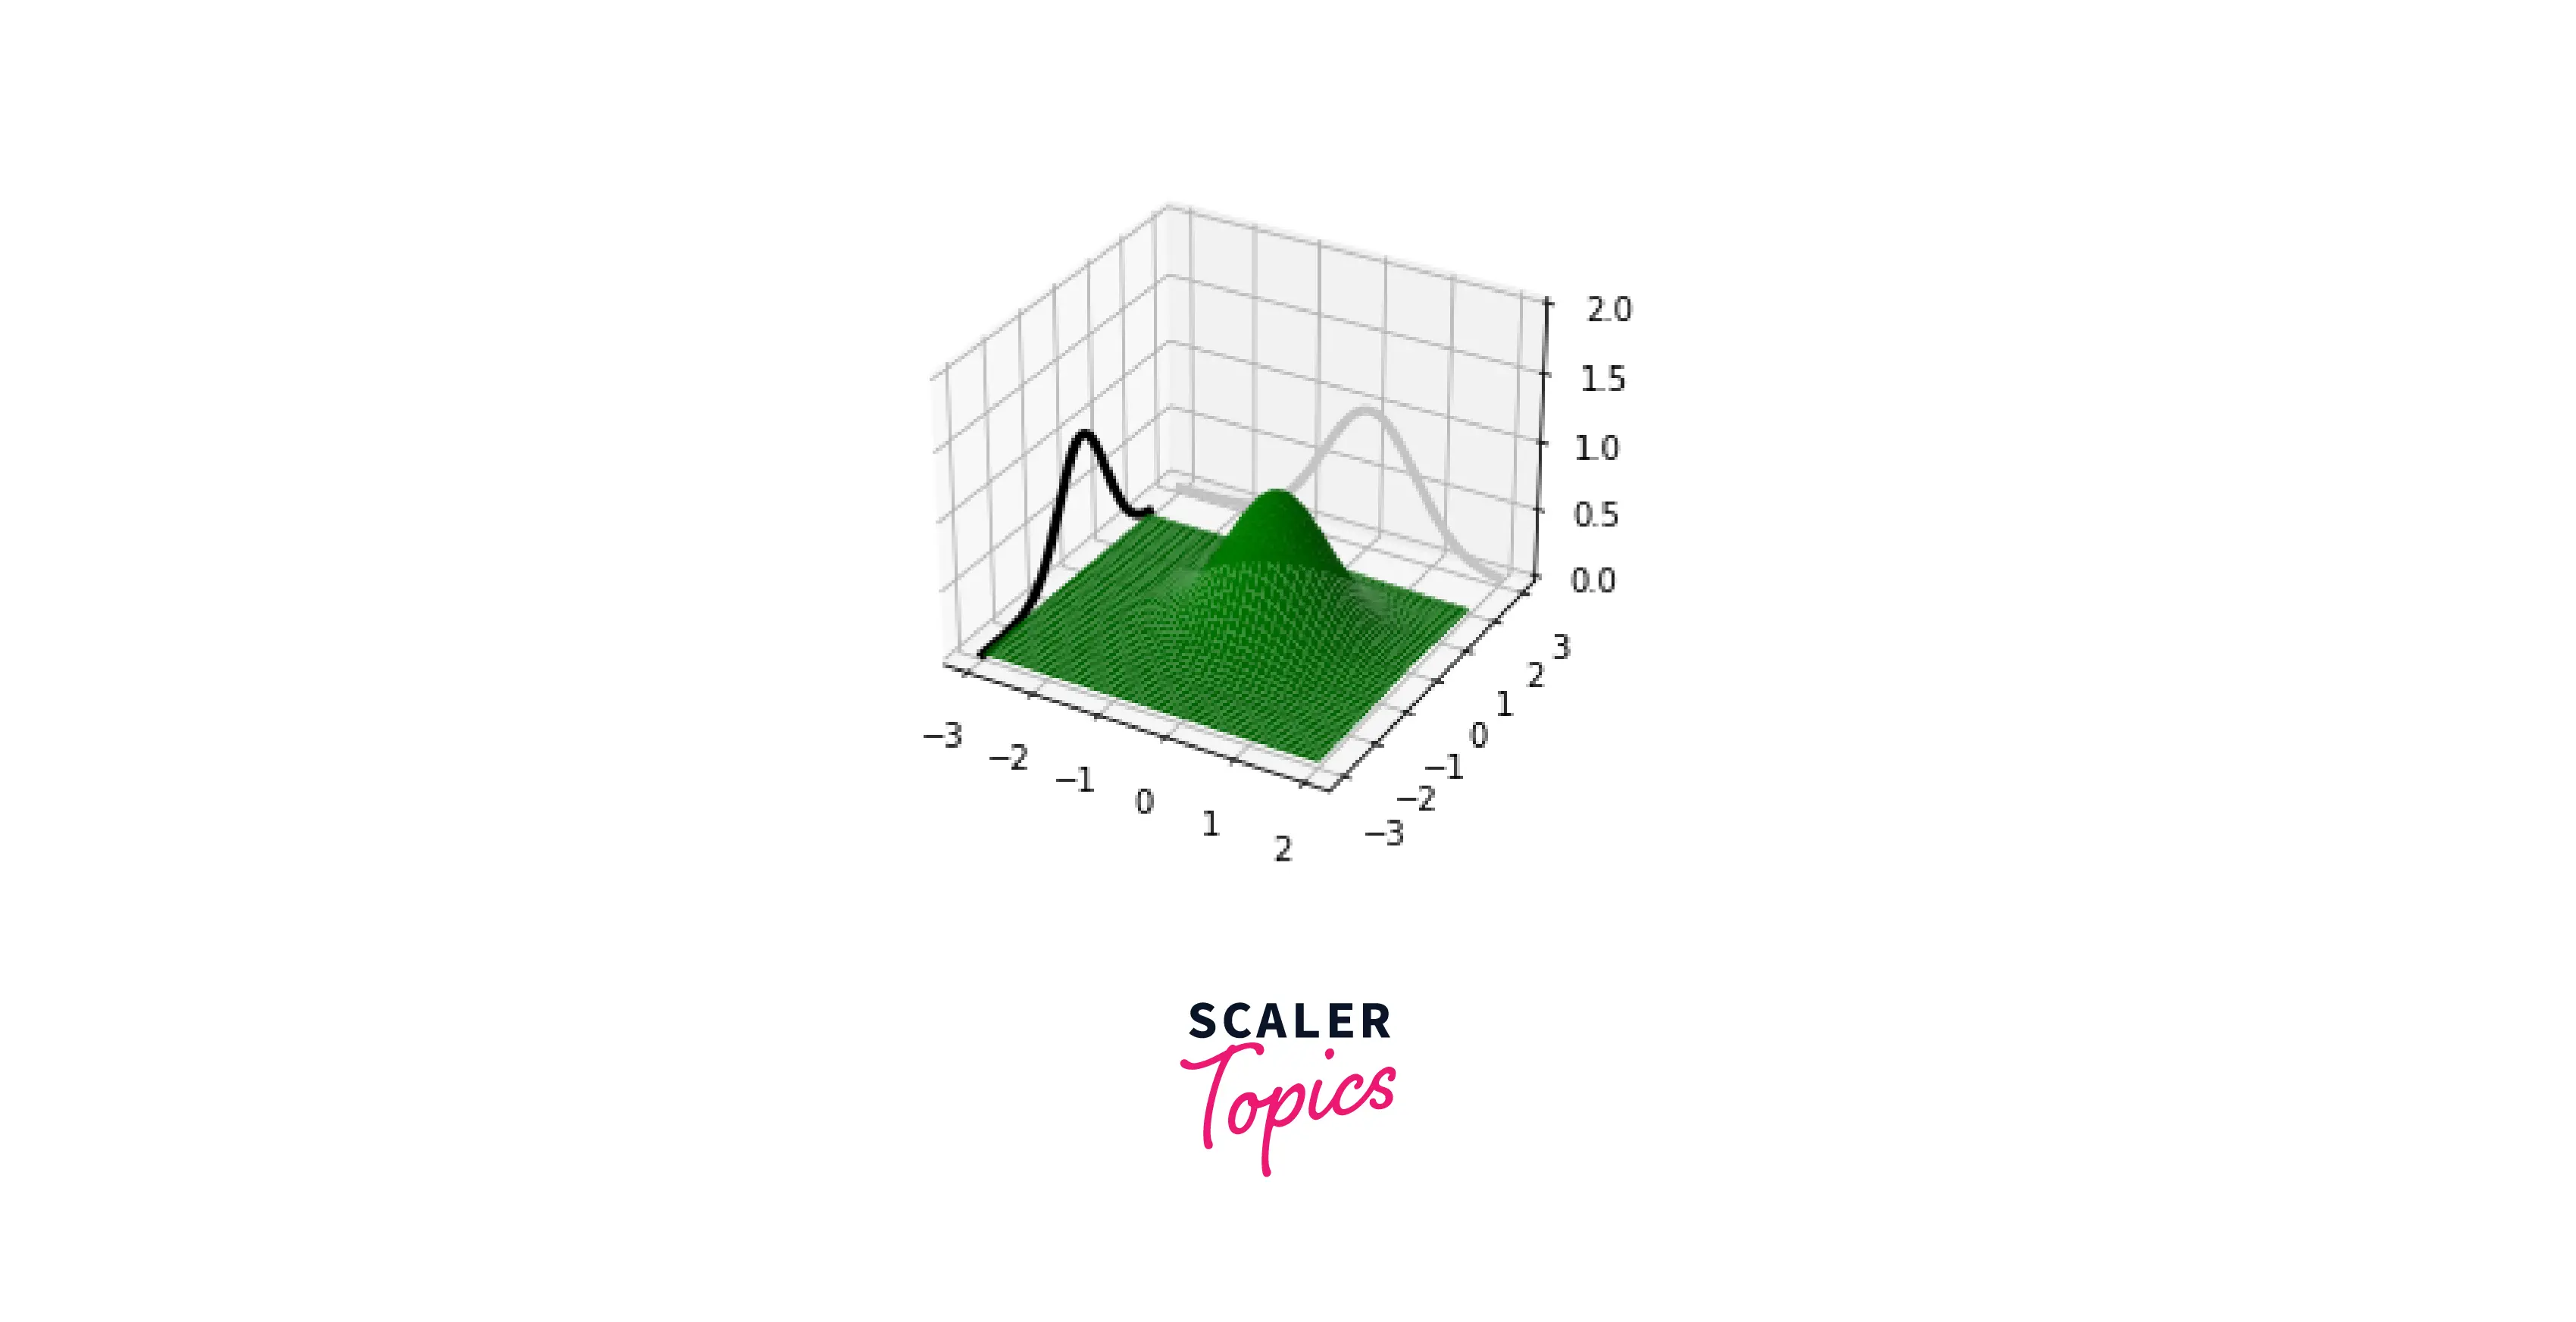
The black and gray curves are drawn as 2D curves projected on a plane.
The Axes3D instance of Matplotlib supports the standard 2D rendering commands such as plot(). However, there are two additional optional parameters for plot(): zs and zdir.
- Zdir : This specifies which direction ('x', 'y', or 'z') to use when plotting a 2D set.
- Zs: This establishes the plane's offset. If only one value is given, they will all be placed at the same z.
Thus, all the 2D primitives are available with Axes3D, which is all we need to remember to embed 2D figures in a 3D figure. We have to use the two optional parameters, zdir, and zs, to place the plane on which the figures should be drawn. Although embedding 2D figures into 3D figures is relatively easy, it opens up many opportunities for building dynamic figures from simple primitives.
More Examples
Example 1:
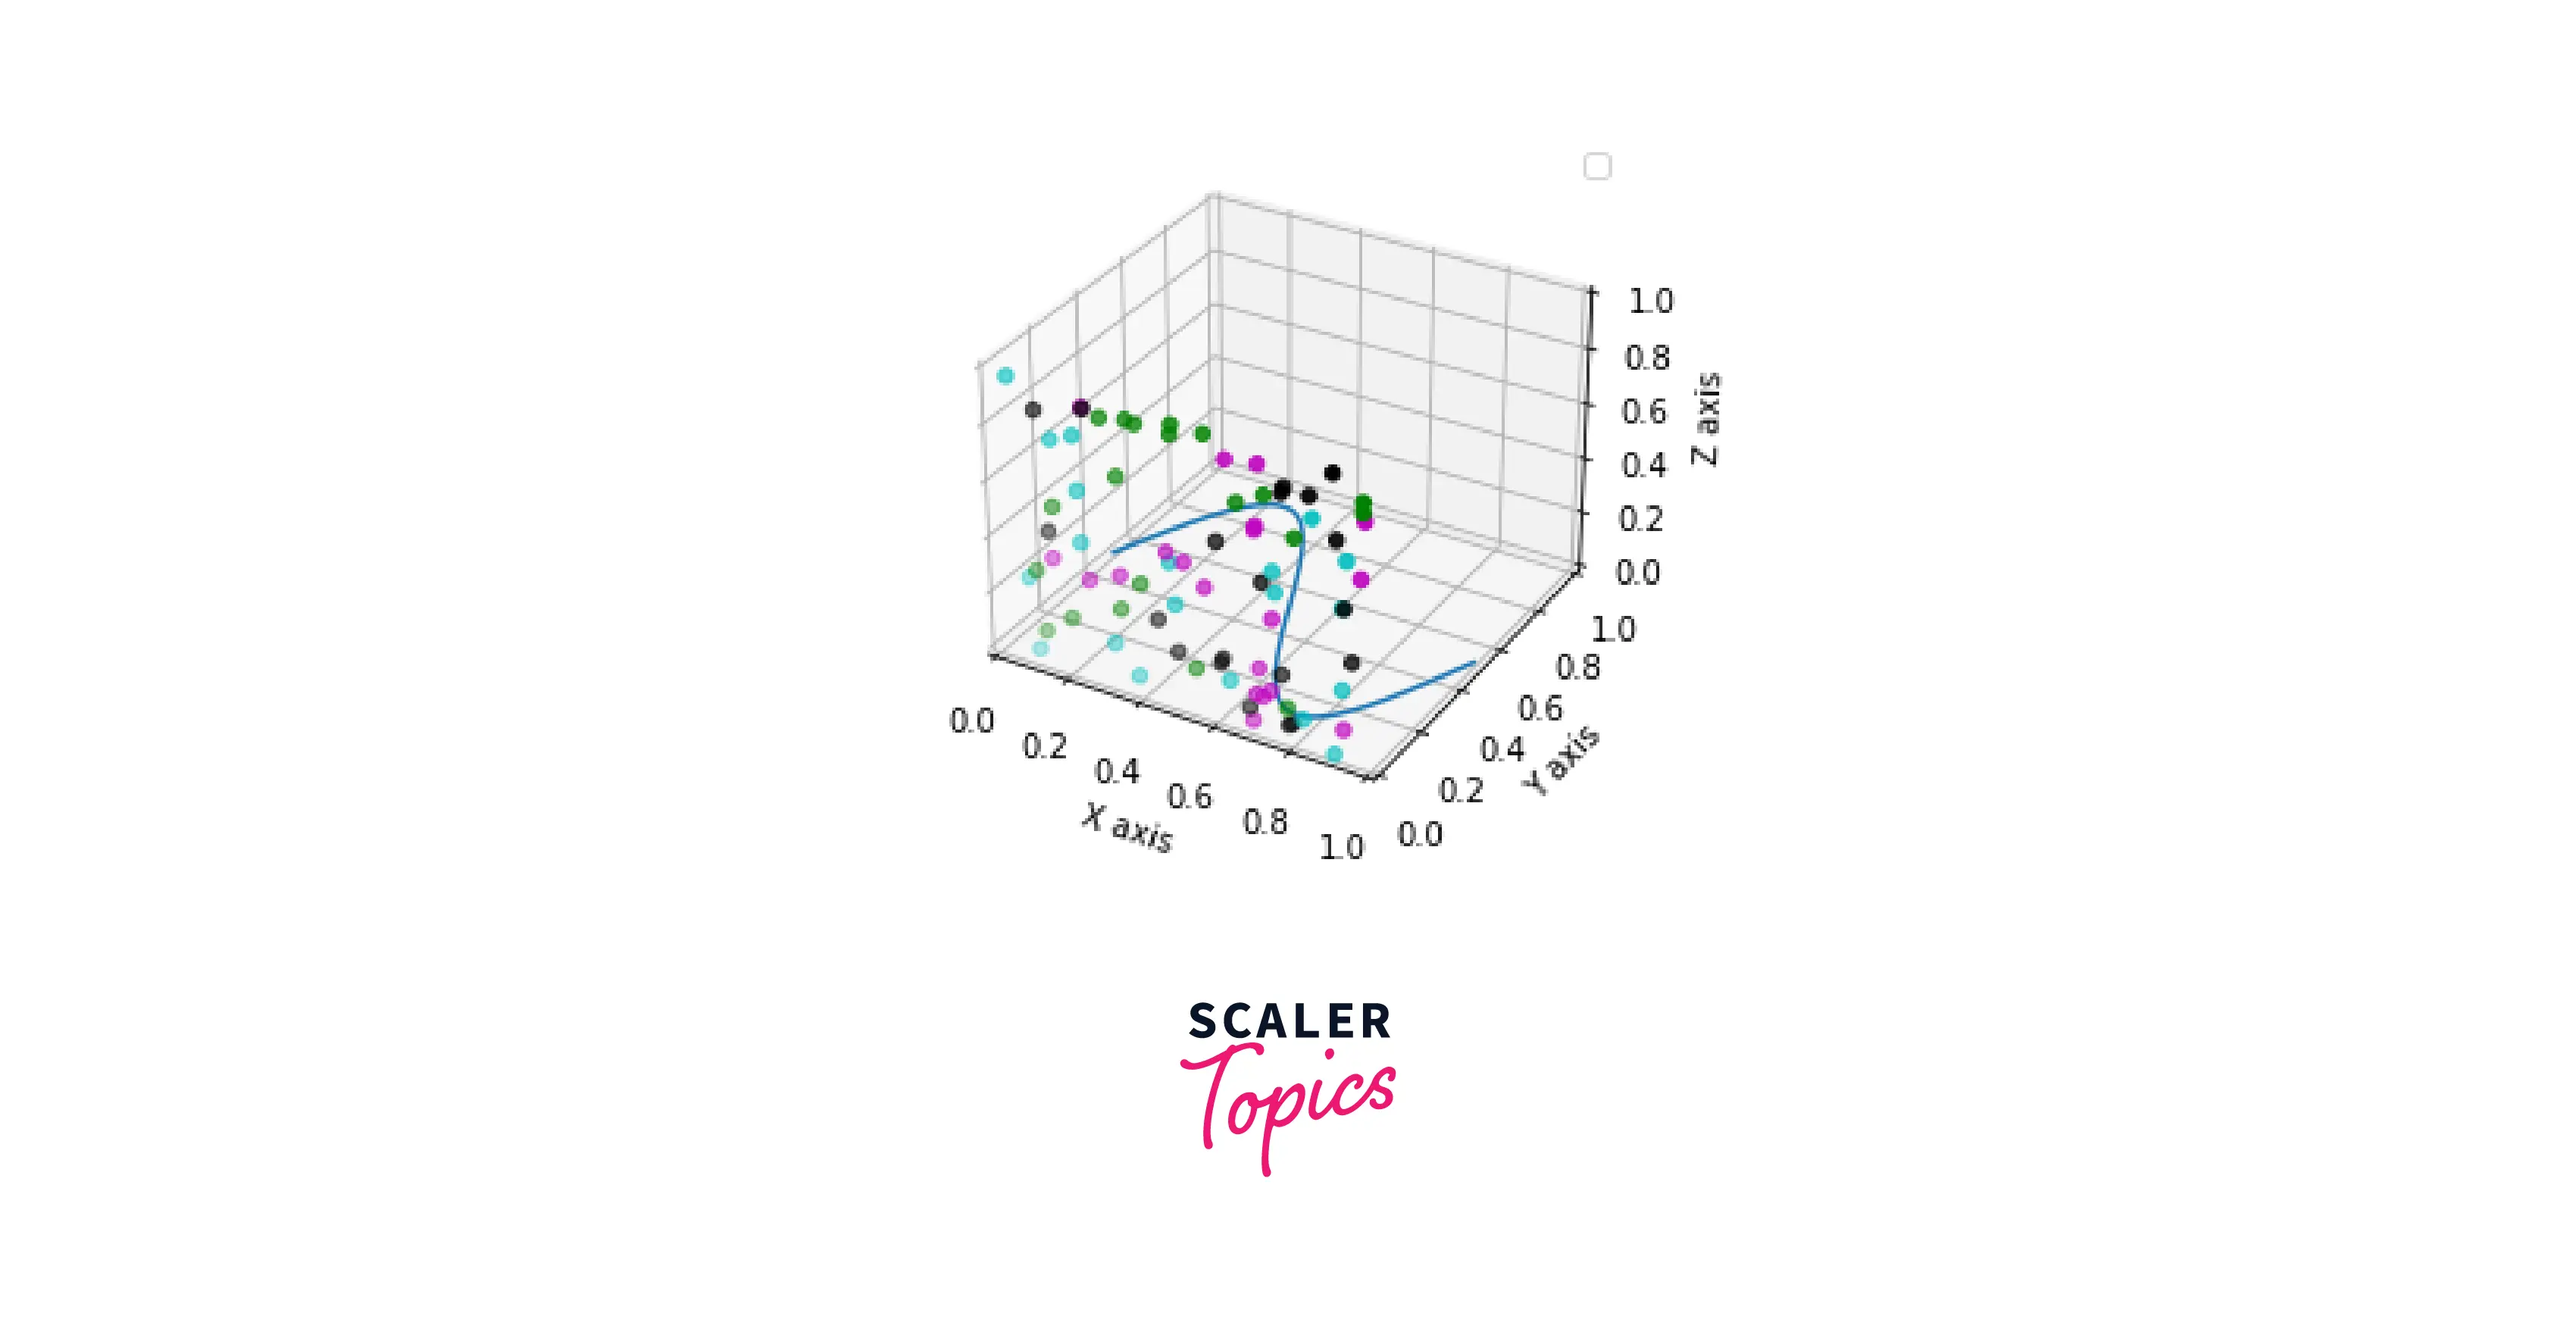
The following example shows how to plot 2D data on specific axes of a 3D plot using the zdir keyword of the plot() method.
Output:
Example 2:
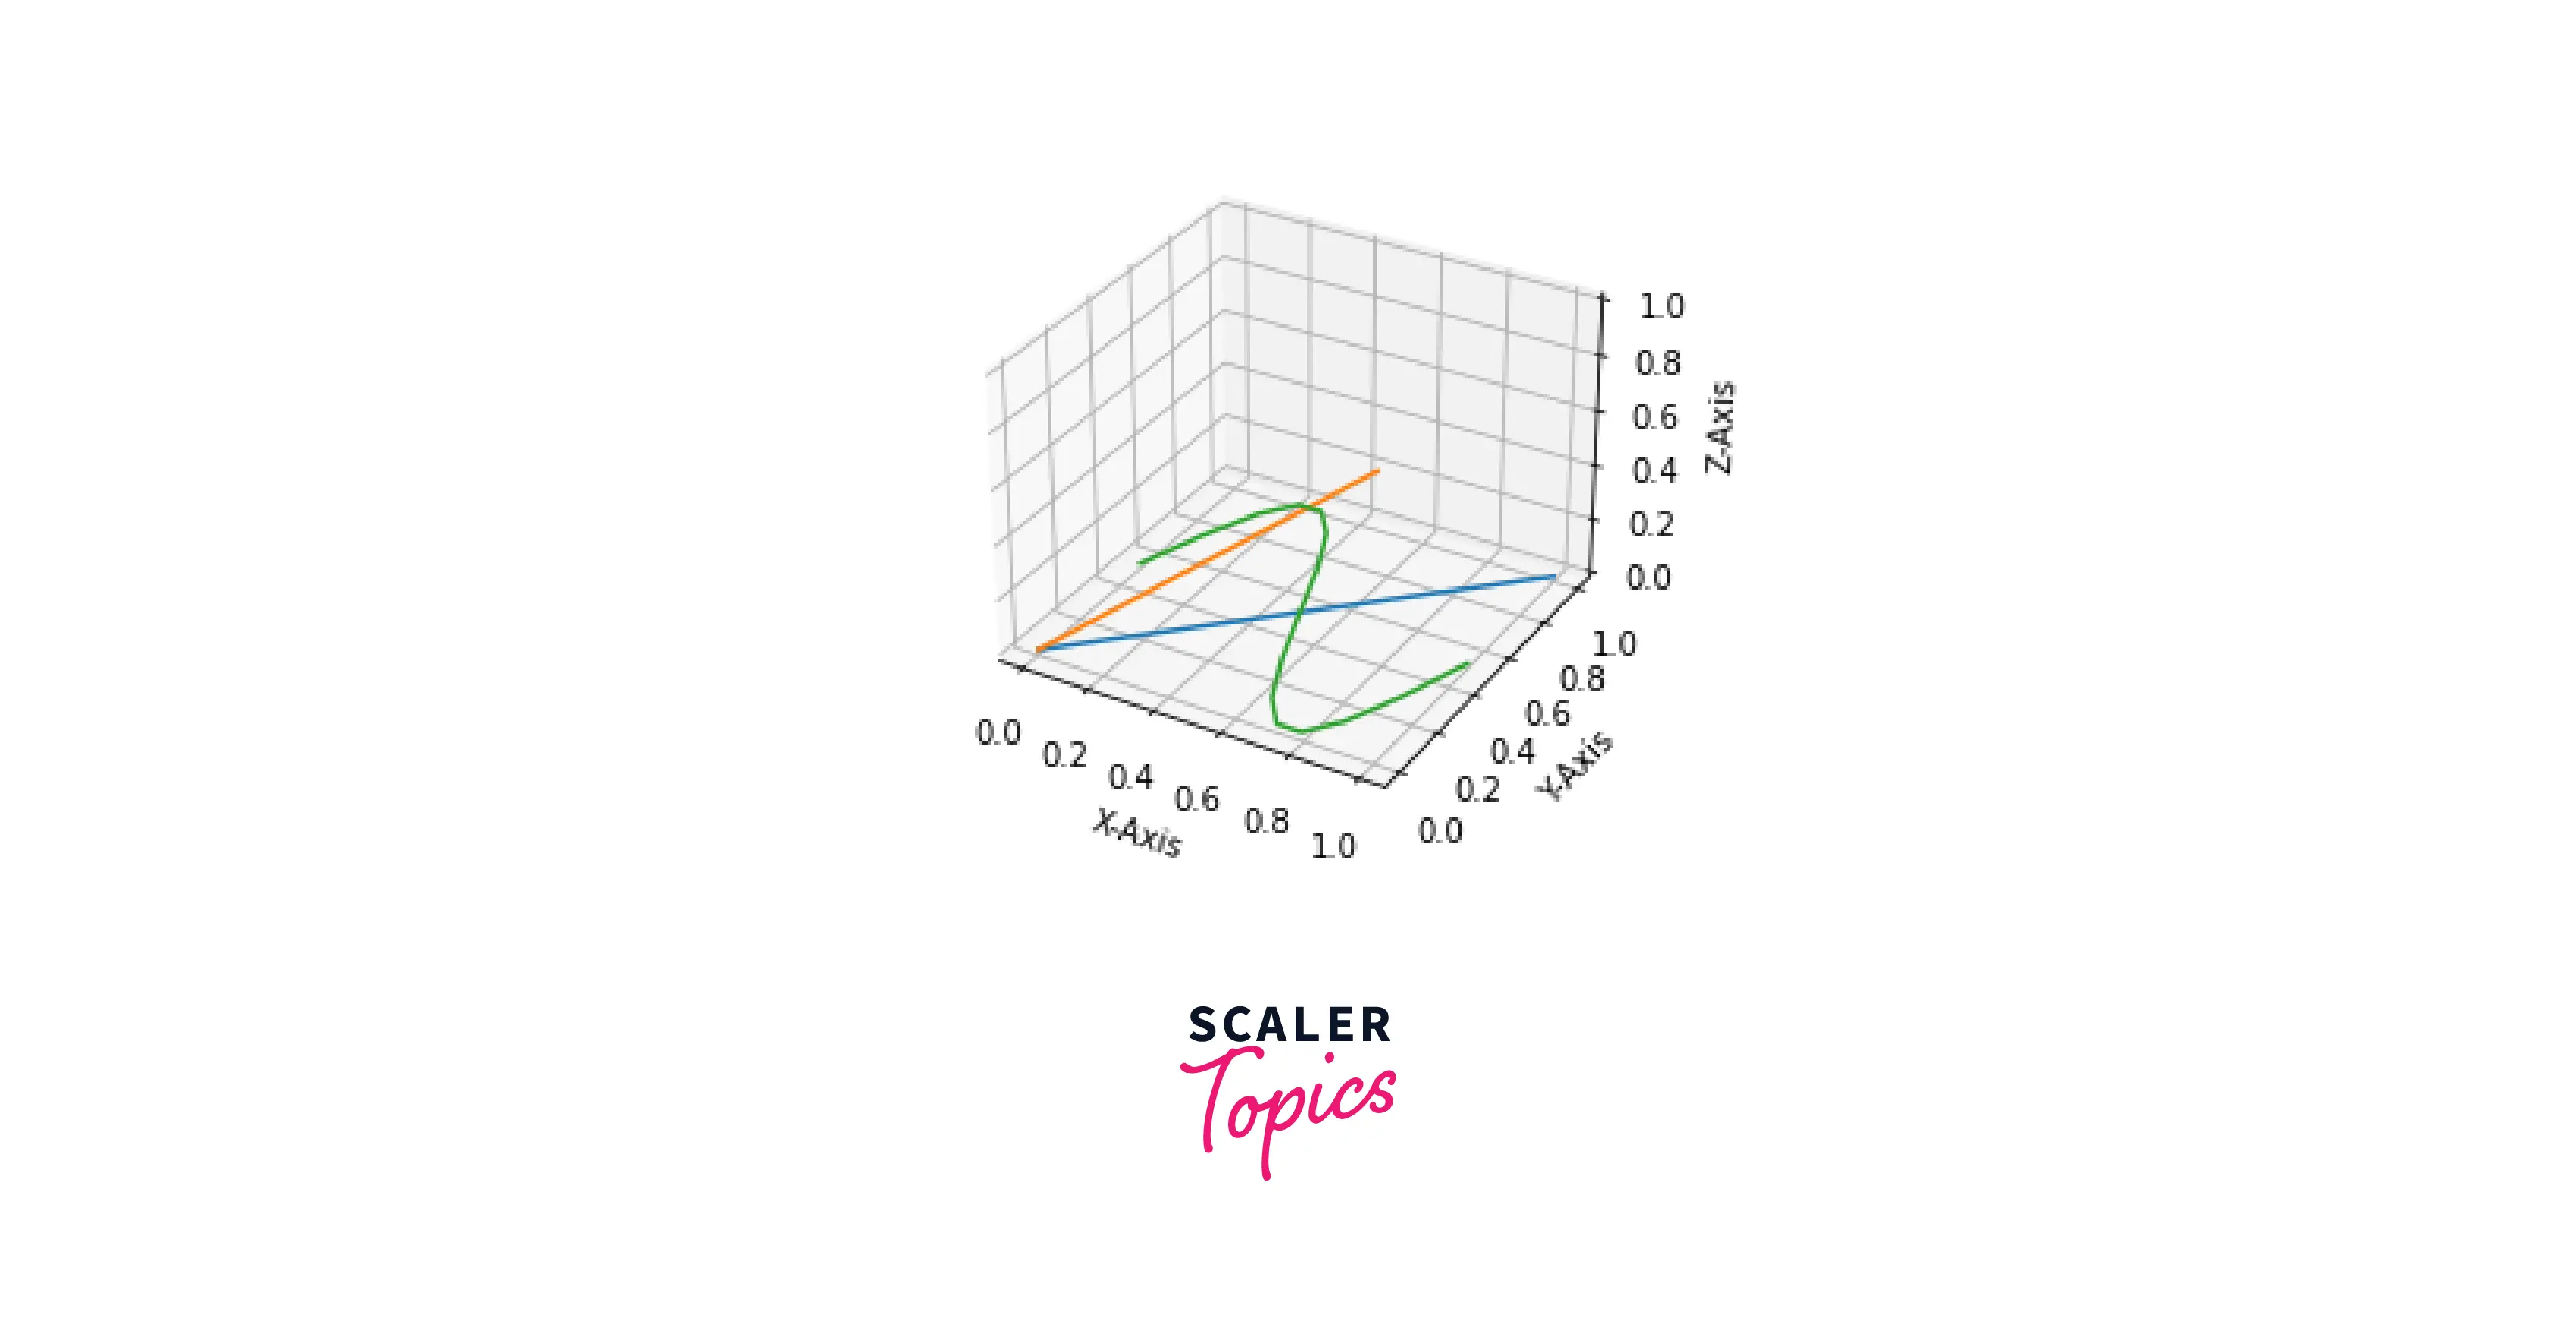
An example demonstrates the plotting of 2D lines on 3D axes.
Output:
Conclusion
- Matplotlib’s mplot3d toolkit enables 3D visualization in Python.
- With the plot() function, we can plot both 2D and 3D data.
- Along with the 3D axes creation routine, we can embed a 2D figure using the plot() method.
- Two key parameters of the plot() function, used for embedding a 2D figure in a 3D figure are zdir and zs.