How to Create and Control Makers in Matplotlib?
Overview
There are numerous ways to control or manipulate our plots using Matplotlib in Python; we can control the axes, layouts, backgrounds, patterns, etc. But an important concept for any aspiring Data Analyst would be creating and controlling plot markers in matplotlib.
Transform Your Career
Choose from our industry-leading programs designed for career success
Modern Software and AI Engineering Program
Master full-stack development with AI integration

Modern Data Science and ML with specialisation in AI
Advanced data science techniques with AI specialization
Advanced AIML with Specialisation in Agentic AI
Deep dive into AIML with focus on Agentic systems
DevOps, Cloud & AI Platform Engineering
Build and manage AI-powered cloud infrastructure
AI Engineering Advanced Certification by IIT-Roorkee
Premier AI engineering certification from IIT-Roorkee
Introduction
A unique method of managing markers in Matplotlib graphs is called Matplotlib Marker. Graphs can be customized by employing marker functions because they include several markers and other indicating icons.
Having a good command over markers in matplotlib will enable programmers to create better and more efficient plots in matplotlib!
Scaler Placement Report and Statistics
Scaler learners achieved 2.5x salary growth with average post-Scaler CTC reaching ₹23L.
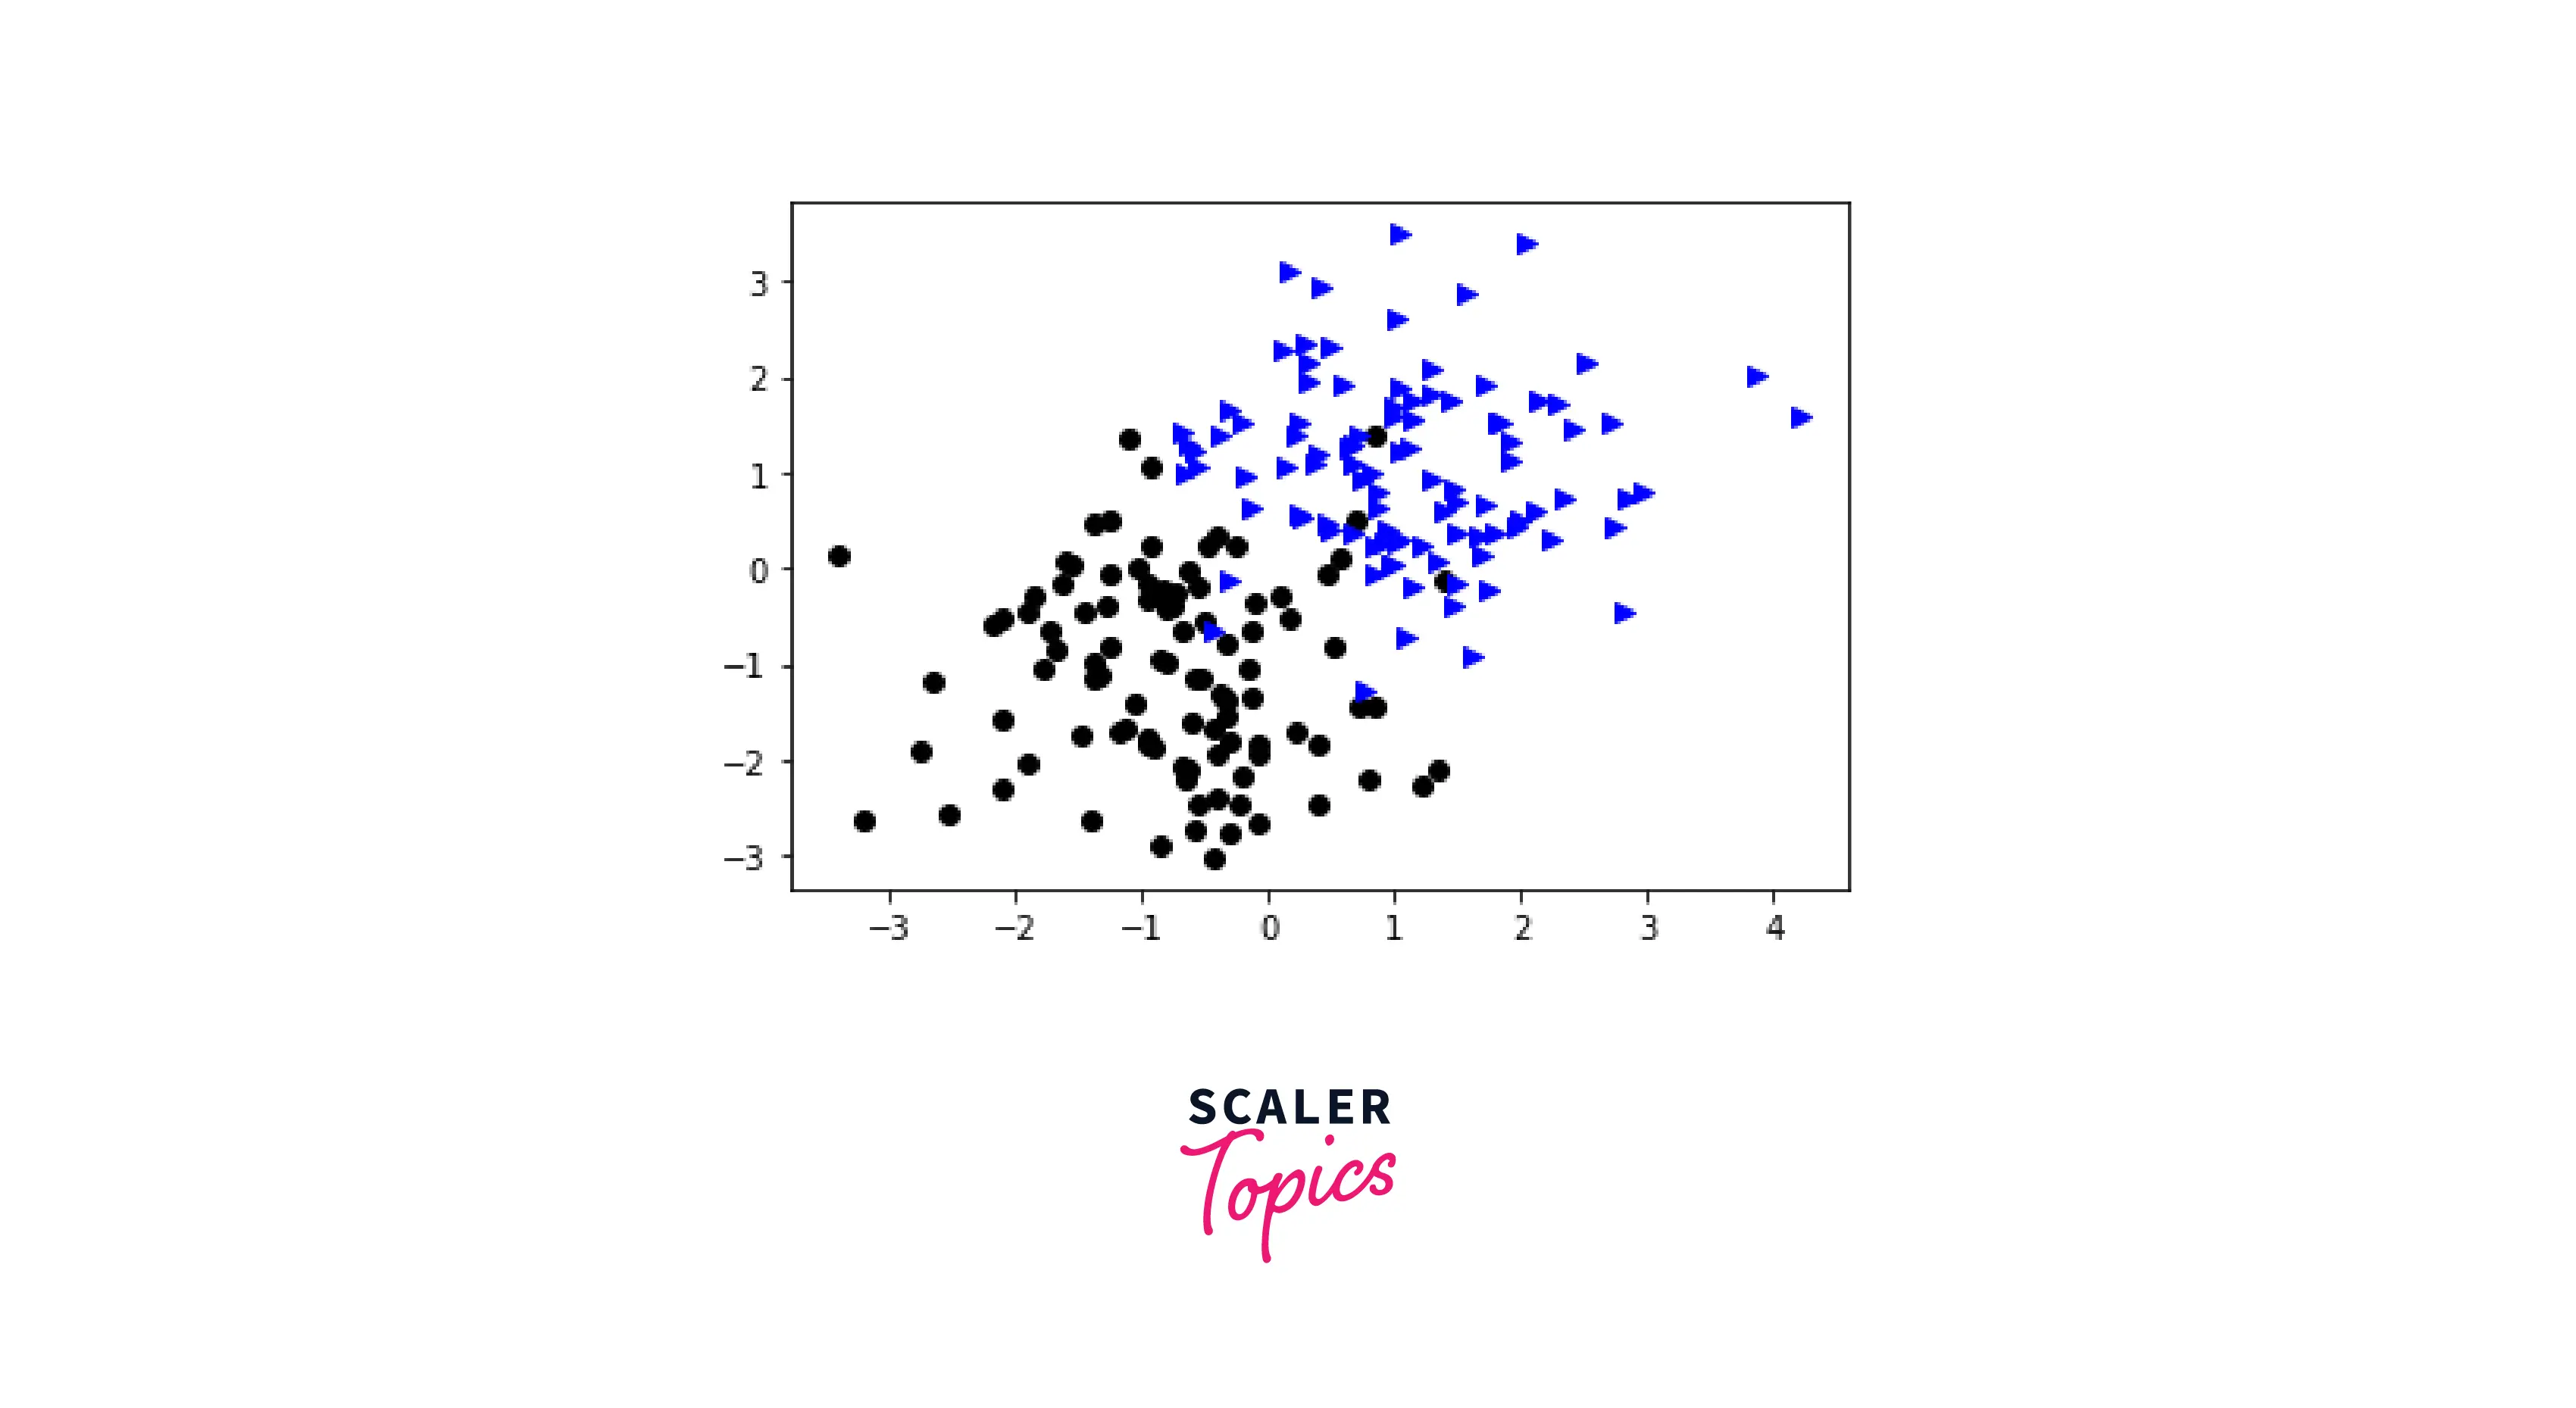
Controlling a marker's style
Many characteristics and functions are available in the Python matplotlib module, allowing us to customize and modify the marker style to suit our needs. There are various ways in which we can specify the style of our markers in matplotlib:
- Predefined markers: They may be predetermined forms, numbers in the [0, 8] range, or strings.
- Polygon: It defines a triplet (N, 0), with an angle rotation, for an N-sided regular polygon.
- Vertices: This collection of value pairs coordinates a shape's route.
- Start Polygon: It illustrates a triplet for an N-sided regular star with an angle-degree rotation (N, 1, angle).
Okay, enough theory! Let's dive into some examples:
Output:
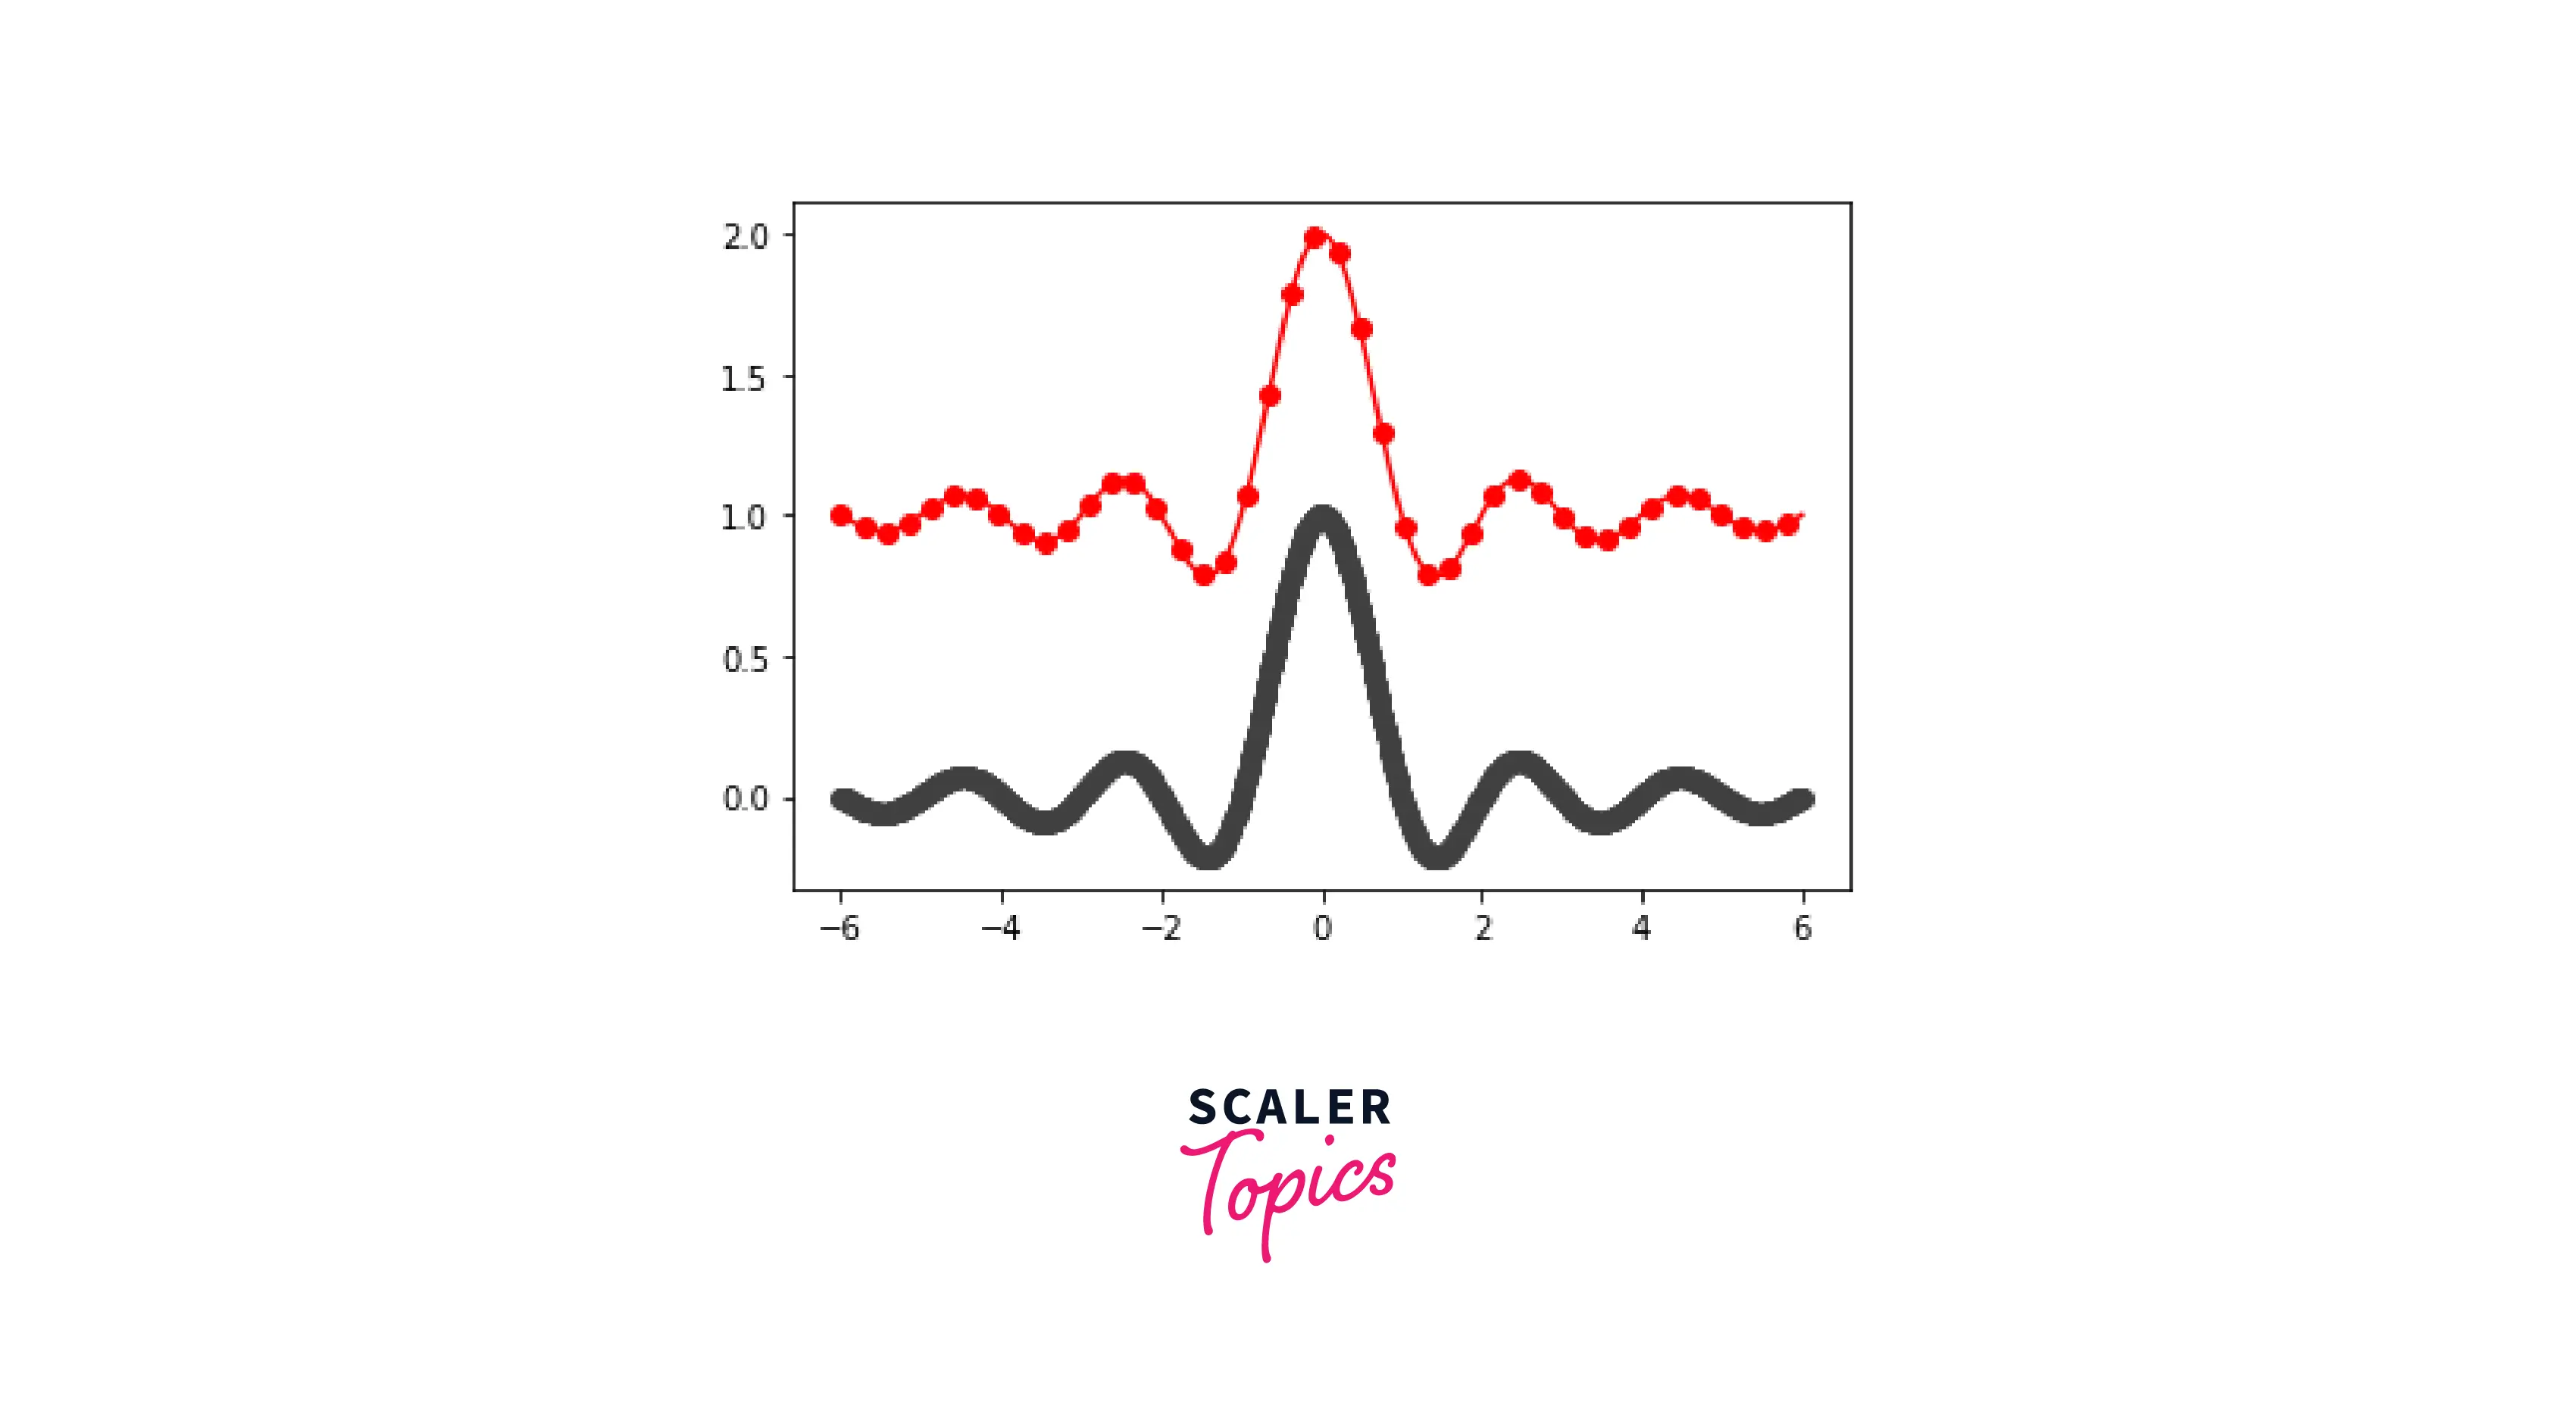
The markevery parameter helps us to represent only the specified marker for every X point. If the value of X is 32, it will ensure that the marker is present after 32 data points.
Output:
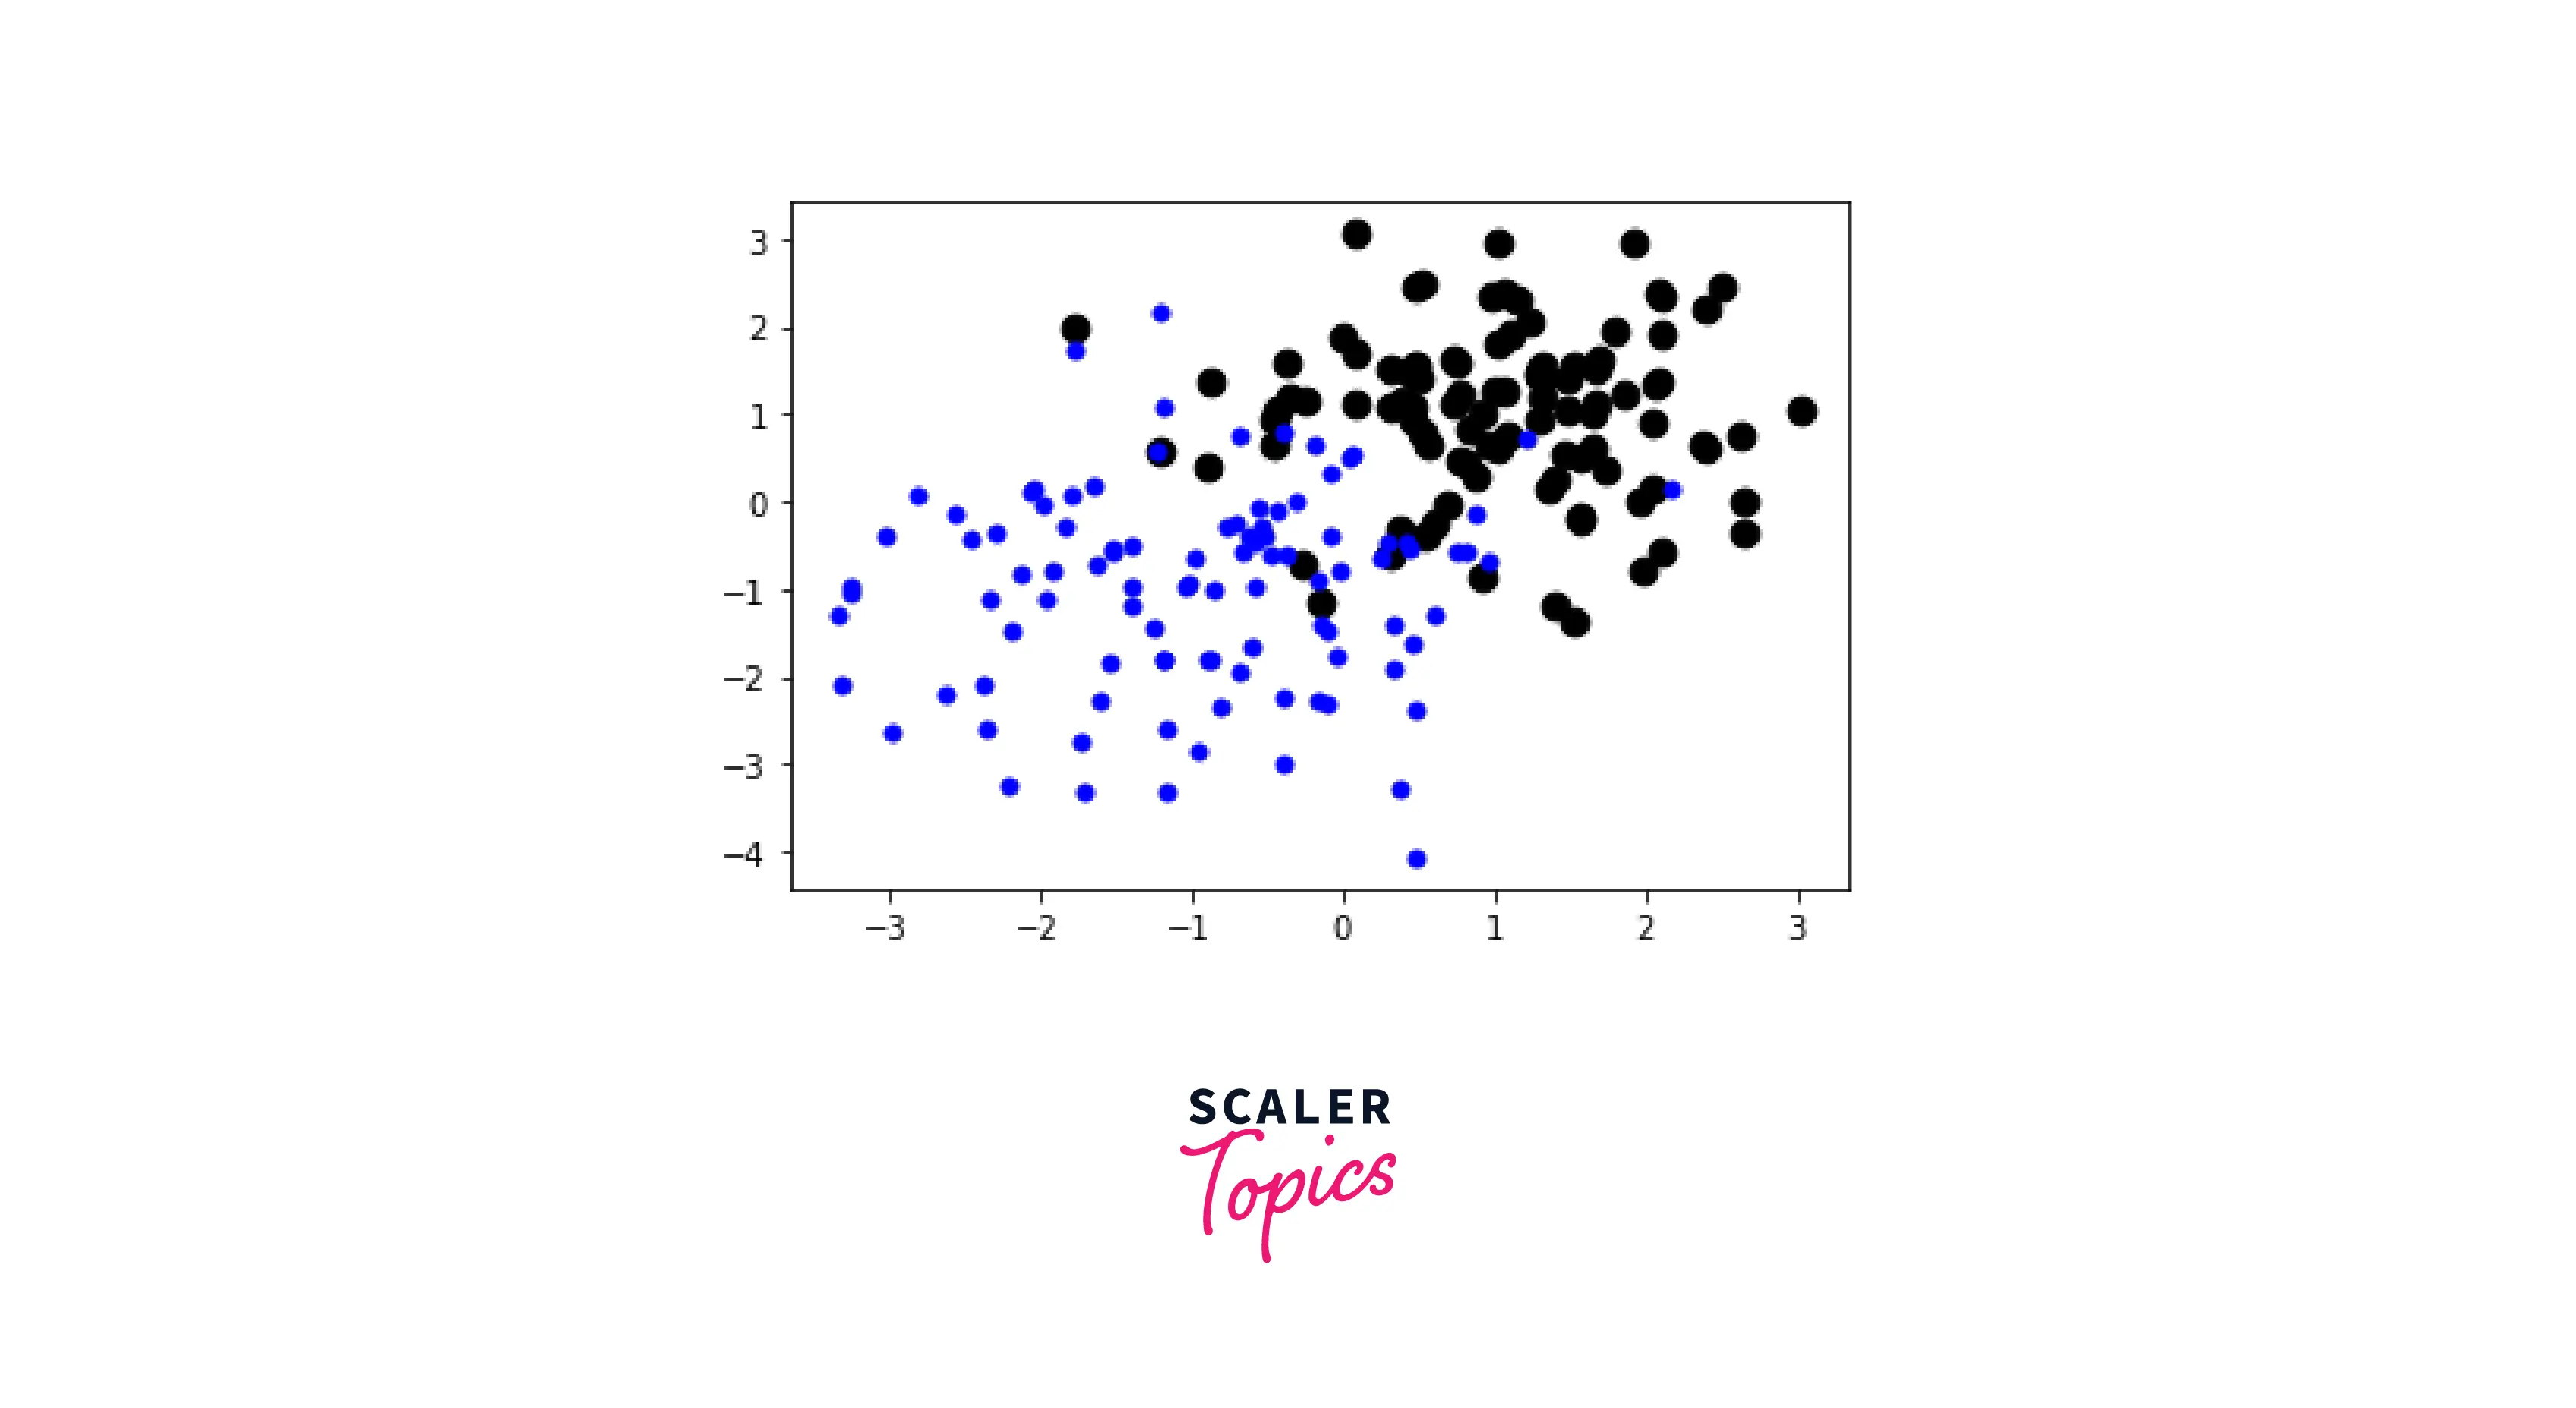
Controlling a Marker's Size
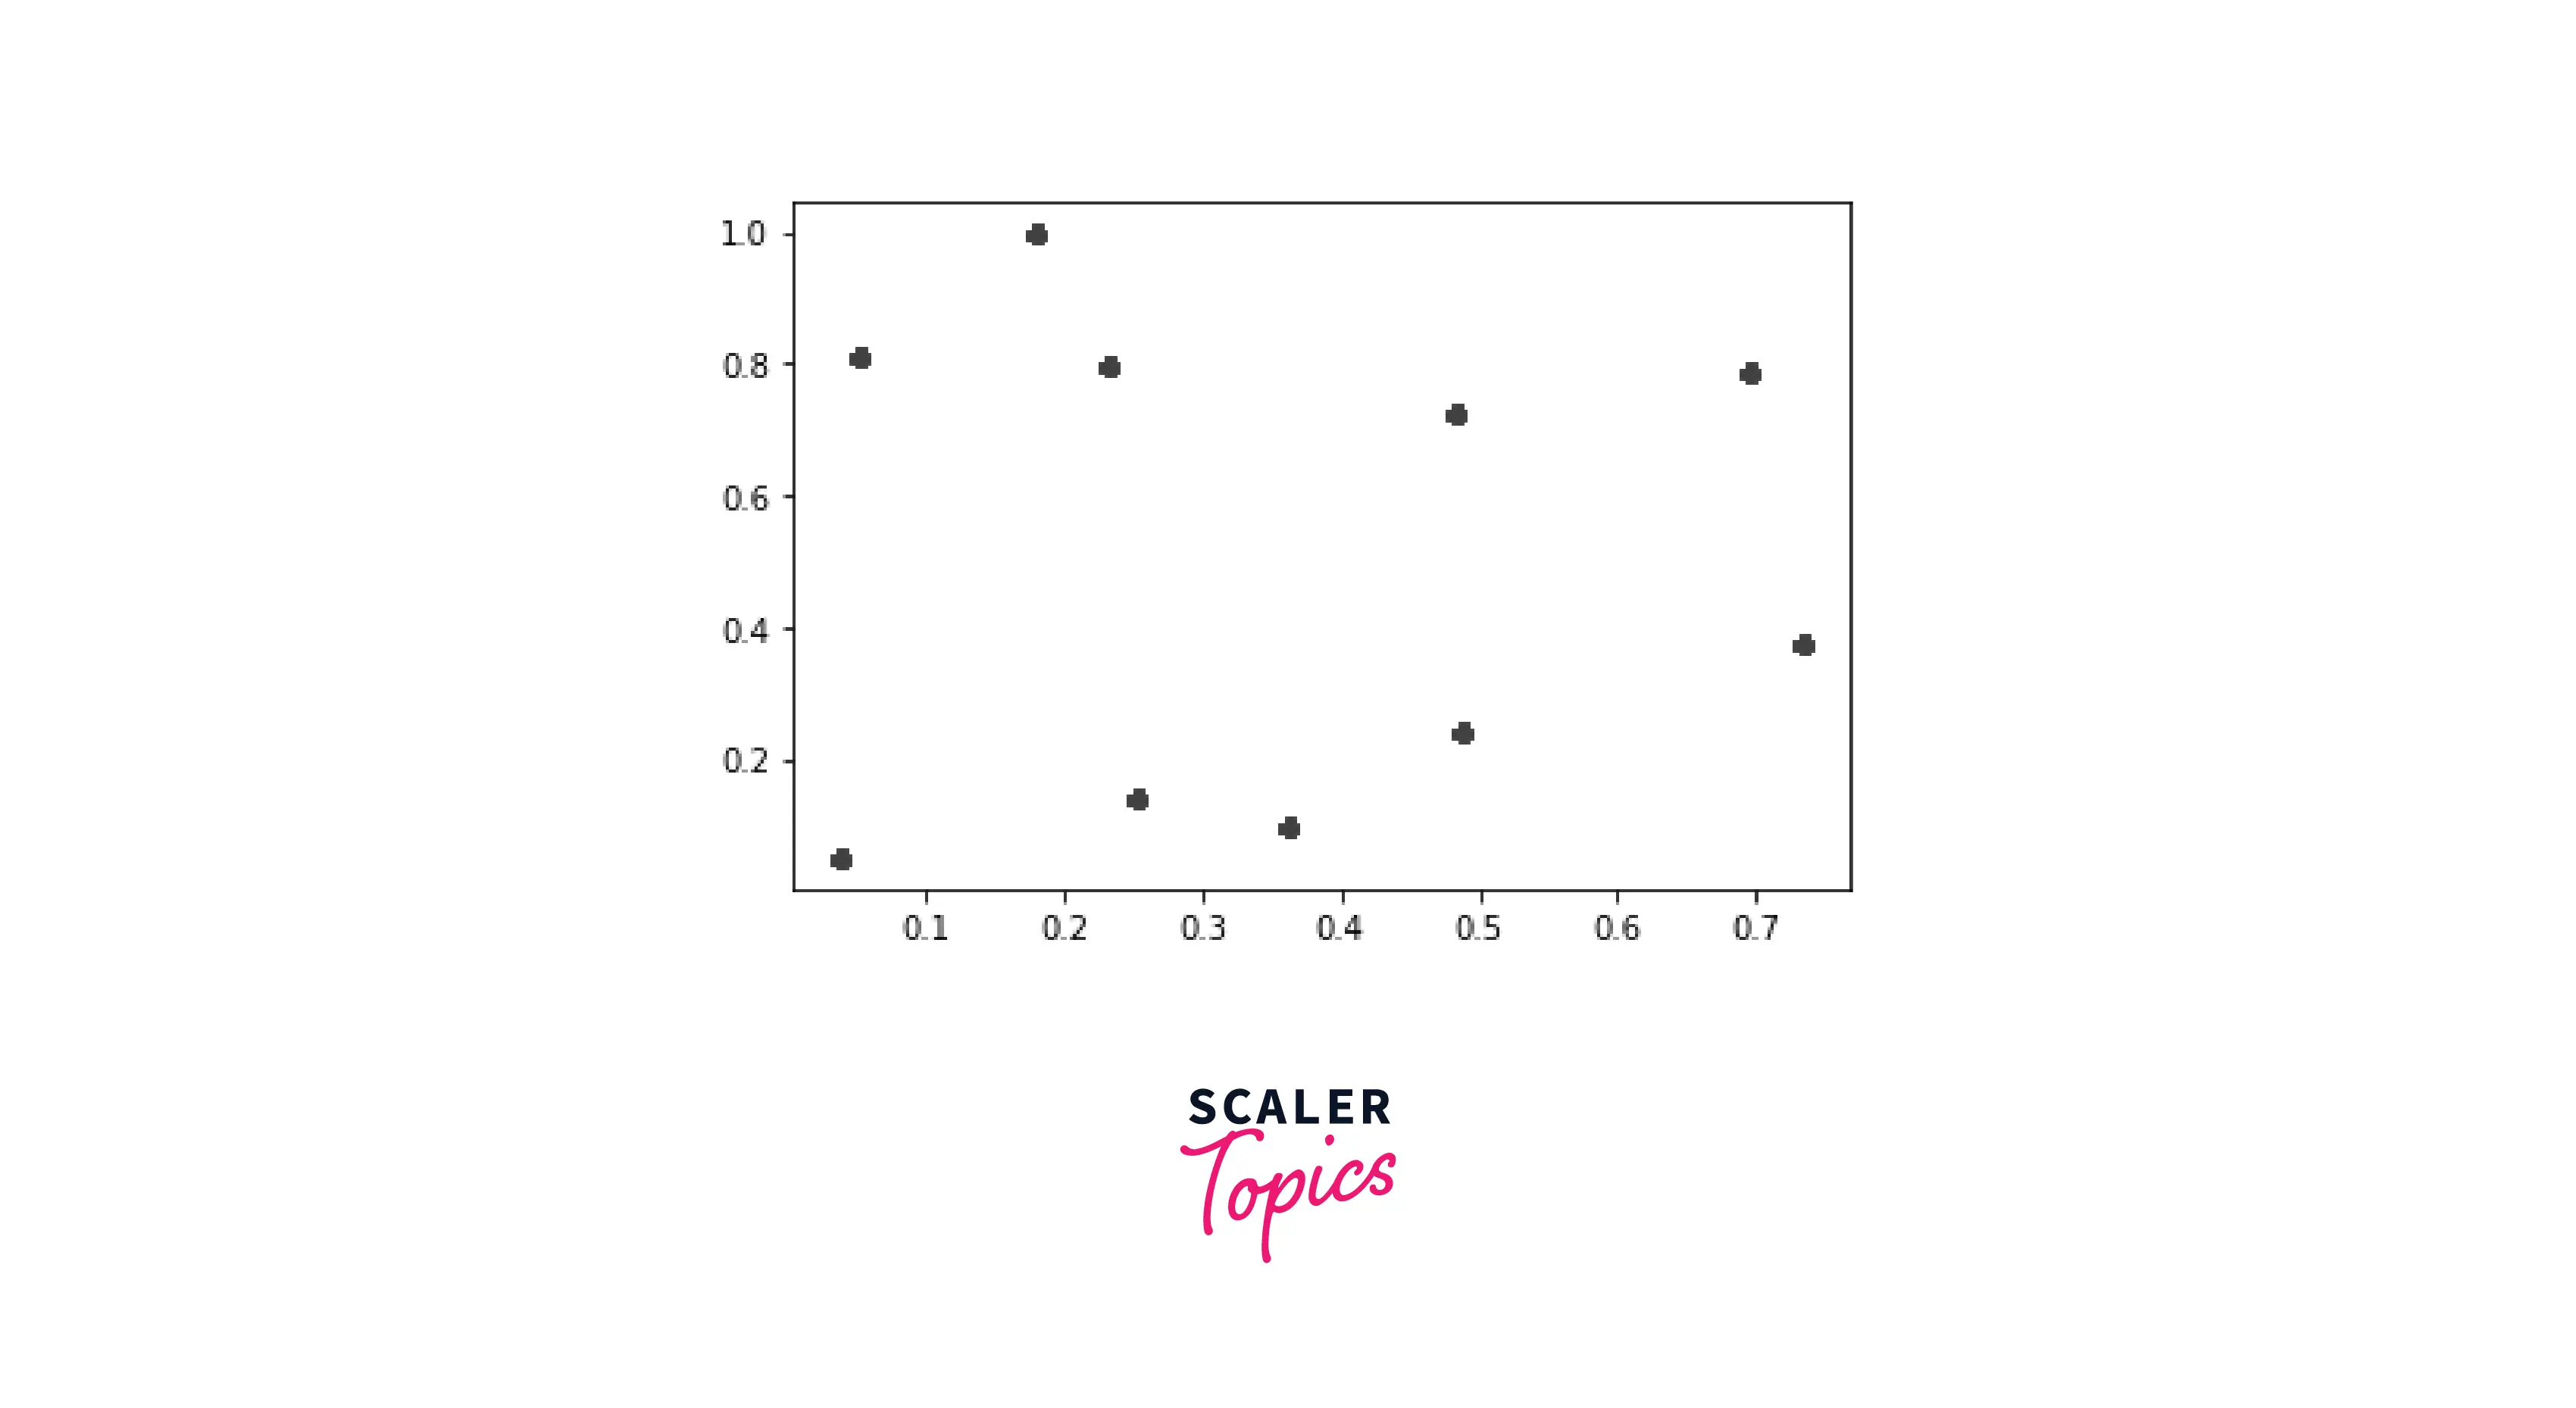
Controlling the size of our markers in matplotlib is a very salient feature, as we can represent differences with it. In the example below, we will have two scatter plots; one with normal markers and one with bigger ones.
Output:
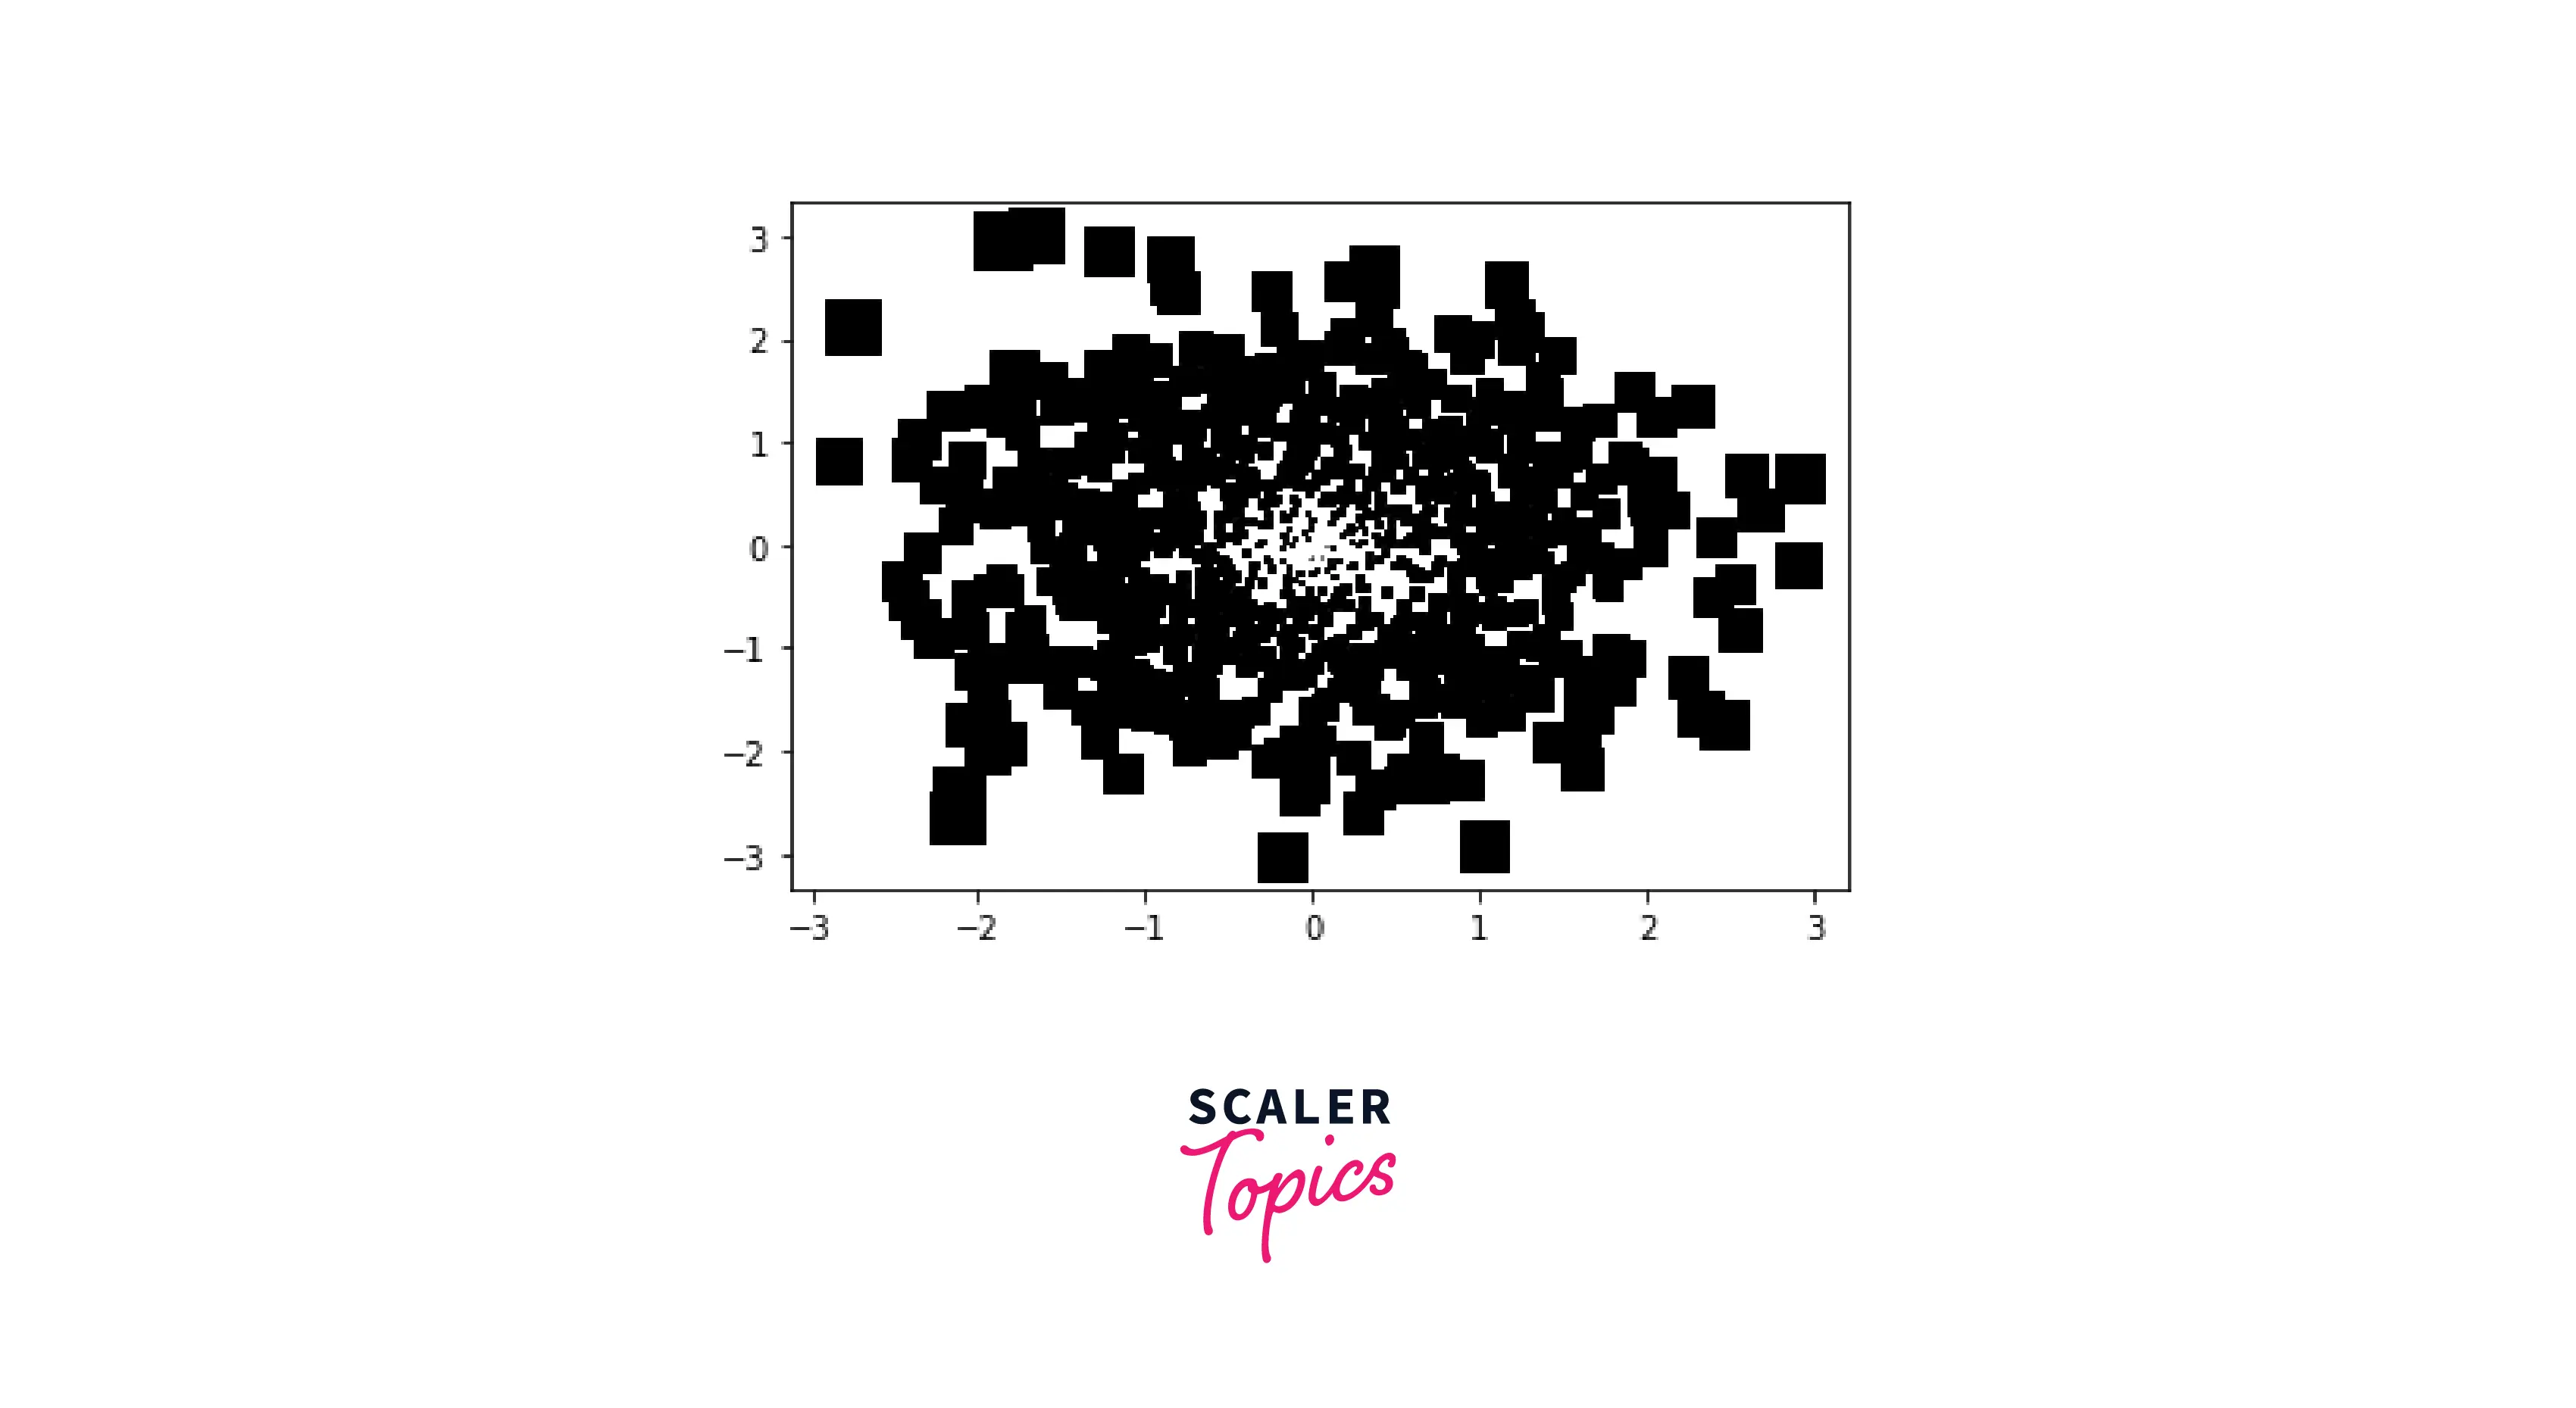
There's an additional parameter in matplotlib when manipulating the size of markers; s. It represents one marker for every "s" point.
Output:
Turn Learning into Career Growth
How to Create Your Markers
There are many different marker shapes available in matplotlib. However, you might be unable to discover something that meets your needs. Suppose you want something better than the standard markers like ' o', '<' and '>'. In scenarios like this, there exists a need for customized markers.
We can get our markers using the mpath library in matplotlib. We will create a list in which we will provide the coordinates of our custom marker. After that, we will zip it, convert it into a Path file, and use it as an attribute for the marker parameter.
One command per coordinate is passed into the function Object() { [native code] } of the Path object along with a list of coordinates. We use a single list called shape description that combines coordinates and instructions rather than having two lists for each.
The three types of instructions mentioned above are:
- MOVETO: The cursor will move to the supplied coordinates because of this instruction; no line is drawn.
- LINETO: This will draw a line while moving the cursor to the supplied coordinates.
- CLOSEPOLY: It won't accomplish anything and will block the way. This directive will lead to the end of your path.
Output:
Getting More Control Over Markers
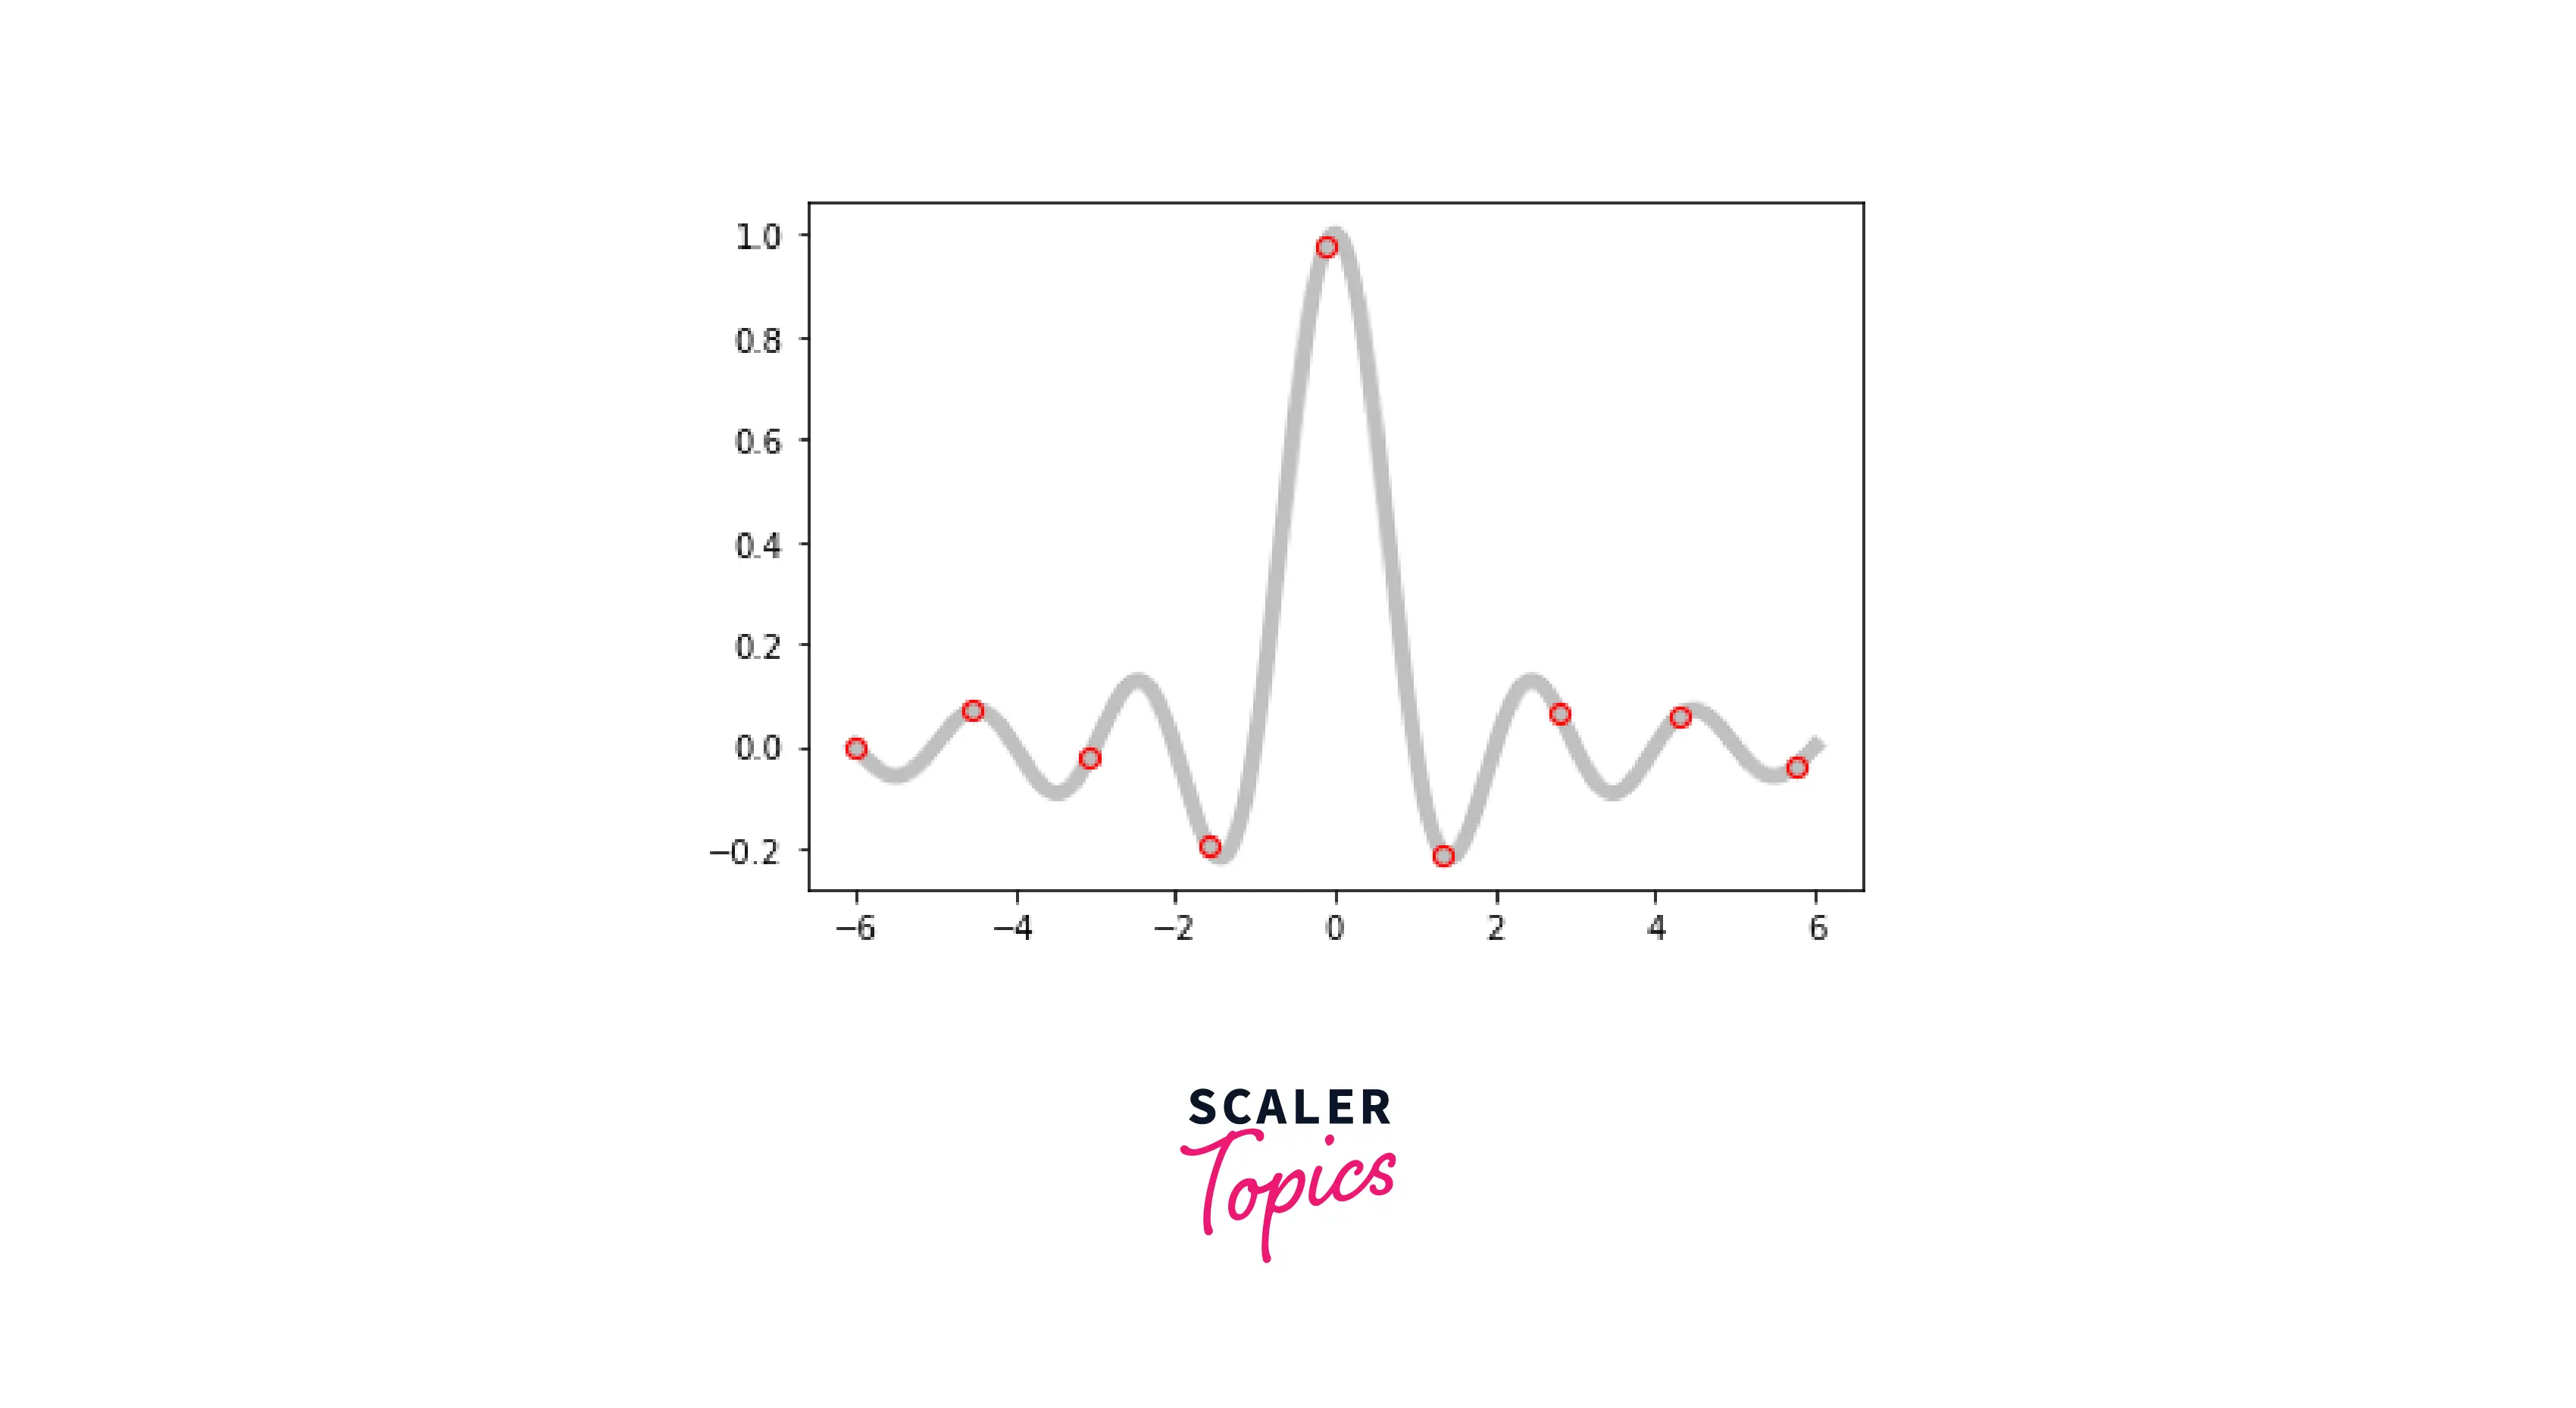
Apart from the regular attributes, matplotlib offers us many more options to control our markers' type, size, and color completely. Some additional attributes are edge color, face color, markevery etc.
Output:
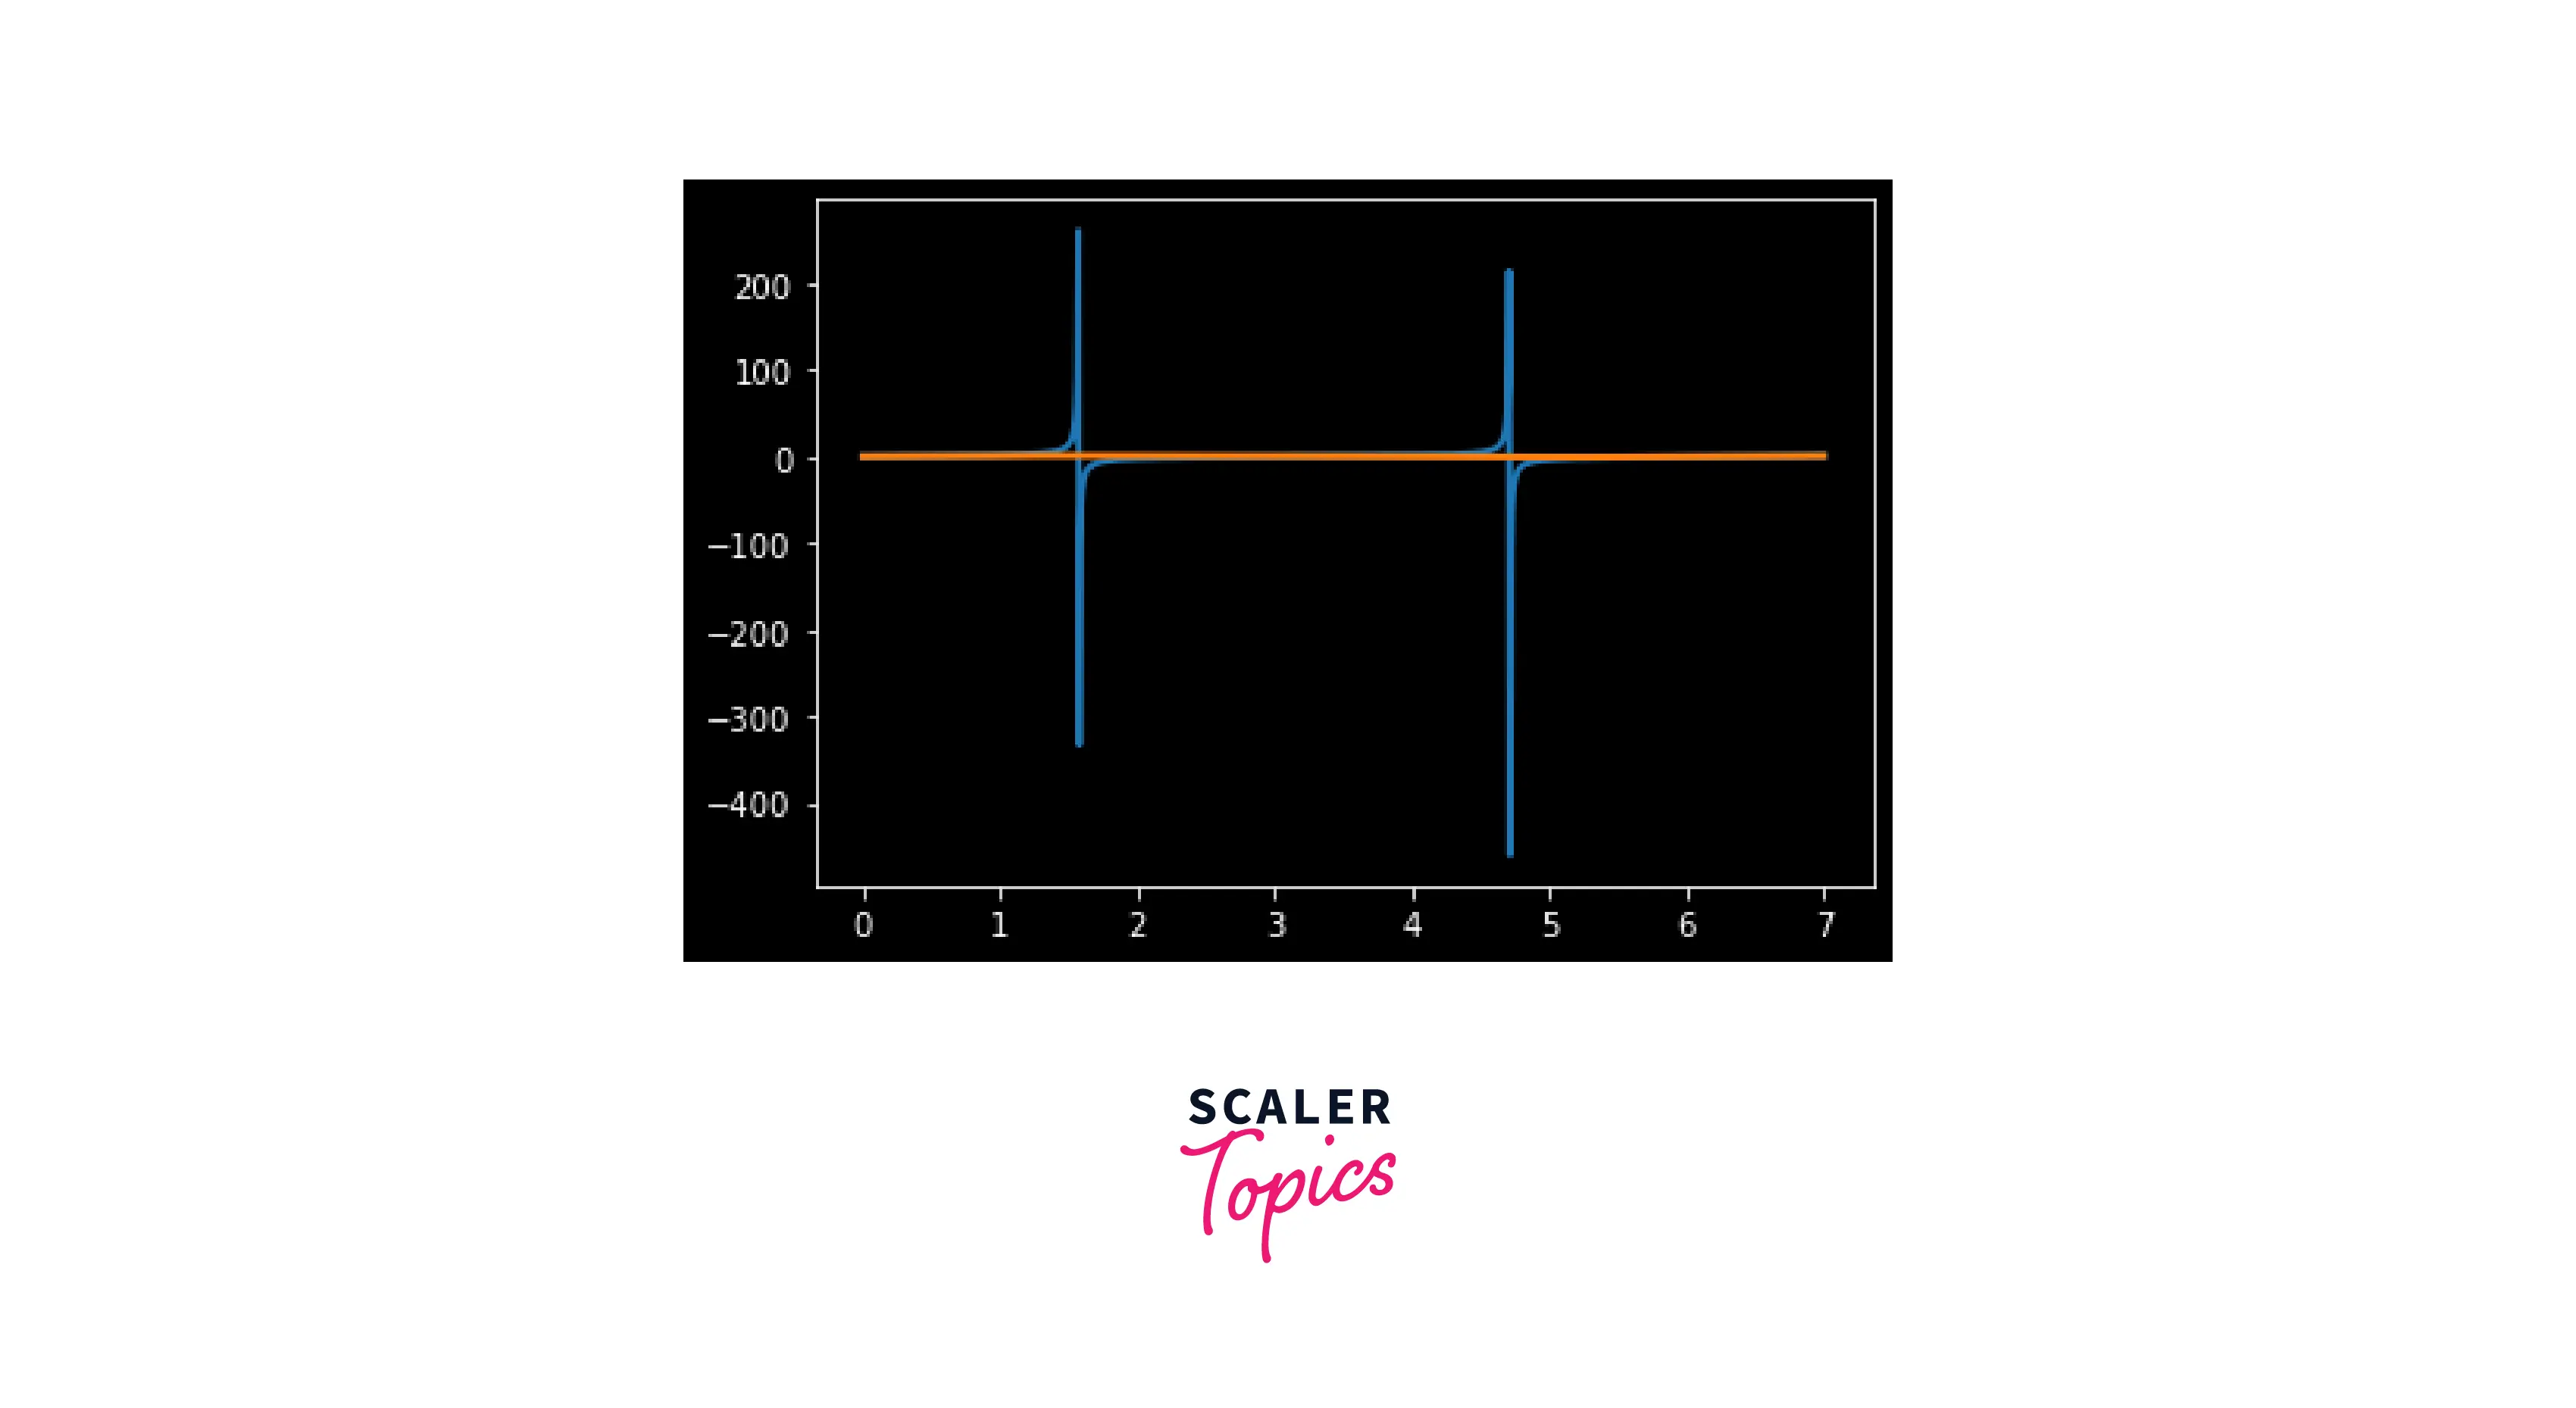
How to Create Your Colour Scheme
We want our plots to be beautiful and devoid of the white background and axes. Sometimes, we want a different plot color scheme and a different theme to make it easier to read.
Axes, figures, and labels are just a few objects that can be addressed separately with matplotlib. However, it would take a lot of time and effort to change the color settings of each item individually.
A centralized configuration object allows all matplotlib objects to select their default colors.
Output:
Conclusion
In this article, we have covered:
- Different methods and ways of controlling the size and style of markers in matplotlib.
- Adding to this, we also covered how to create our markers from scratch and implement it.
- We learned how to generate our color scheme for our markers in matplotlib.