How to Plot a 2D Vector Field in Matplotlib?
Overview
Every plot created using Matplotlib aims to present data in a meaningful way. Python's Matplotlib module provides a complete and powerful tool for building static, animated, and interactive visualizations. Hence, it has built-in functions to help us display data according to their relevance.
One of the trickiest concepts in advanced mathematics is the concept of vector fields, which combines vectors with graphs and visualizations. Using Matplotlib, we will learn various ways to visualize and infer decisions off 2D vector fields.
Transform Your Career
Choose from our industry-leading programs designed for career success
Modern Software and AI Engineering Program
Master full-stack development with AI integration

Modern Data Science and ML with specialisation in AI
Advanced data science techniques with AI specialization
Advanced AIML with Specialisation in Agentic AI
Deep dive into AIML with focus on Agentic systems
DevOps, Cloud & AI Platform Engineering
Build and manage AI-powered cloud infrastructure
AI Engineering Advanced Certification by IIT-Roorkee
Premier AI engineering certification from IIT-Roorkee
Introduction
As discussed earlier in this article, one of the most powerful and well-built modules in Python for plotting and visualizing data is Matplotlib. It is home to many plot types, color scales, etc that give a developer complete command over a graph.
Vector Fields can be summed up as a physical embodiment of vectors using a subset of space. Vectors, which are abstract concepts, are made alive using space. It can look like a daunting concept at first, but we can make it look easy by using visualization. Let's unravel vector fields and how we plot them using Matplotlib.
What are Vector Fields?
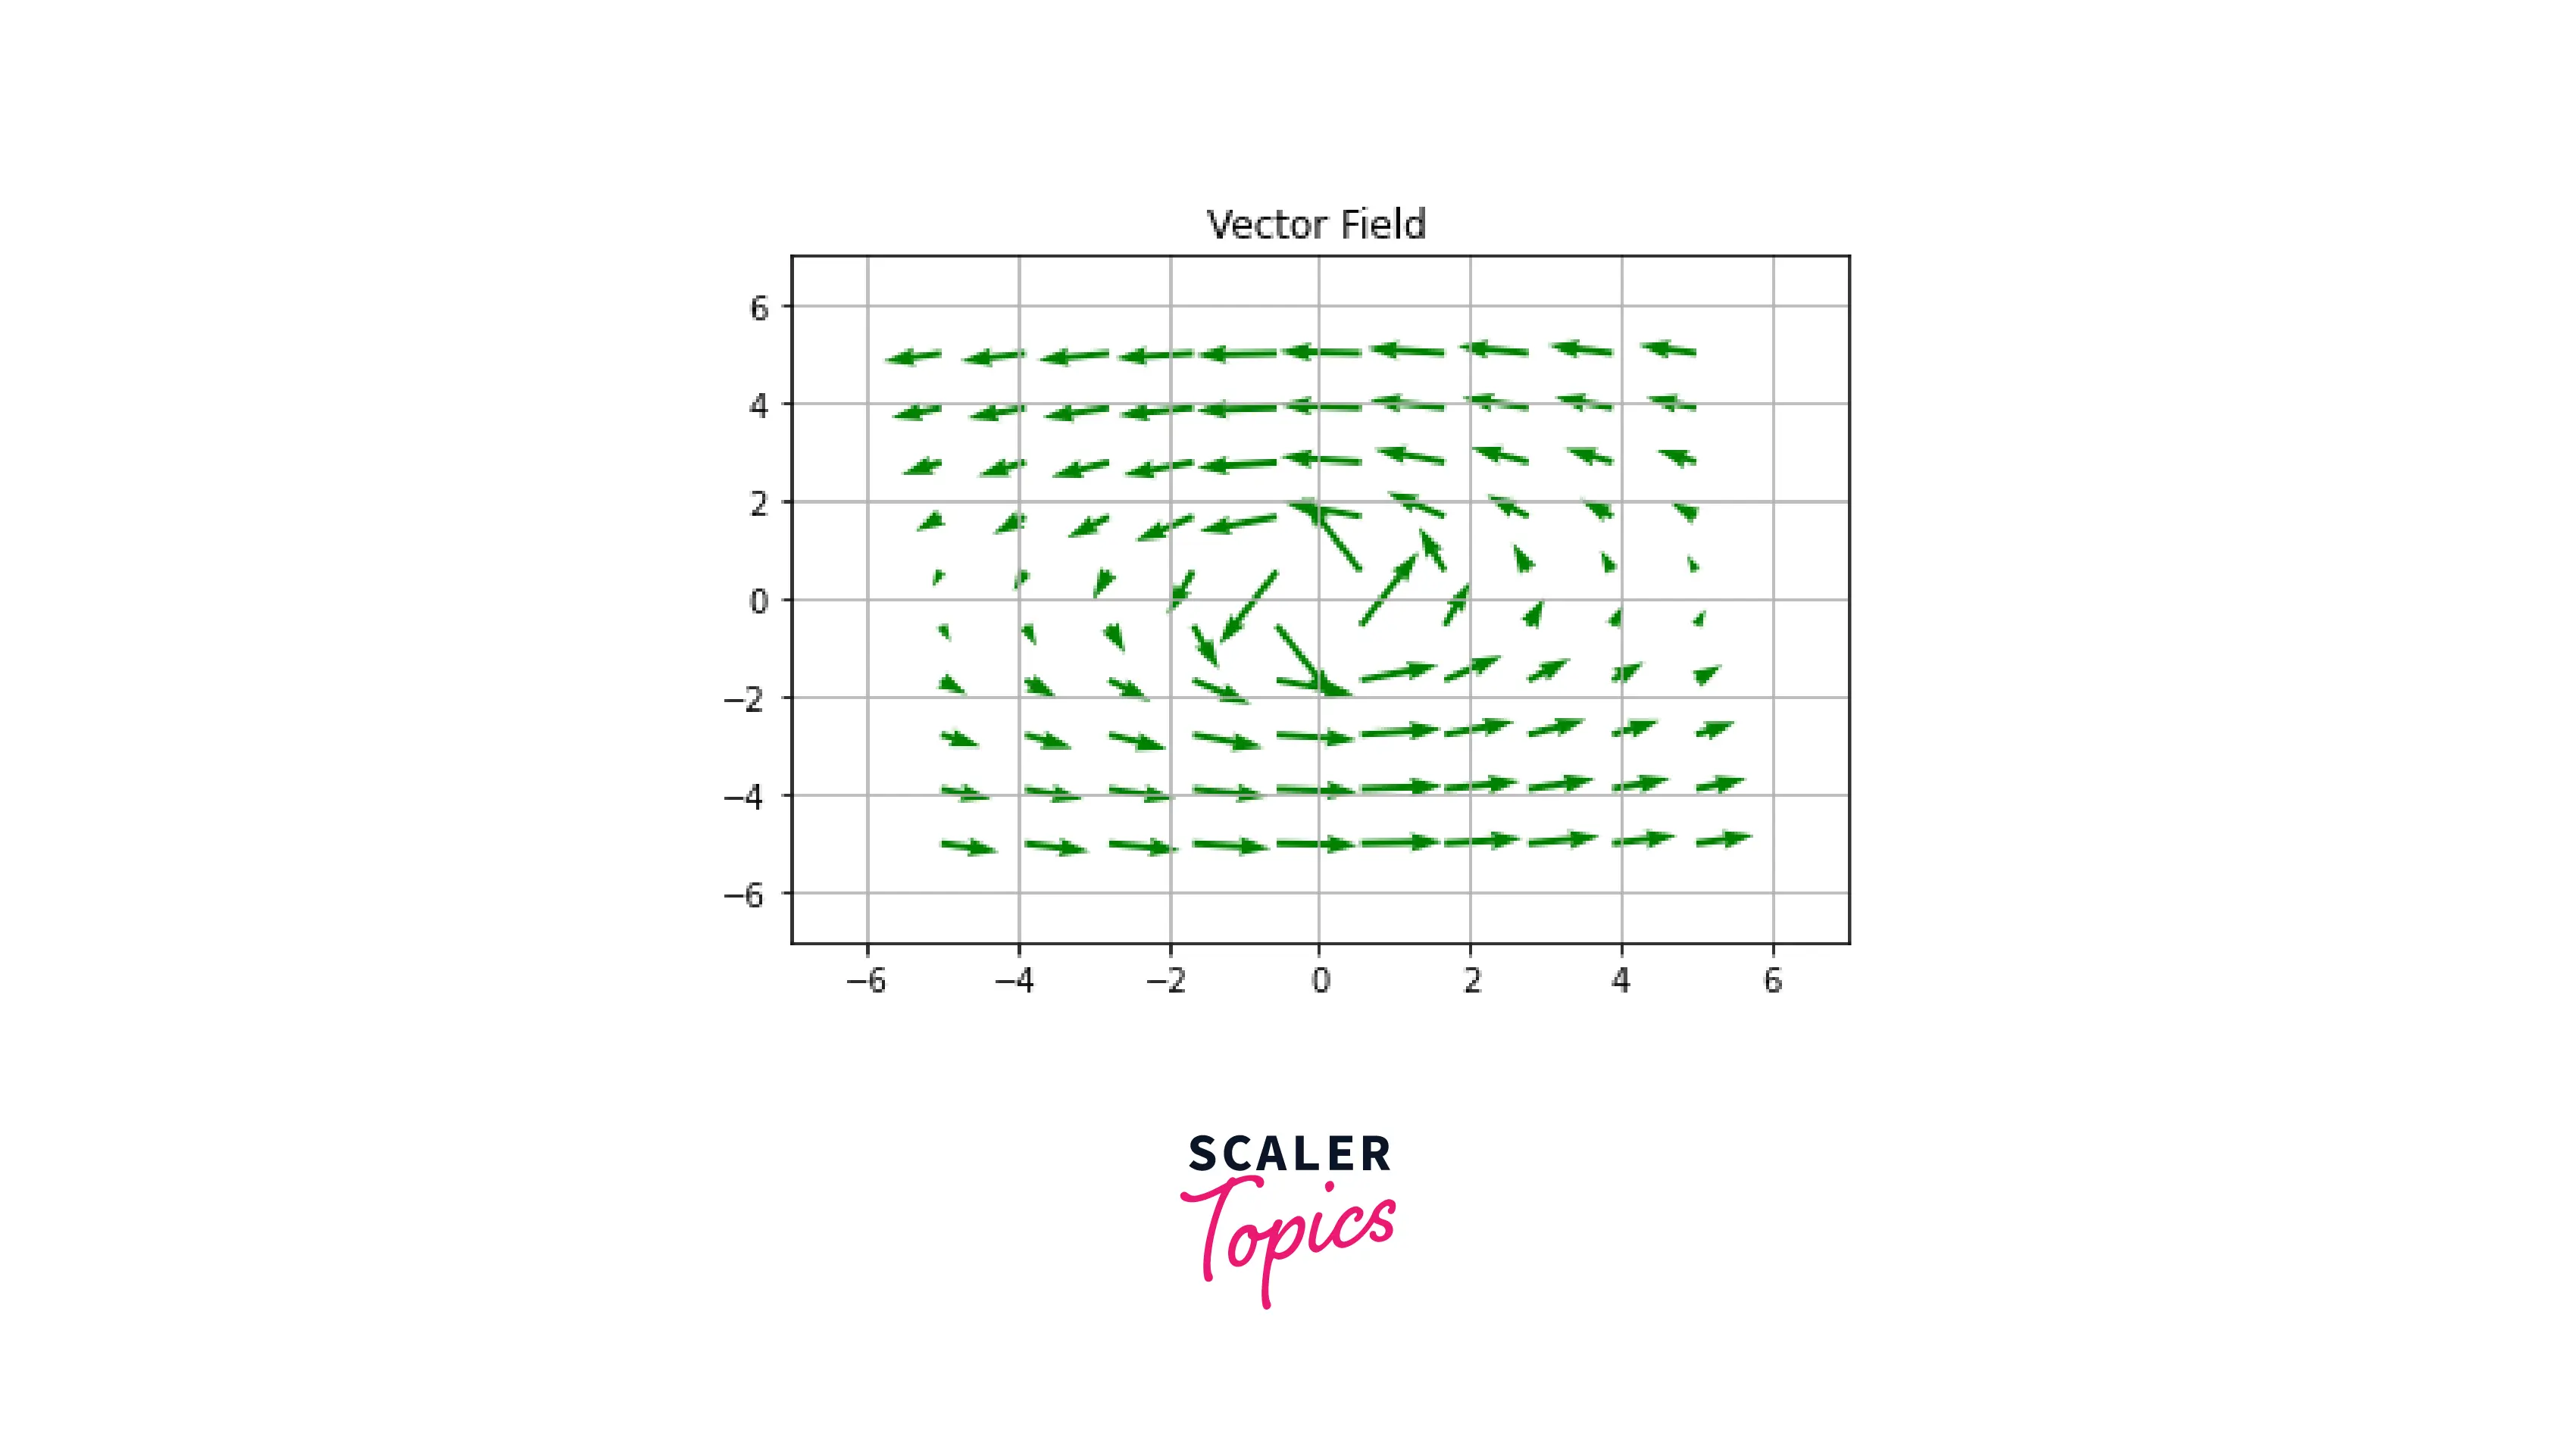
Vector Fields are a multi-dimensional representation of direction and magnitude. They are represented in a space, which makes them easier to visualize. Here's an example of a 2D vector field:
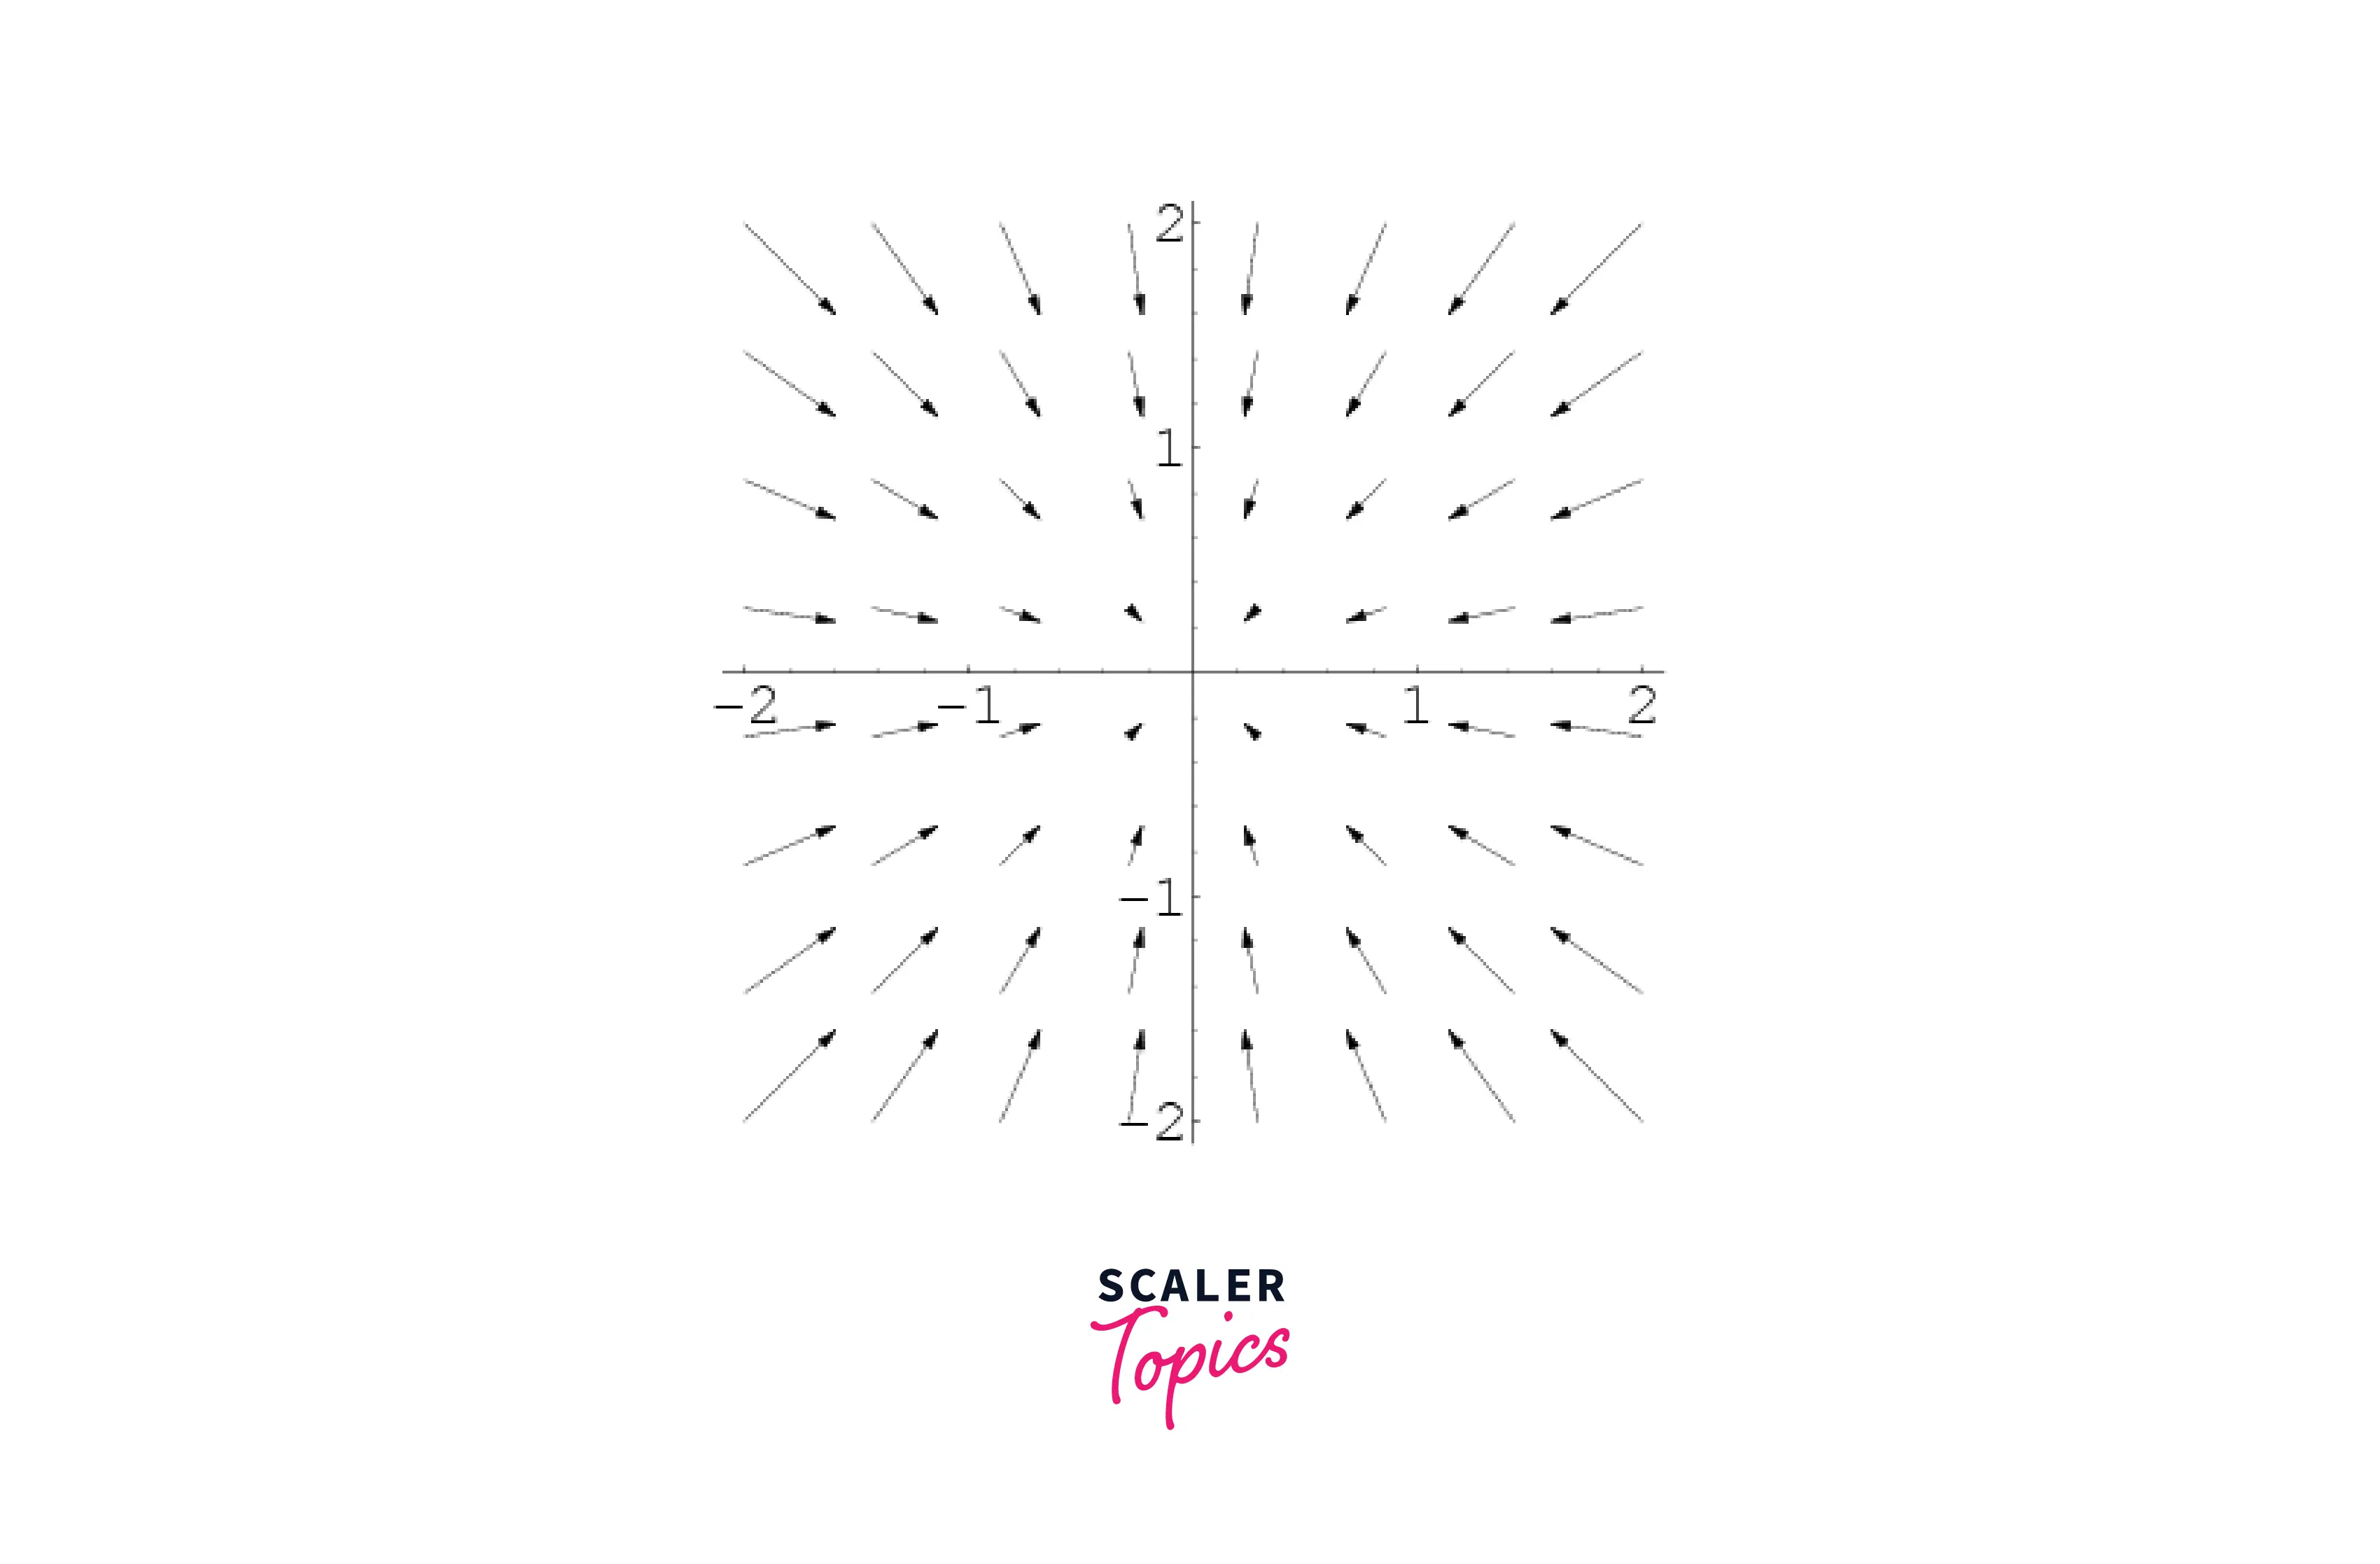
As we can see in the plot above, vector fields associate a 2D vector to each point of the 2D plane. This is why we can see an arrow pointing to the 2D space, representing a vector.
Now that we have learned about 2D vector fields, let us move on to Matplotlib and explore plotting methods.
Turn Learning into Career Growth
Methods to Plot a 2D Vector Field in Matplotlib
There are a handful of methods that are used to plot a 2D vector field in Matplotlib, and we will discuss three of them in this article; Using Axes.arrow(), quiver(), and streamplot() functions respectively.
-
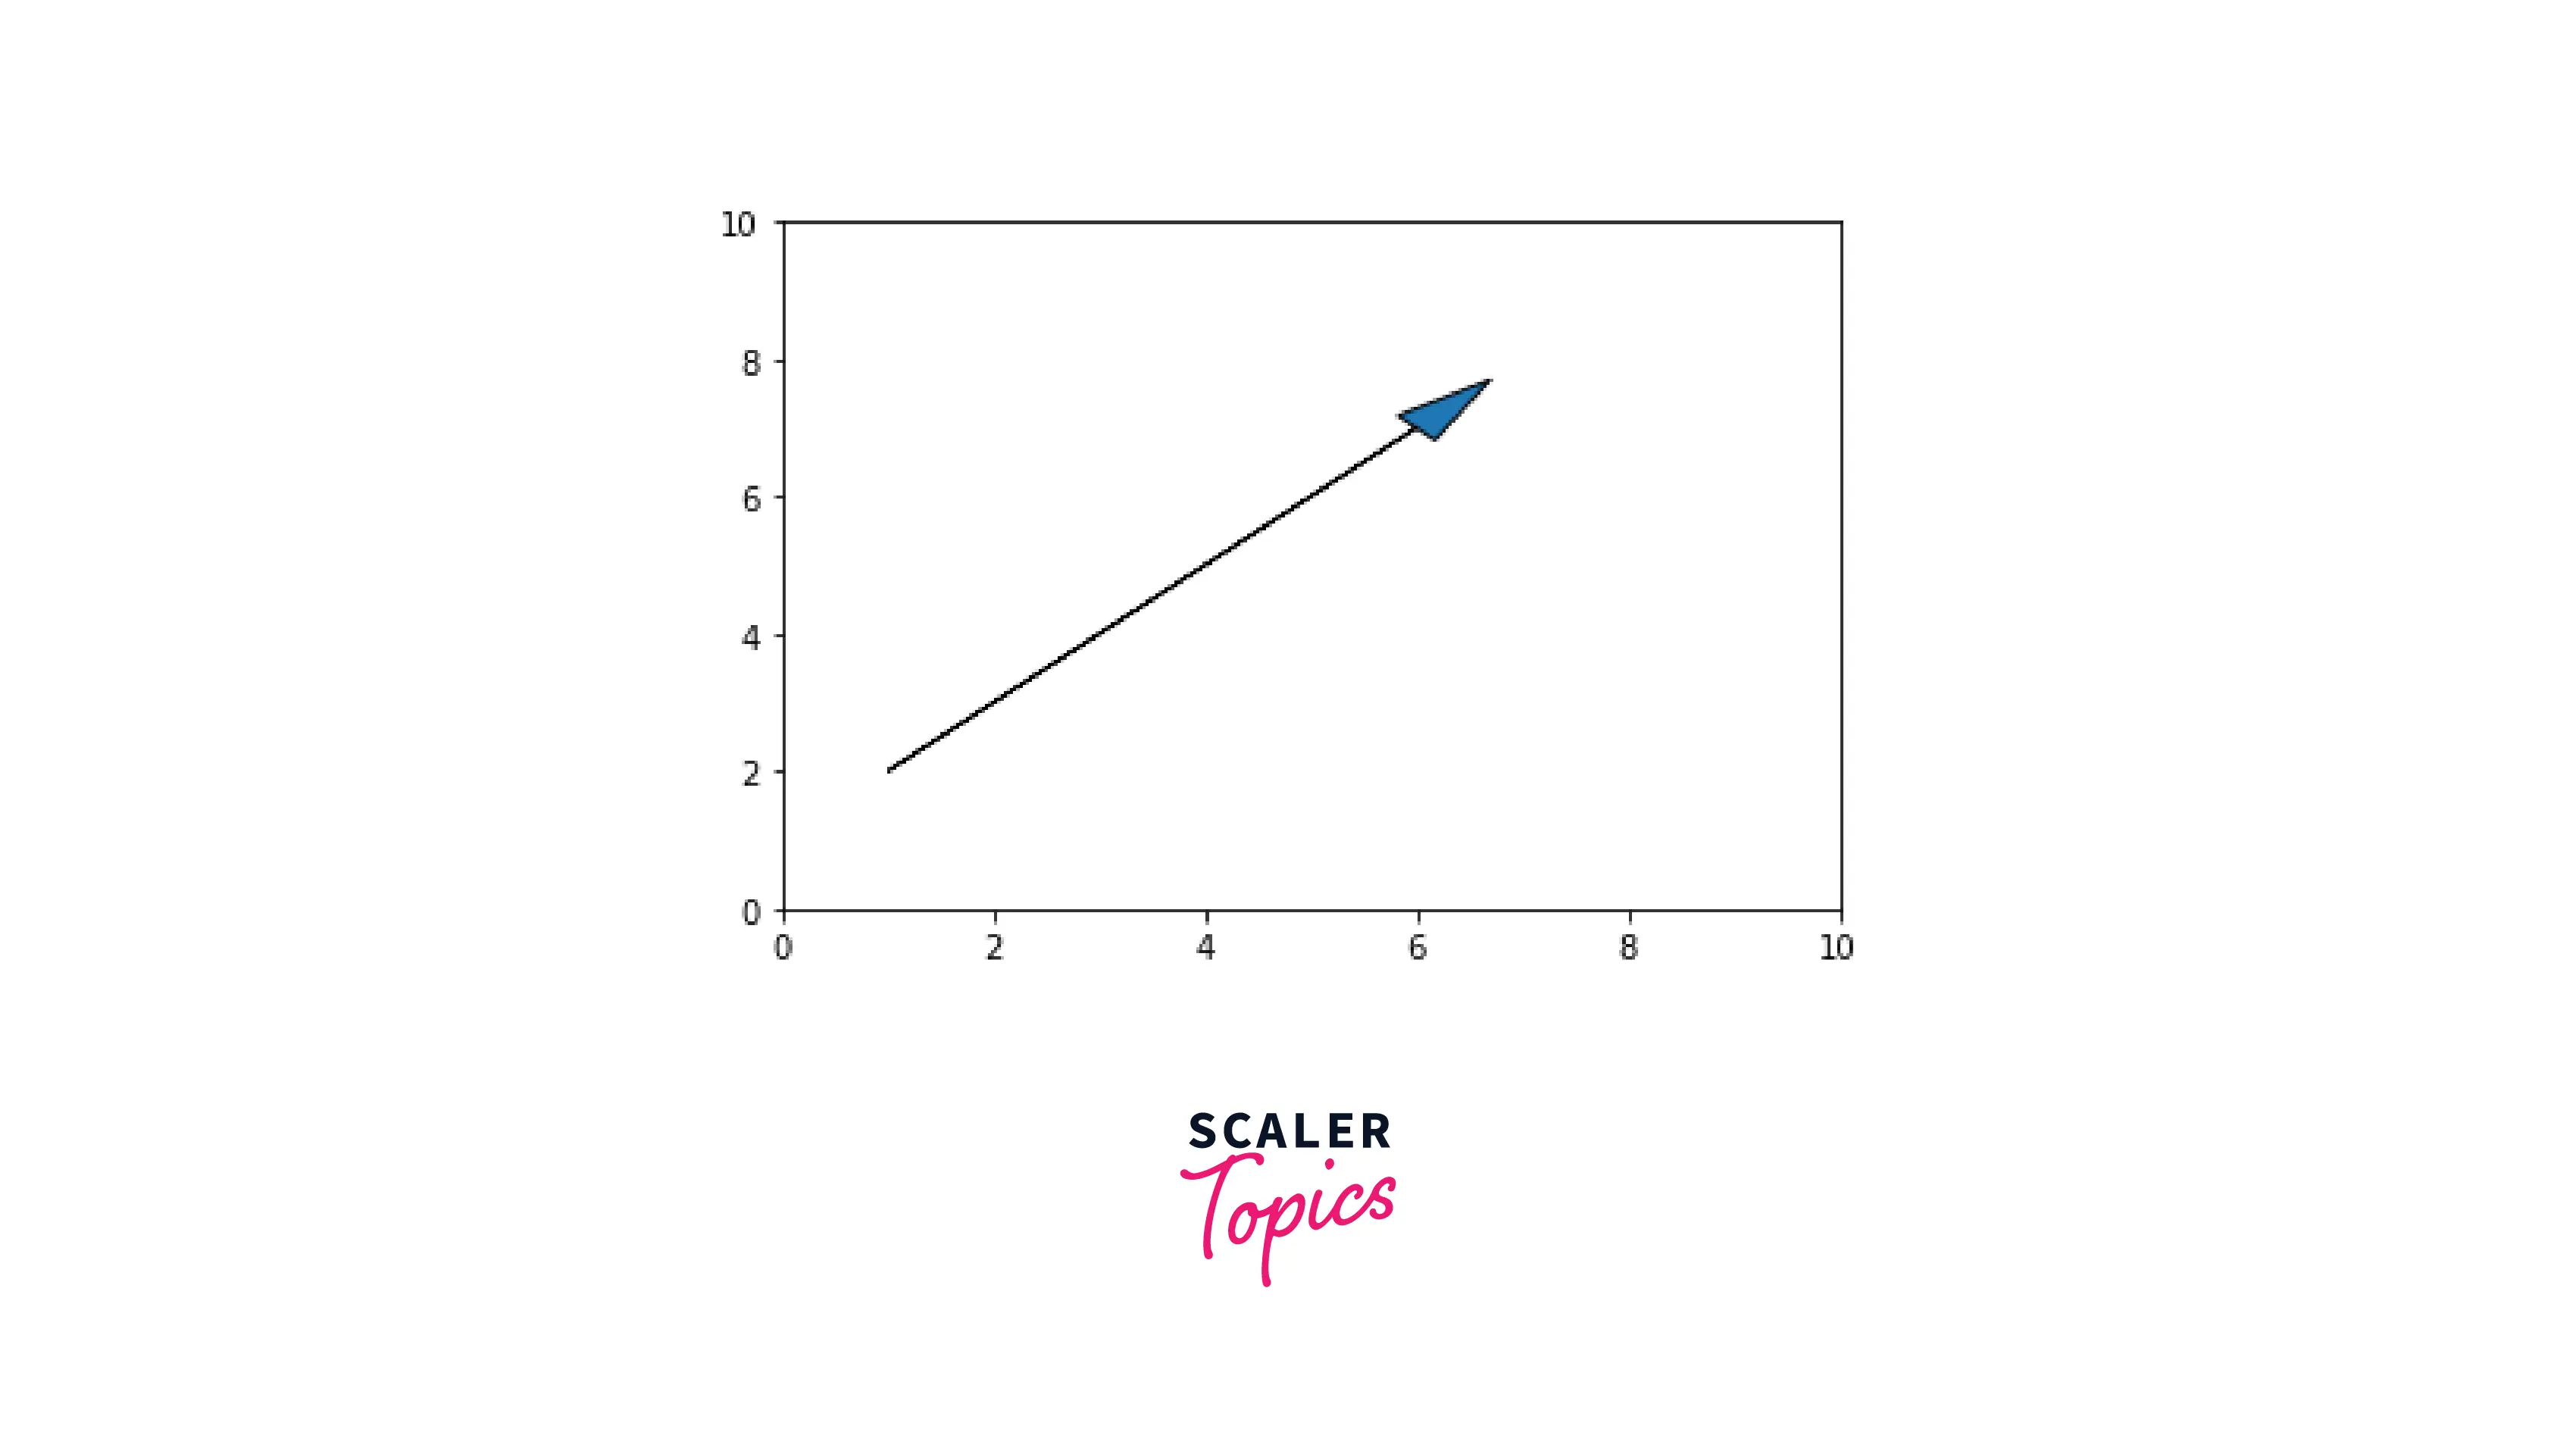
Using Axes.arrow() method to plot a Vector
In this method, we add an arrow to the plot using the Axes.arrow() function. This arrow will represent a vector in a two-dimensional vector field. This arrow takes in the start and end coordinates.
Output:
-
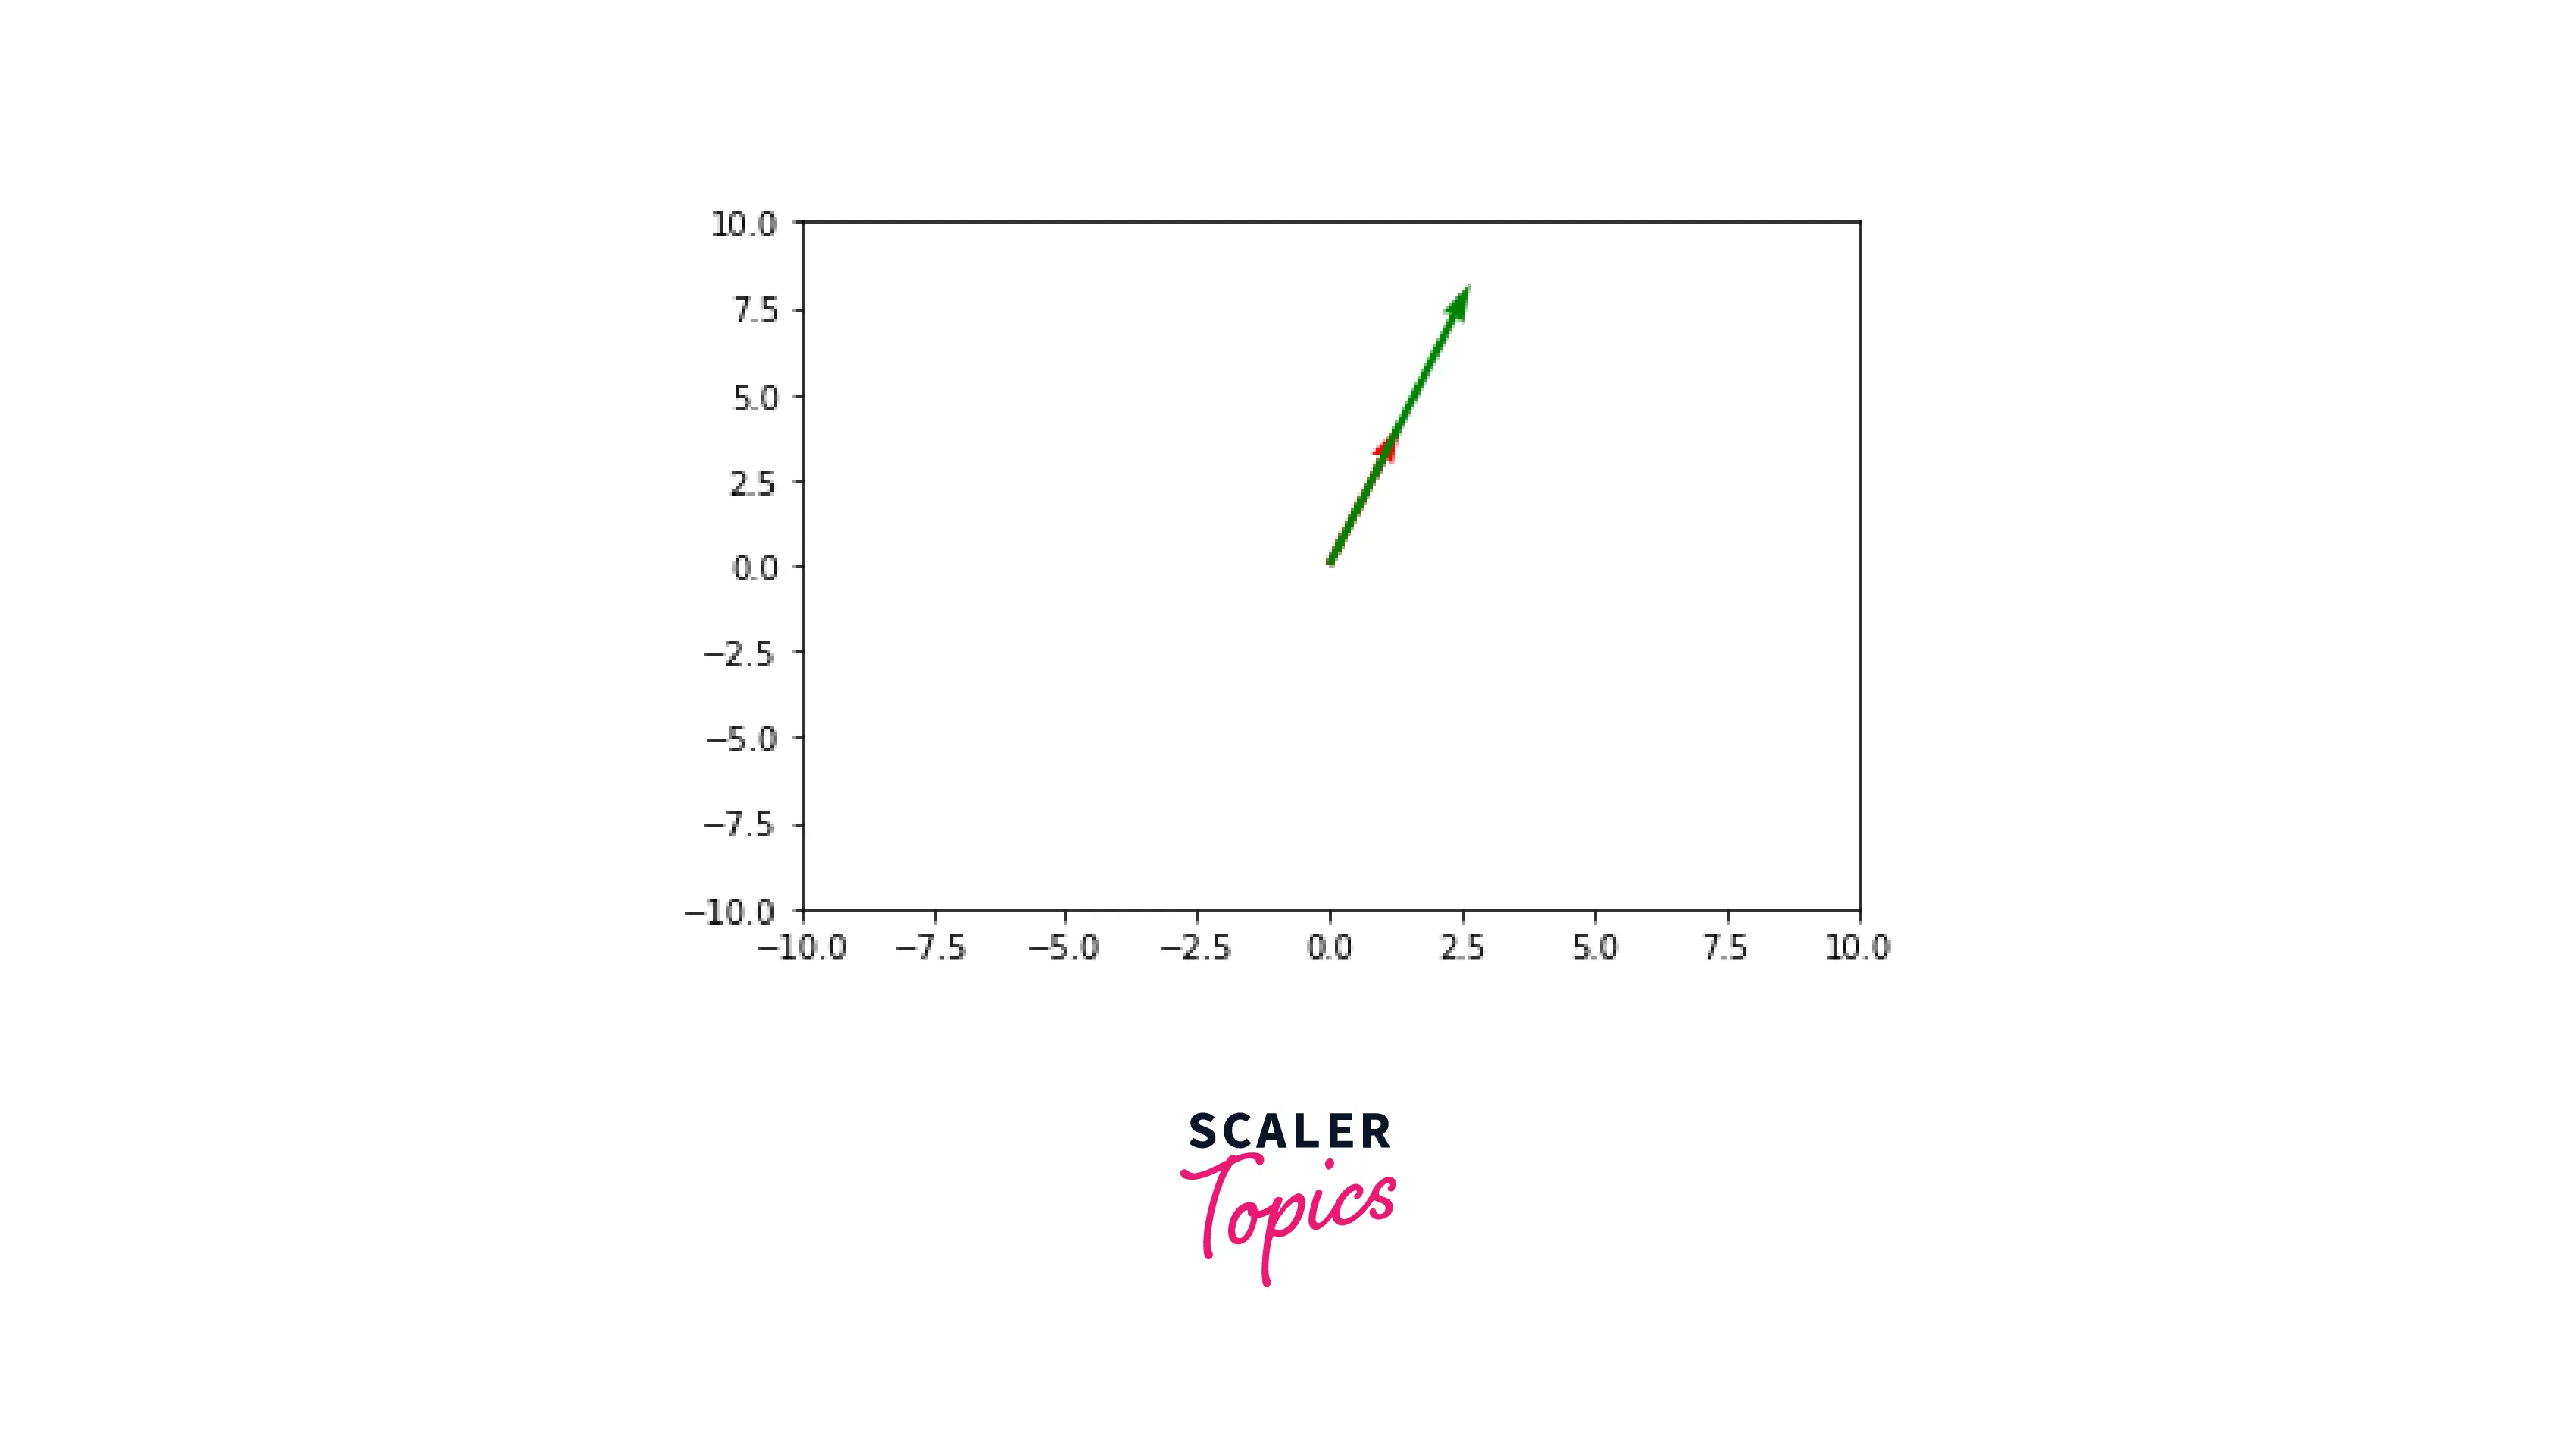
Using quiver() function method to plot a Vector
Just as we created an arrow using the Axes.arrow() function, we can create an arrow using the quiver() function too. This method will help us make multiple arrows to plot it on a 2D plot.
Output:
-
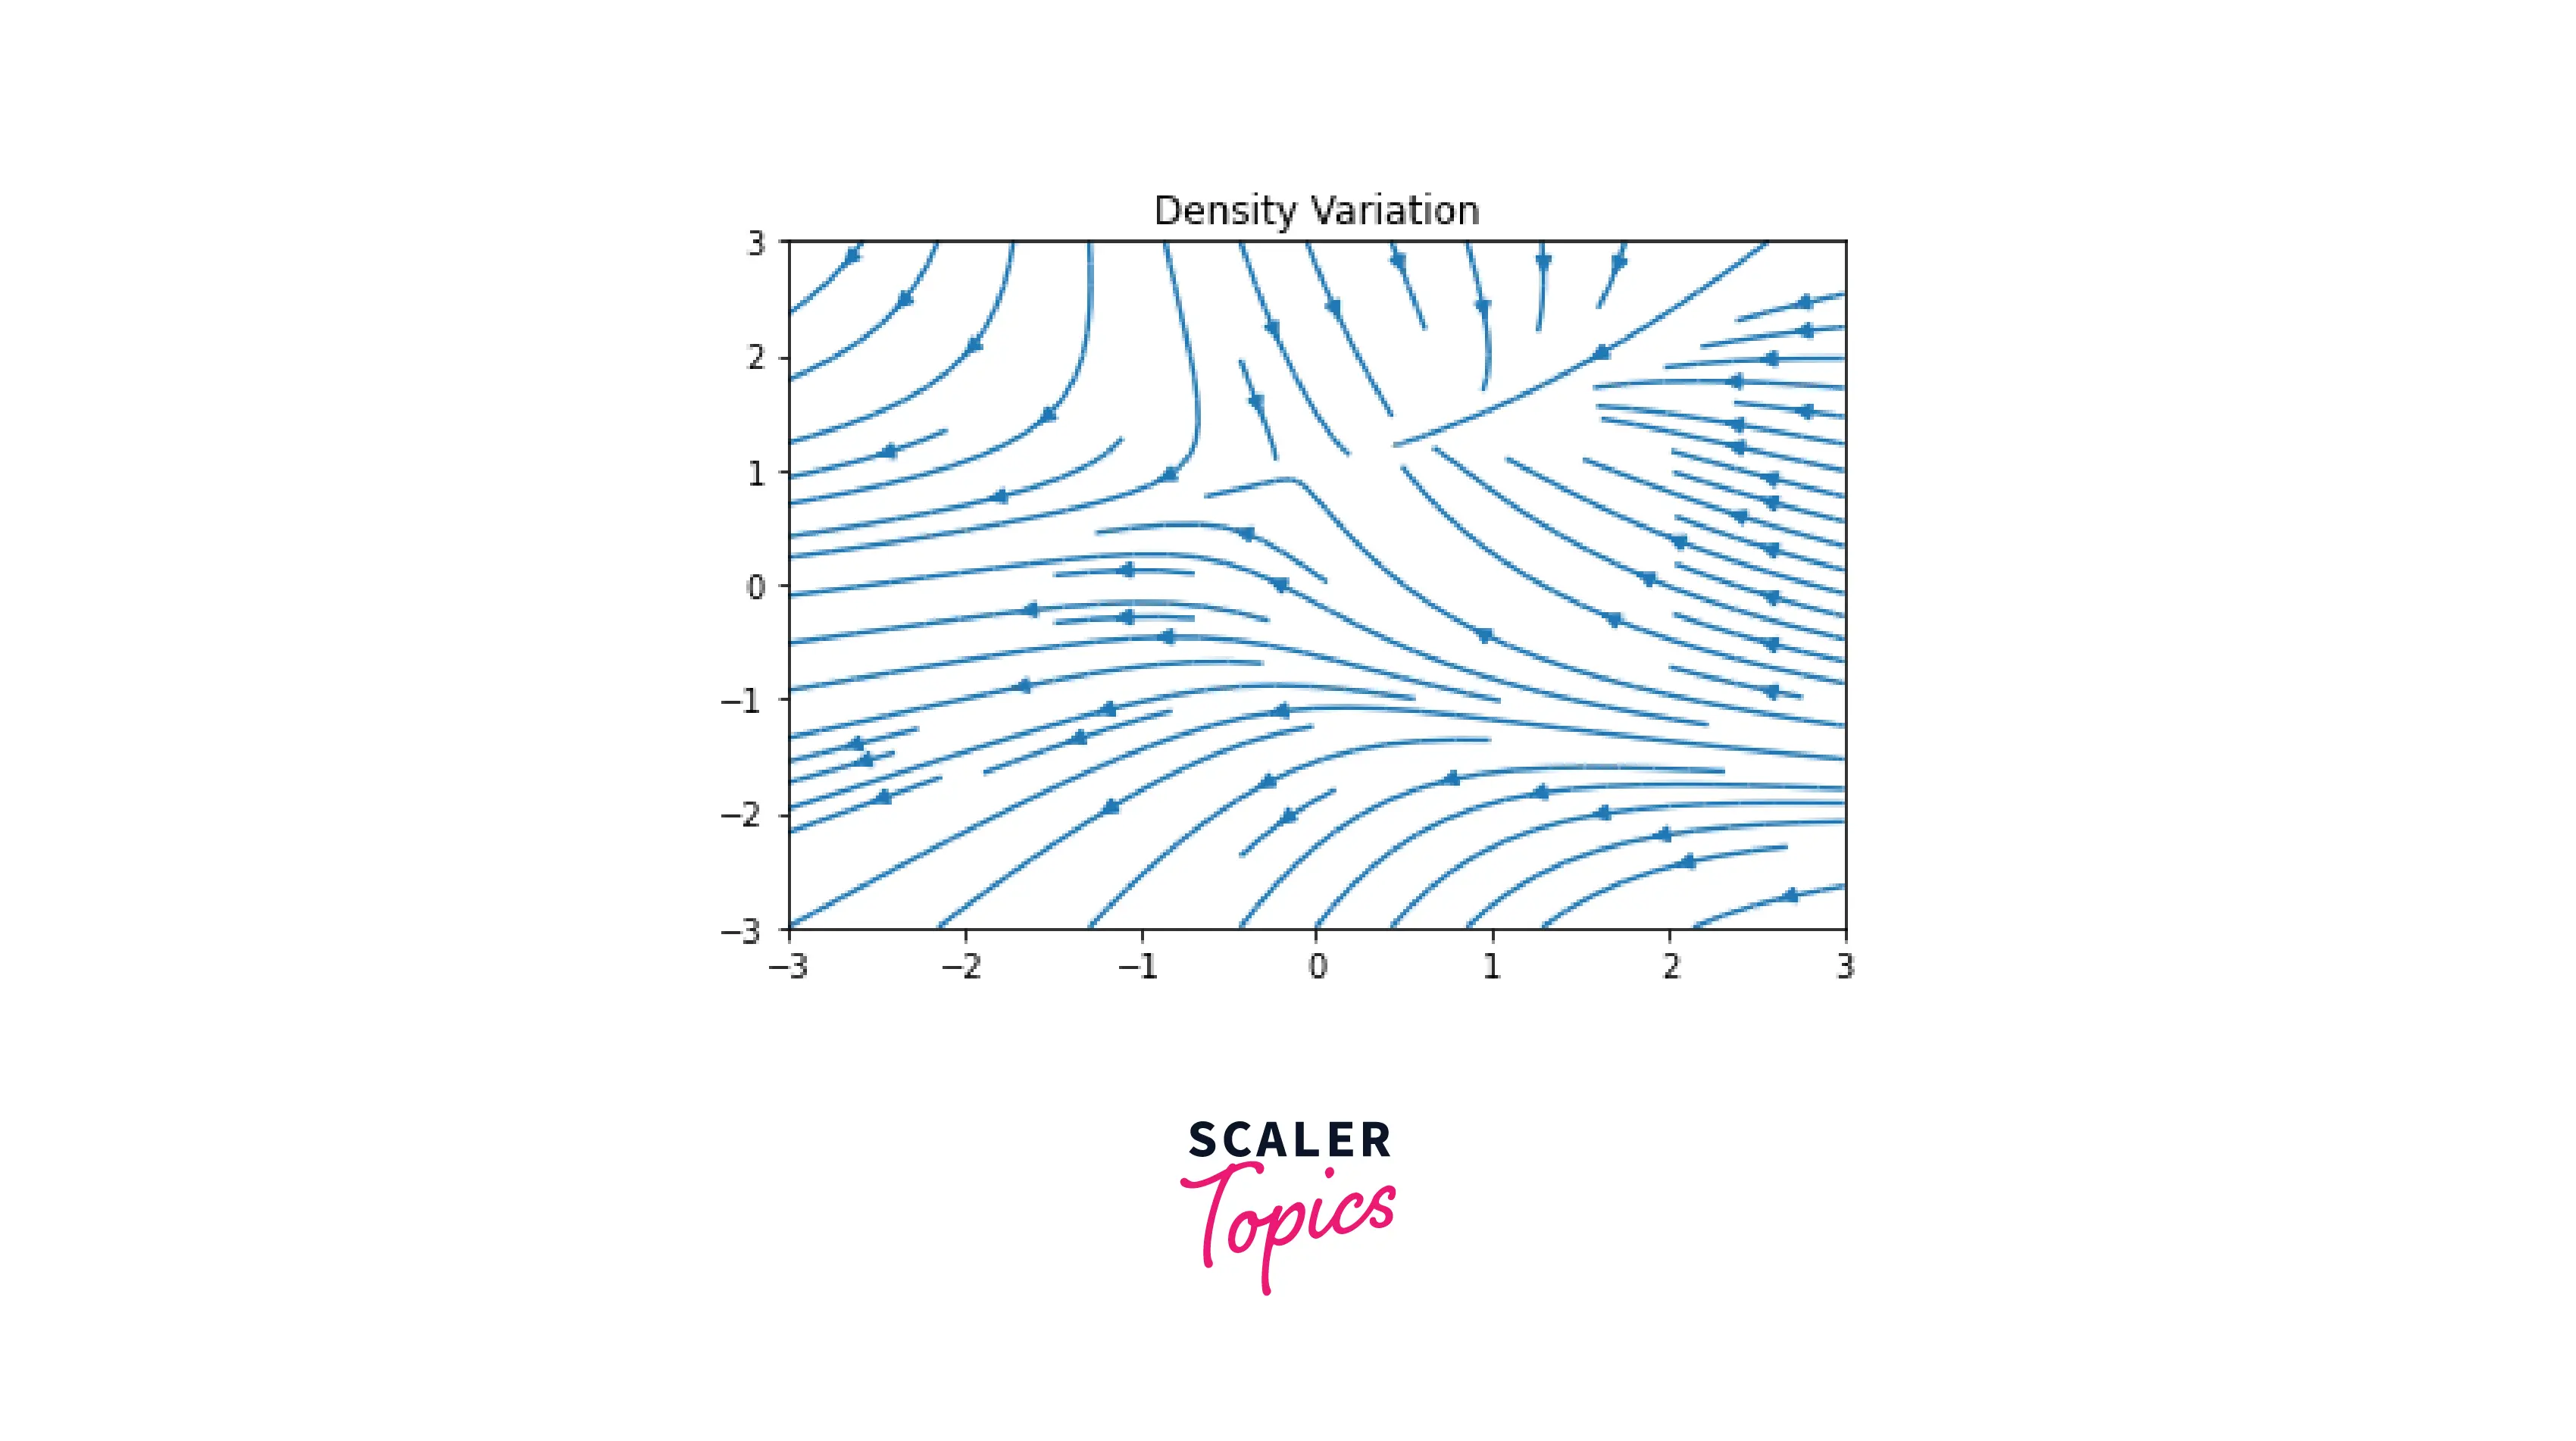
Using streamplot() function method to plot a Vector
streamplot() function in Matplotlib is also a handy function when it comes to creating 2D vector fields in Matplotlib. Compared to quiver and Axes.arrow(), streamplot() offers us many designing options; like color variations, density changes, etc.
Output:
Code Examples
-
Generating multiple vectors using quiver() method
As we created an arrow using quiver() earlier in this article, we can create multiple arrows and represent a 2D vector field using Matplotlib.
Output:
-
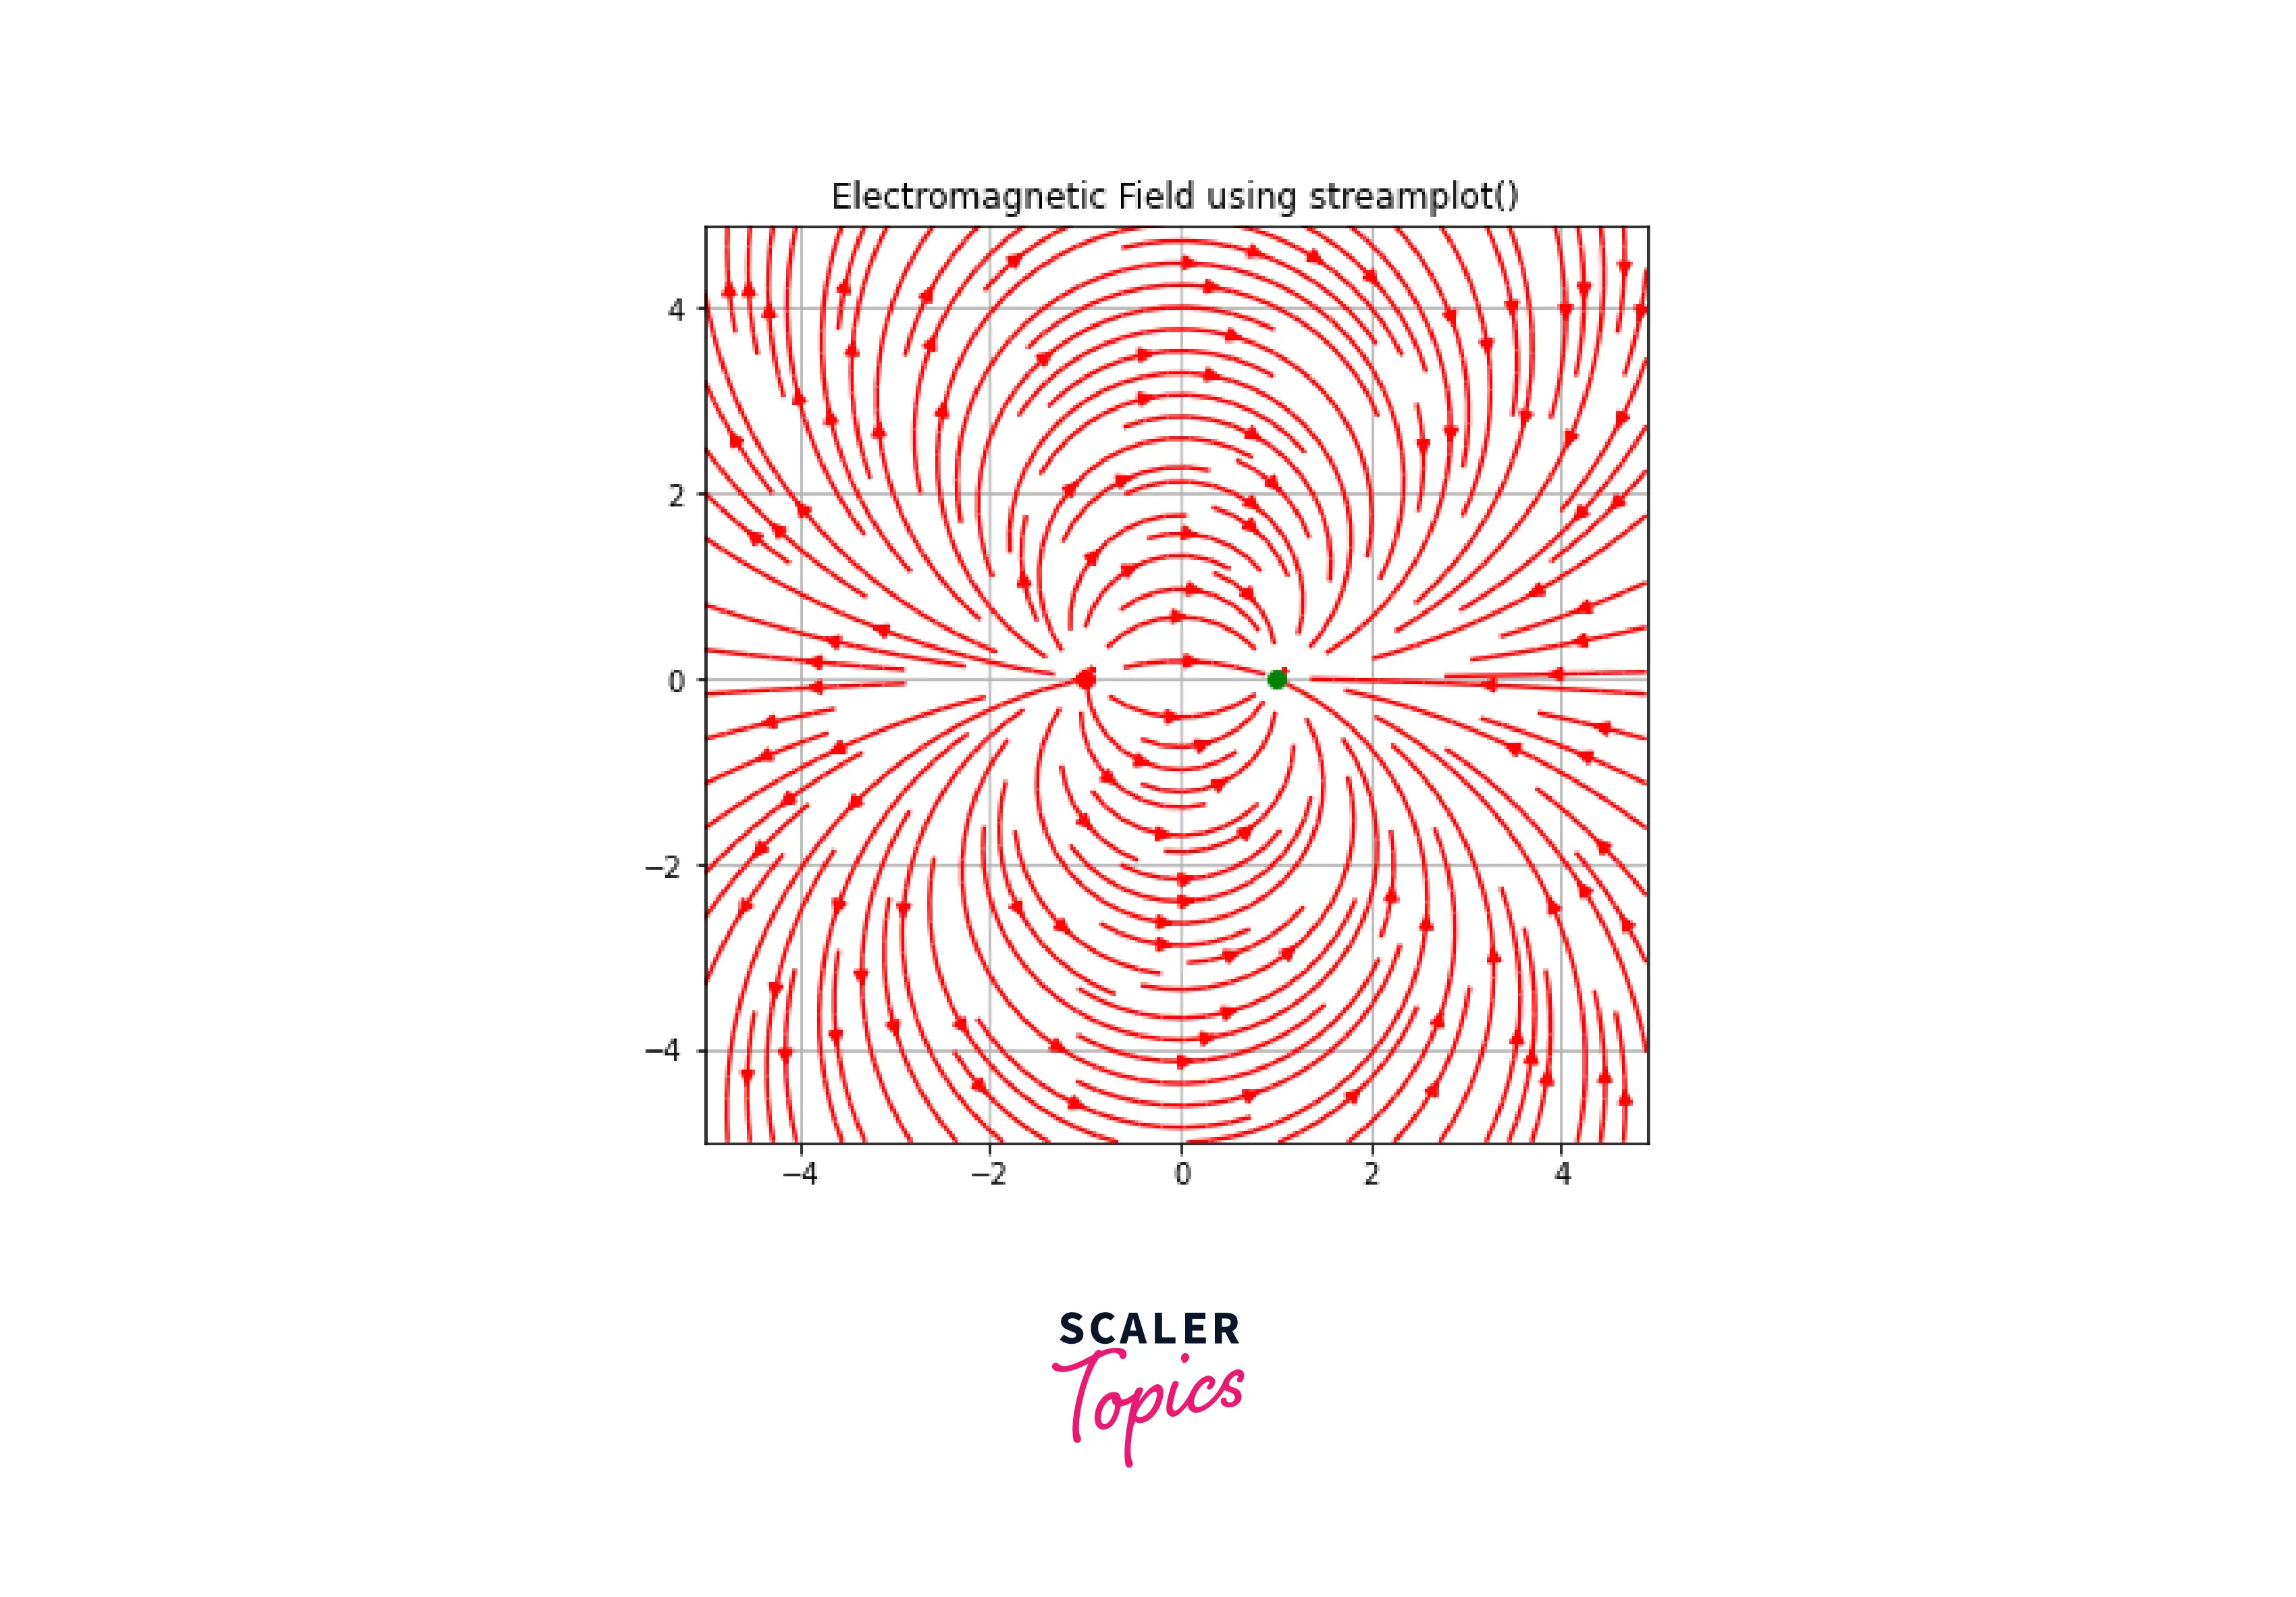
Plotting multiple vectors using streamplot() method in Matplotlib module
Earlier in this article, we used the streamplot() function to perform density variation in 2D vector fields. Now, we will use the streamplot() function to visualize an electromagnetic field using some vector directions and mesh grids.
Output:
Conclusion
- In this article, we learnt about vector fields; pictorial representation of vectors created using 2D spaces.
- Apart from learning the basics of 2D vector fields, we understood various methods to integrate Matplotlib with 2D vector fields.
- To conclude, we looked at several code examples; including electromagnetic waves and density variation using streamplot().