Integrating a Plot to a GTK User Interface
Overview
One of the languages that are experiencing phenomenal development and popularity each year is Python, the reason being its easy-to-use nature, dynamicity, and flexibility.
Python is flexible and dynamic, as a lot of computer software and hardware are easily compatible with it. From scanners to complex Machine Learning applications, we can create anything with Python. In this article, we will learn the basics of GTK (GIMP ToolKit), along with some ways to integrate GTK with Matplotlib.
Transform Your Career
Choose from our industry-leading programs designed for career success
Modern Software and AI Engineering Program
Master full-stack development with AI integration

Modern Data Science and ML with specialisation in AI
Advanced data science techniques with AI specialization
Advanced AIML with Specialisation in Agentic AI
Deep dive into AIML with focus on Agentic systems
DevOps, Cloud & AI Platform Engineering
Build and manage AI-powered cloud infrastructure
AI Engineering Advanced Certification by IIT-Roorkee
Premier AI engineering certification from IIT-Roorkee
Introduction
Python is dedicated to a lot of various libraries for diverse tasks including Machine Learning, Application Building, and Web Development, just as we described before in this article. Creating GUIs has to be one of the most underrated features that Python could offer. GUIs help us to create a working prototype of anything from a web application to an Android application.
Now, there are a lot of modules in Python that can be used for creating GUIs. The most popular ones are TKinter, Pyglet, wxWidgets, and GTK. GTK is used when developers are focused on big-scale Linux applications, whereas the other alternatives are used for small-scale applications.
In this tutorial, we'll talk about the GTK interface and show how to use Matplotlib with it.
What is GTK?
A user interface framework known as GTK (also known as GIMP ToolKit) is particularly popular in Linux environments for building potent Linux-powered apps. The PyGObject that GTK provides is very convenient to use for developers to create applications.
Every feature a widget toolkit needs is present in GTK. It is the most dependable toolkit for creating Linux applications because of these capabilities.
There are various widgets that we can use in GTK to jump-start our applications, like Gtk.Window, Gtk.Application and Gtk.Image.
Integration of GTK with the User Interface
Python-based Matplotlib is a dynamic, all-purpose framework that enables us to build plots and visualizations that are informative and illustrative. We can build interactive programs with dynamic user interfaces and beautiful visuals using Matplotlib and GTK!
Output
Note: The output window that is displayed after the code is run will vary platform-wise. As a result, the Windows application may appear differently than it does in the Linux environment.
How Does the Integration Work?
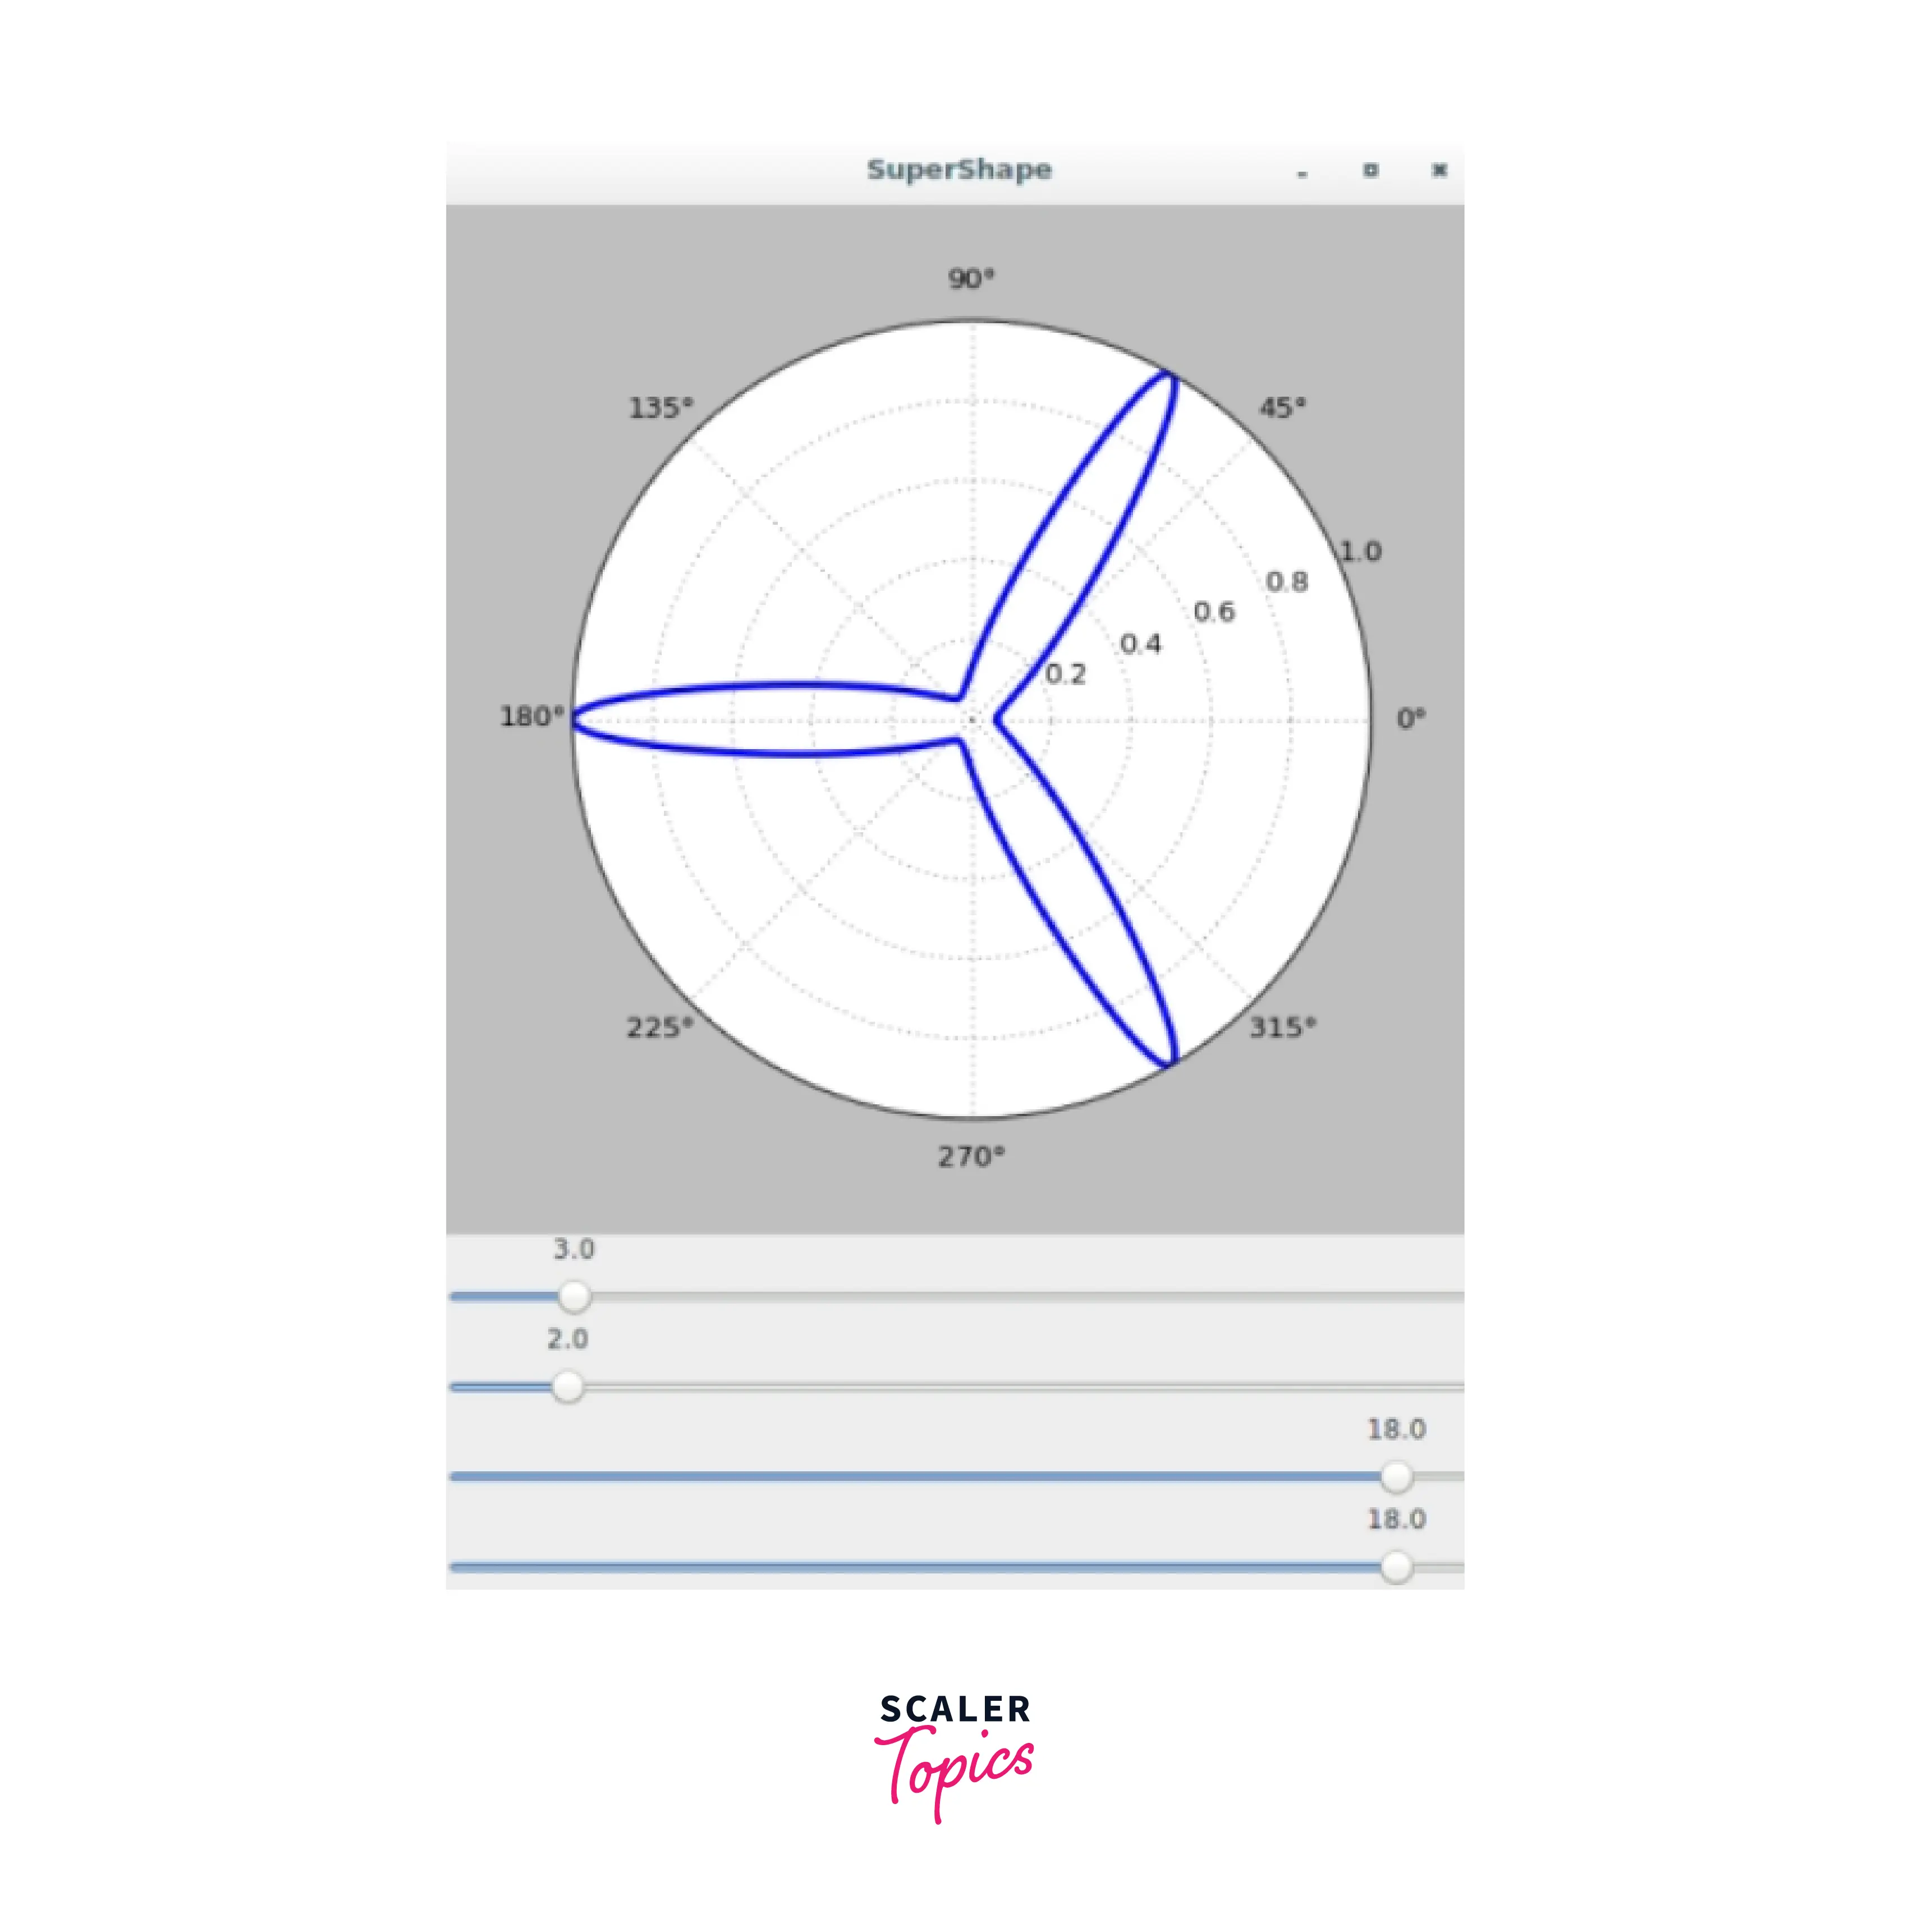
From the backends module in Matplotlib (matplotlib.backends.backend_gtk3agg to be specific), the FigureCanvasGTK3Agg object is a GTK widget that contains our Matplotlib figure. Using this object provided by GTK, we set up the size and dimensions of our canvas object:
The draw_figure() function helps us to create the plot and display our canvas, and the refresh_figure() is used to refresh our canvas when the GUI detects any change in the sliders. This is done to reflect the changes on the slider to the canvas.
Code Examples
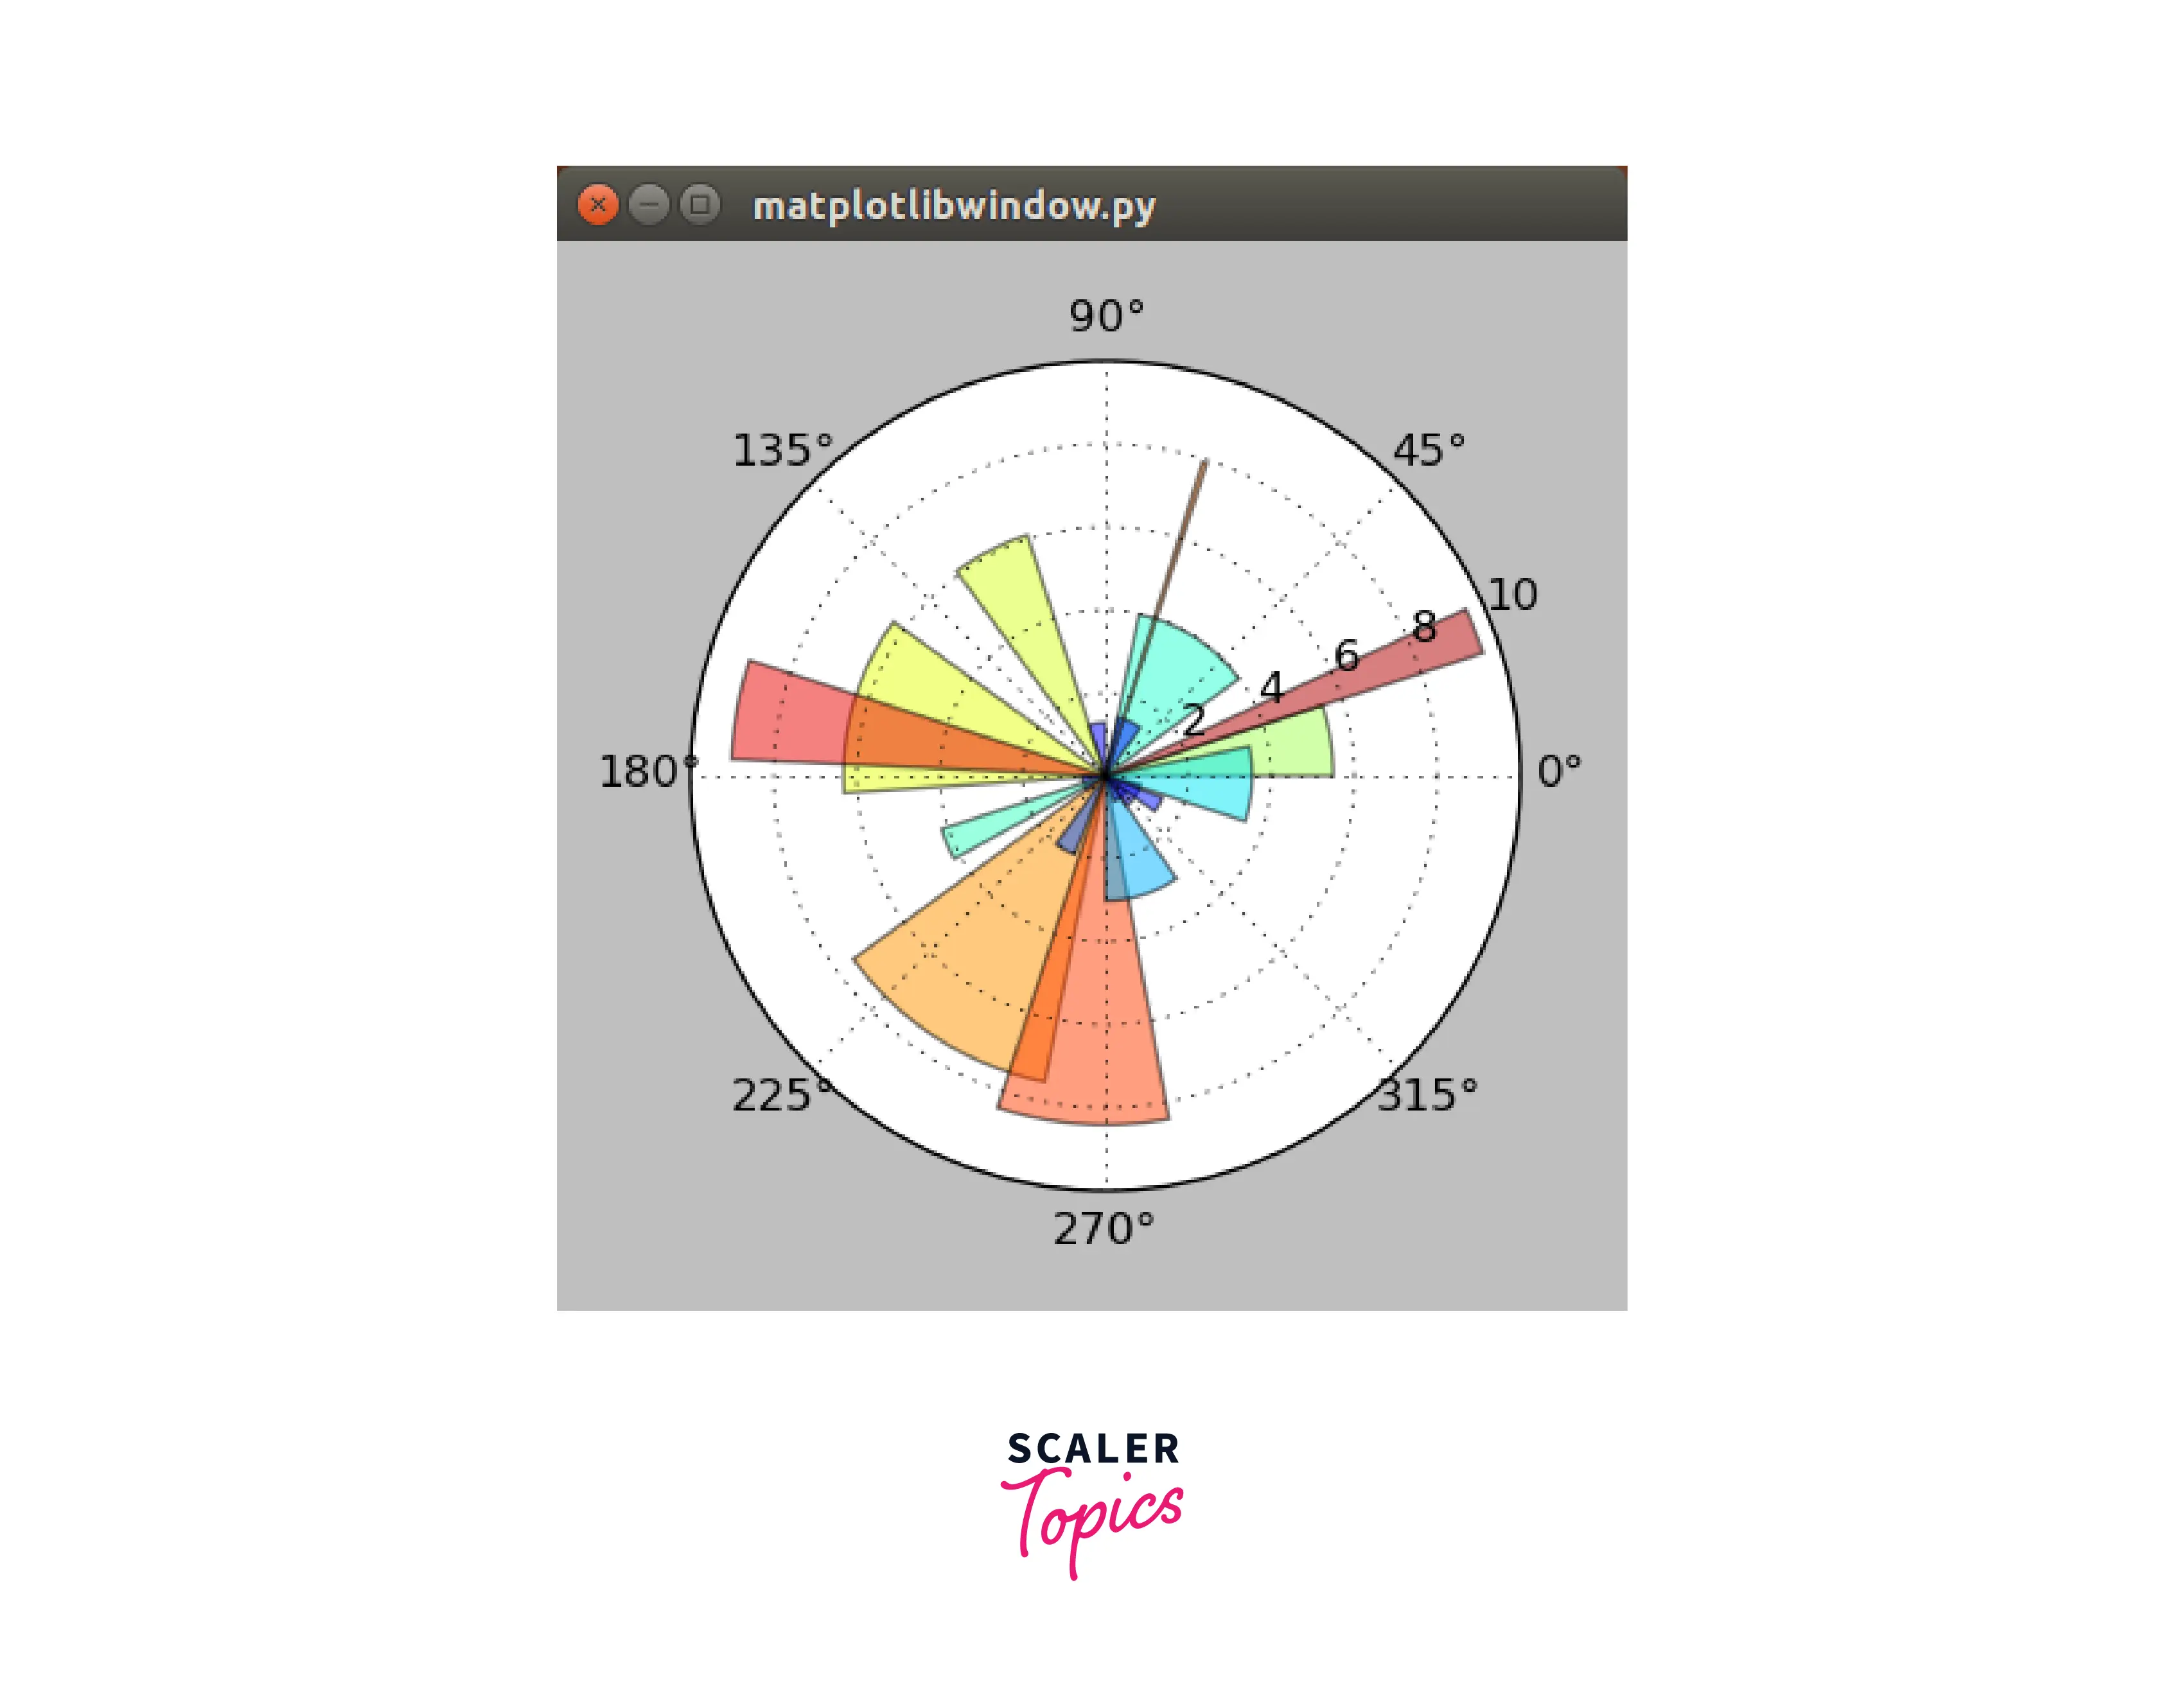
Creating a compass containing various angles using GTK and Matplotlib
In this example, we will render a compass using GTK and Matplotlib just as we created a SuperShape previously in this article.
Output
Conclusion
- In this article, we covered GTK; a framework written in Python for creating state-of-the-art user interfaces for Linux environments. An object called PyGoObject helps developers to create and initialize applications using GTK.
- We learned various ways to integrate Matplotlib with GTK; which allows us to create interactive and visually-appealing UIs (User Interfaces).